


COVID-19 Mortality Working Group – Excess mortality in first two months of 2023 is mainly due to COVID-19
Catch up on the Actuaries Institute’s COVID-19 Mortality Working Group’s latest analysis of excess deaths.
In summary:
|
Background
The COVID-19 Mortality Working Group has examined the latest Provisional Mortality Statistics, covering deaths occurring prior to 28 February 2023 and registered by 30 April 2023, released by the Australian Bureau of Statistics (ABS) on 26 May. This release also included the article COVID-19 Mortality in Australia, with details on all COVID-19 deaths occurring and registered by 30 April 2023.
We calculate excess deaths by comparing observed deaths to our “baseline” predicted number of deaths for doctor-certified deaths (by cause) and coroner-referred deaths (for all causes combined).
Throughout this article, we separate COVID-19 deaths into:
- deaths “from COVID-19”, namely deaths where COVID-19 is listed as the primary/underlying cause of death; and
- deaths that were “COVID-19 related”, namely deaths where the underlying cause of death has been determined as something other than COVID-19, but COVID-19 was a contributing factor mentioned on the death certificate.
The COVID-19 deaths covered in this article are distinct from “incidental COVID-19” deaths, namely deaths where the person was COVID-19 positive at the time of death, but COVID-19 was not recorded on the death certificate. These deaths are generally included in surveillance reporting where identified (other than where there is a clear alternative cause of death, such as trauma) but are not separately identified in the ABS statistics.
We have used additional data supplied by the ABS in a customised report in relation to COVID-19 deaths registered by 30 April 2023, namely the total number of deaths each week (doctor-certified and coroner-referred) both from COVID-19 and COVID-19 related.
Baseline Predictions
Our previous Actuaries Digital articles have discussed in some detail how we arrived at our baseline predicted deaths. Our baselines will be fully documented in a forthcoming Research Note. In short, our baselines by cause of death are set by extrapolating linear regression models fitted to Standardised Death Rates (SDRs), which are then re-expressed as numbers of deaths. That means that our baselines allow for changes in the size and age composition of the population, plus the continuation of pre-pandemic mortality trends.
With the changes to the ABS data released in respect of 2023 (a small definitional change for dementia deaths[1], separately reporting on deaths from “other cardiac conditions”[2], updates of the population estimates in accordance with the ABS’s usual estimation protocols), we have refitted our models to allow for the extra information. We have broadly followed the same approach as previously.
Table 1 – Comparison of Baselines – Current Estimates versus Previous Estimates
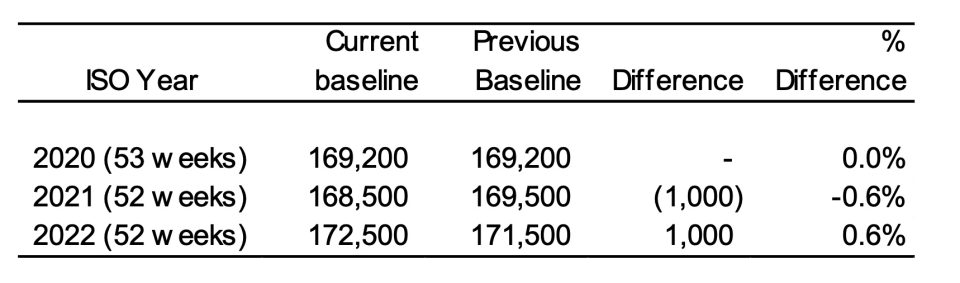
The extra information has:
- reduced the 2021 baseline deaths by less than 1% (1,000 fewer projected deaths), largely because of the reduction in the ABS population estimate for 2021; and
- increased the 2022 baseline deaths by less than 1% (1,000 extra projected deaths), largely due to the impact of the ABS’s changes to the definition of dementia and separate reporting of “other cardiac conditions”.
Further details on the changes to the baseline are included at the end of this article.
These changes illustrate the sensitivity of baseline deaths (and, hence, excess deaths) to the data and assumptions used. Small changes in data can result in small changes in the baseline deaths, which can result in a proportionately larger impact on excess deaths.
Excess deaths to 28 February 2023
Figure 1 shows the results of our analysis, comparing actual deaths each week to our predicted values and the 95% prediction interval.
Figure 1 – Weekly actual and predicted deaths – All Causes
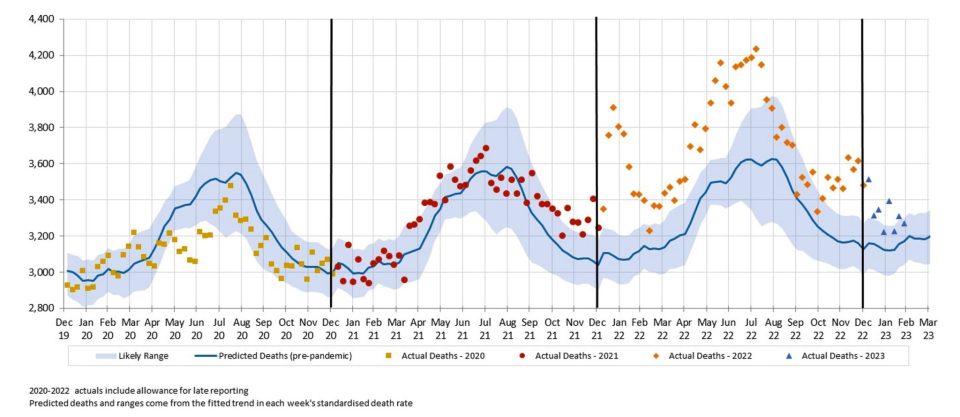
Five out of the first eight weeks of 2023 were well above the upper end of the 95% prediction interval, as was the case for the majority of 2022. The other three weeks of 2023 were above the expected level.
Figure 2 shows deaths from COVID-19 and COVID-19 related deaths, noting that, given small numbers, weekly data for COVID-19 related deaths is not available for 2020 or 2021.
Figure 2 – Weekly actual and predicted deaths – from COVID-19 and COVID-19 related*
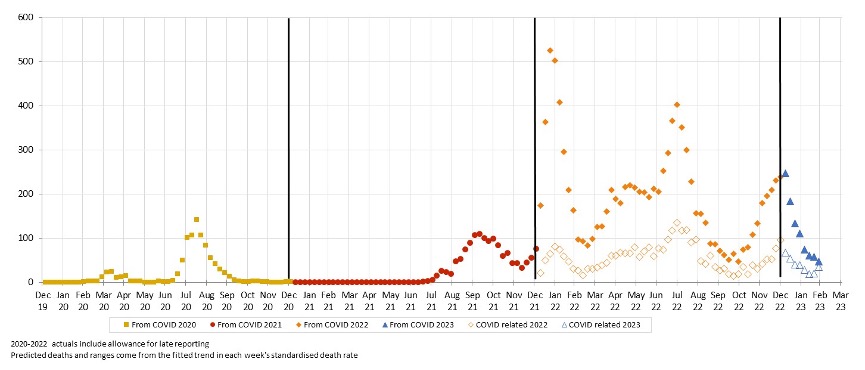
* COVID-19 data from ABS customised report 2023
Deaths from COVID-19 fell across January and February, averaging 60 deaths per week in February 2023. COVID-19 related deaths followed broadly the same pattern as from COVID-19 deaths, averaging 25 deaths per week in February 2023.
Figure 3 – Weekly actual and predicted deaths – All Causes excluding deaths from COVID-19 and COVID-19 related deaths
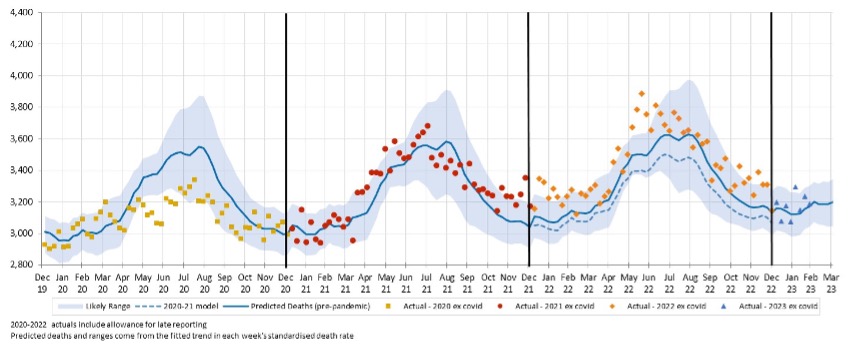
Figure 3 compares actual and predicted deaths, after removing deaths from COVID-19 and COVID-19 related deaths. It shows that non-COVID-19 deaths in the first eight weeks of 2023 were within the 95% prediction interval other than the first week of February.
Excess deaths to 28 February 2023 by Cause of Death
Table 2 shows our estimate of excess deaths broken down by cause. We have shown the figures for the first two months of 2023 plus the full year 2022. We have shown actual deaths broken down onto those that are either from COVID-19 or COVID-19 related, and those without COVID-19 on the death certificate (“non-Covid”).
As in our previous work, we have estimated the number of coroner-referred COVID-19 deaths based on the experience of late 2021 and the emerging experience in 2022. If our estimate of coroner-referred COVID-19 deaths is too high (or low), this will not affect the total level of excess deaths measured; it will just mean that our estimate of non-COVID-19 coroner-referred deaths will be too low (or high) by the same amount.
Table 2 – Excess deaths in Australia – By Cause of Death for the first two months of 2023 and for 2022
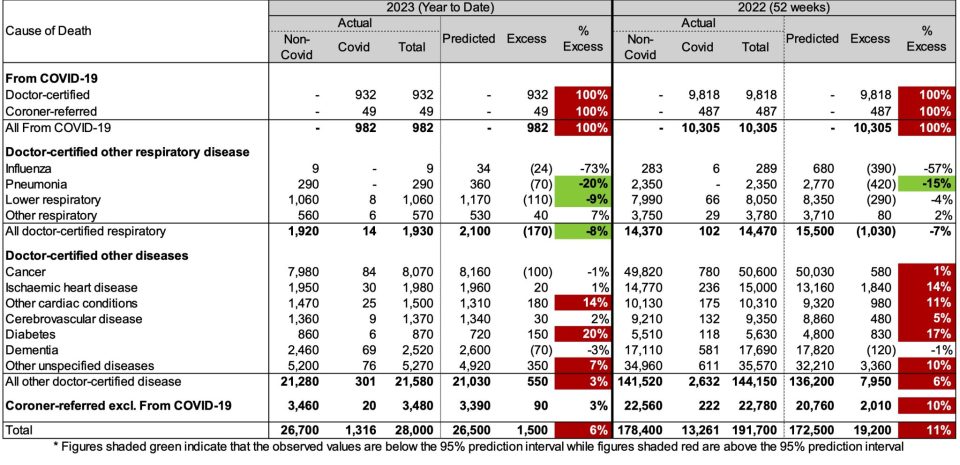
In the first two months of 2023:
- total deaths were 6% (or +1,500) higher than predicted. 1,000 of these excess deaths occurred in January (7% excess) and 500 in February (4% excess);
- there were 980 deaths from COVID-19, representing two-thirds of the excess deaths;
- there were 335 COVID-19 related deaths included among the other causes of death (1,316 less 982), representing a further 25% of the excess deaths. The remaining 10% of excess deaths (c. 150) have no mention of COVID-19 on the death certificate, which is lower than the proportion for 2022 (33%); and
- doctor-certified deaths from other cardiac conditions, diabetes and other unspecified diseases were all significantly higher than predicted (by between 7% and 20%), while deaths from pneumonia and lower respiratory disease were significantly lower than predicted (20% and 9% respectively).
Figure 4 shows excess deaths (as a % of predicted) for each month of 2022 and 2023. We have shown the total excess (blue) and the contributions of:
- deaths from COVID-19 and COVID-19 related deaths (orange), noting that Figure 2 showed that deaths from these two sources move in the same pattern;
- deaths from respiratory disease (yellow); and
- deaths from all other causes (grey).
Figure 4 – Excess deaths (% of predicted) by month in 2022 and 2023
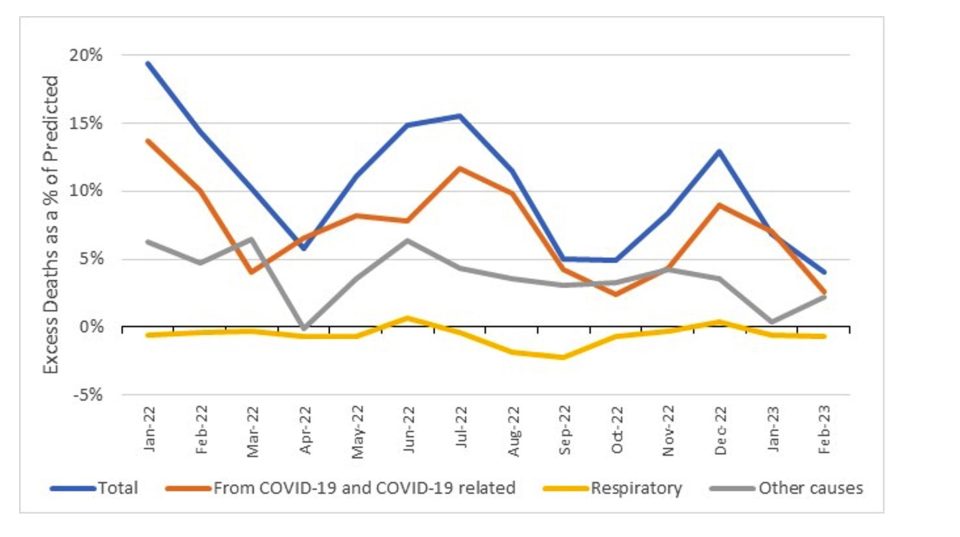
Deaths from COVID-19 and COVID-19 related deaths are the clear drivers of the majority of the excess mortality.
Deaths from respiratory disease have mostly been a negative contributor to excess mortality. We can see the impact of the early, lighter than average, influenza season in 2022 with a small contribution to excess mortality in June 2022, more than offset by high negative contributions in August and September 2022 (the months where influenza deaths usually peaked before the pandemic).
Excess deaths from other causes (i.e., non-COVID-19, non-respiratory), somewhat follows the pattern of COVID-19 mortality; it tends to be higher when COVID-19 (and respiratory) deaths are high and tends to be low when COVID-19 deaths are low. However, the relationship is not 100% correlated – e.g., there was substantial non-COVID-19, non-respiratory excess mortality in September and October 2022 when both COVID-19 and respiratory deaths were relatively low.
Ischaemic heart disease and other cardiac conditions
With the new ABS data on other cardiac conditions, we have compared standardised death rates for ischaemic heart disease (“IHD”, ICD-10 codes I20-I25) and other cardiac conditions (“OCC”, ICD-10 codes I26-I51). The main conditions making up deaths from IHD are acute myocardial infarction (heart attack) and chronic ischaemic heart disease. The main conditions making up deaths from OCC are non-rheumatic aortic valve disorders, cardiomyopathy, atrial fibrillation and flutter, and heart failure.
Figure 5 shows both the actual SDRs and the fitted models.
Figure 5 – Standardised Death Rates for IHC and OCC
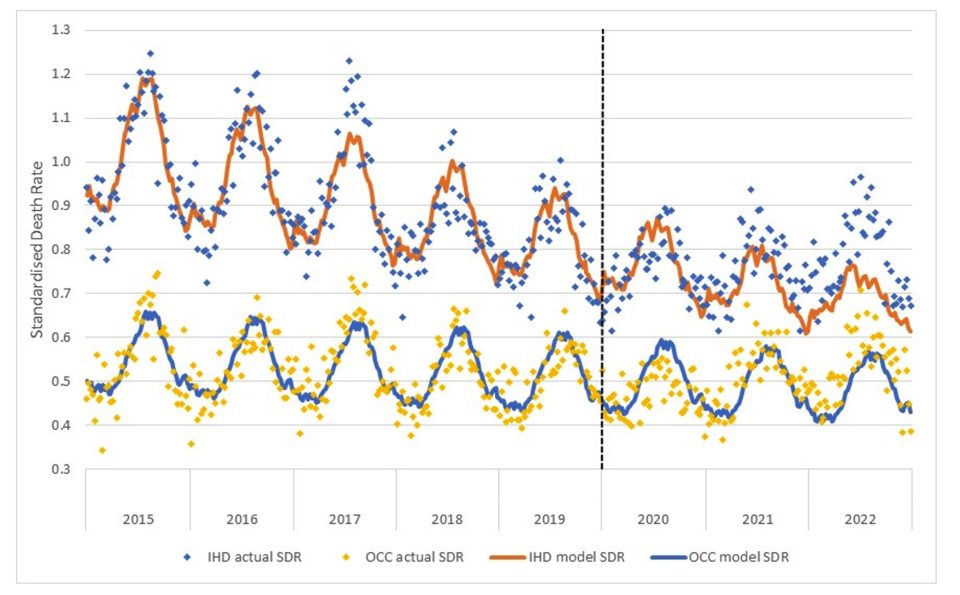
The comparison is interesting:
- pre-pandemic, deaths from IHD were clearly reducing at a much faster rate than deaths from OCC;
- the influence of influenza disease is also apparent – the “bad” flu season of 2017 is evident in the higher peaks in both series in that year, and the absence of influenza in 2020 has resulted in fewer deaths in winter of that year in both series; and
- there have been much higher deaths than predicted in both 2021 and 2022 in both series.
Details of new modelling of projected deaths
Earlier, we discussed the changes to the ABS data released in respect of 2023, and we said that we had refitted our models to allow for the extra information. We have broadly followed the same approach as previously.
We have trained the regression models on different years of data, depending on the cause of death:
- For the 2020 and 2021 projections, we have used the 2015-19 experience to train the model for all causes.
- For the 2022 and 2023 projections, we have:
- used 2015-19 experience to train the model for deaths from respiratory disease, dementia, diabetes and other cardiac conditions, on the basis that 2020 and 2021 experience for these causes was materially affected by the pandemic. Including diabetes and other cardiac conditions in this group is a change from our previous approach; and
-
- used 2015-21 experience to train the model for deaths from all other causes and for coroner-referred deaths, on the basis that it is likely that 2020 and 2021 experience more closely reflects a slow-down in underlying mortality improvement than the impacts of the pandemic.
Given the high level of excess mortality in 2022, and our intent for our baseline to reflect the expected number of deaths “in the absence of the pandemic”, we decided that it would be inappropriate to include any experience from 2022 in setting our baseline for 2023.
Therefore, the baselines for our estimates of excess deaths are “in the absence of the pandemic” for each of the four years 2020 to 2023. We have not included any COVID-19 deaths in the baselines, as these would not exist in the absence of the pandemic.
As always, it is important to note that predicted death numbers are increasing faster from demographic changes (ageing and population size) than they are reducing due to mortality improvement, even though age-adjusted death rates are reducing. Therefore, our model predicts higher baseline numbers of deaths in each successive year.
Table 3 shows a comparison of our revised baselines compared to the previous baselines used throughout 2022.
Table 3 – Comparison of Baselines – Current Estimates versus Previous Estimates*
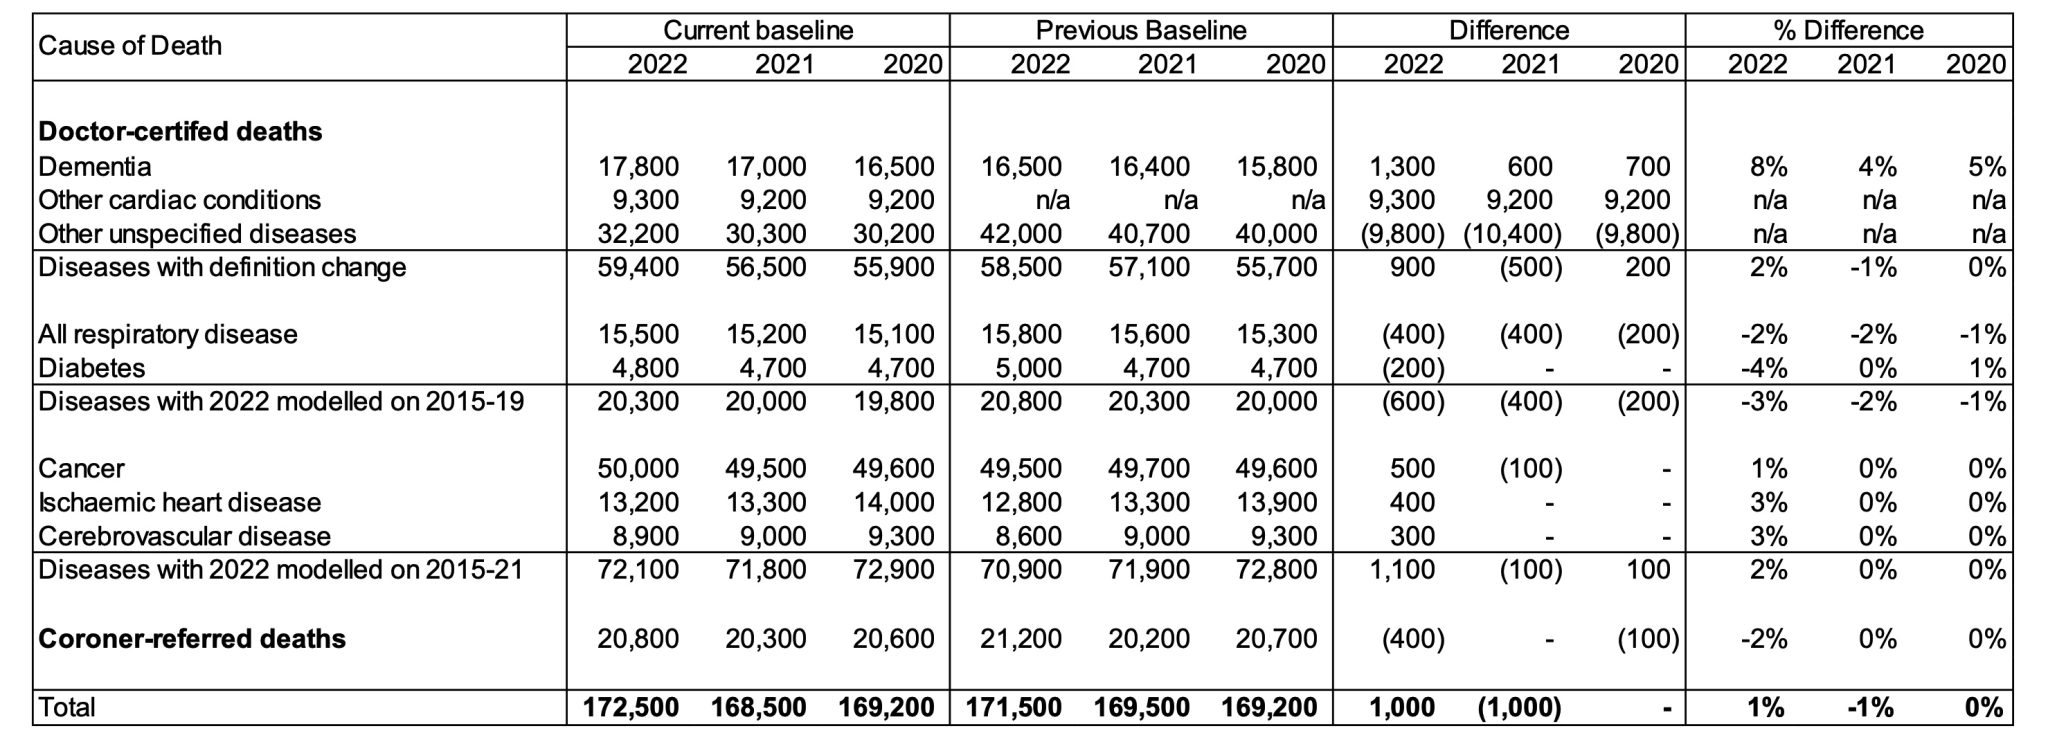
* Note that years shown are ISO years, so 2020 includes exactly 53 weeks while 2021 and 2022 include exactly 52 weeks
The revisions to our estimated baselines have resulted in:
- very little change in the baseline for 2020;
- a baseline that is 1,000 deaths lower for 2021. This is primarily the result of the ABS’s revision of the population estimates for 2021 (the estimate is now slightly lower, resulting in fewer predicted deaths when multiplying the population by the predicted SDR);
- a baseline that is 1,000 deaths higher for 2022. This is due to the following factors:
- the change to the dementia definition and separating out other cardiac conditions has resulted in a baseline that is around 900 deaths higher than previously i.e. more granular data has resulted in a better estimate
- a lower baseline for respiratory disease as the pneumonia SDRs provided by the ABS are now a little lower than previously across all years
- a lower baseline for diabetes given we have changed our approach to base this estimate on the 2015-19 years only (with the revised ABS data, the diabetes deaths in 2020 and 2021 are now significantly higher than predicted)
- higher baselines for cancer, ischaemic heart disease and cerebrovascular disease. Theses causes are trained on 2015-21 data, and with the revised population estimates for 2021 the actual SDRs for 2021 are now a little higher than previously, thus the predictions for 2022 are slightly higher
- a lower baseline for coroner referred deaths. While these deaths are also trained on 2015-21 (and are thus subject to the same change in estimation as above), at the time of setting our baselines last year we had only a small number of data points with which to estimate IBNR loadings for coroner referred deaths, impacting the 2021 “actual” SDRs. With the benefit of hindsight, these IBNR loadings were too high, hence the SDRs used in the modelling last year were too high, resulting in a projected number of coroner-referred deaths that was too high.
Further analysis
We have not estimated excess deaths by age group/gender or state/territory in this article, and we intend to only examine these breakdowns at the end of each quarter from now on. See our previous article for a detailed examination of these breakdowns to 31 December 2022.
Disclaimer
This monthly COVID-19 mortality analysis is intended for discussion purposes only and does not constitute consulting advice on which to base decisions. We are not medical professionals, public health specialists or epidemiologists.
To the extent permitted by law, all users of the monthly analysis hereby release and indemnify The Institute of Actuaries of Australia and associated parties from all present and future liabilities that may arise in connection with this monthly analysis, its publication or any communication, discussion or work relating to or derived from the contents of this monthly analysis.
COVID-19 Mortality Working Group
The members of the Working Group are:
- Angelo Andrew
- Karen Cutter
- Jennifer Lang
- Han Li
- Richard Lyon
- Zhan Wang
- Mengyi Xu
References
[1] Doctor-certified deaths from dementia have been expanded to include ICD codes G31.0 (Fronto-temporal dementia) and G31.8 (Lewy body dementia).
[2] ICD-10 codes I26-I51
CPD: Actuaries Institute Members can claim two CPD points for every hour of reading articles on Actuaries Digital.


