


COVID-19 Mortality Working Group: Confirmation of 20,000 excess deaths for 2022 in Australia
Catch up on the Actuaries Institute’s COVID-19 Mortality Working Group’s latest analysis of excess deaths.
In summary:
|
Overall summary of excess mortality in 2022
We estimate that there were just over 20,000 (12%) more deaths in Australia in 2022 than we would have expected if there had been no pandemic. Excess mortality is widely regarded as the best measure of the overall impact of a pandemic since it includes deaths both directly and indirectly due to the disease.
Of the 20,200 excess deaths in 2022, we estimate that:
- 10,300 deaths (51%) were from COVID-19;
- 2,900 deaths (15%) were COVID-19 related, meaning that COVID-19 contributed to the death; and
- 7,000 deaths (34%) had no mention of COVID-19 on the death certificate.
Figure 1 – Annual deaths In Australia
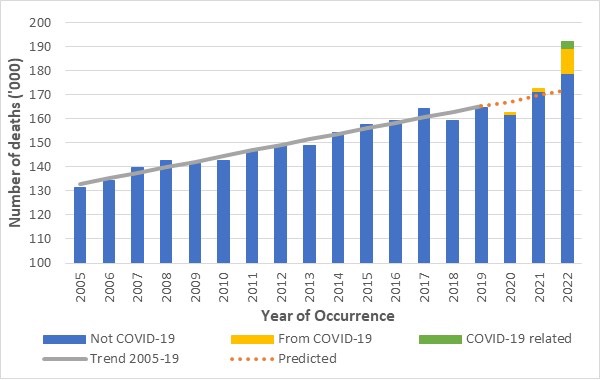
Deaths from COVID-19 are those where COVID-19 is given as the underlying cause of death on the death certificate. Deaths from COVID-19 were the third leading cause of death in Australia in 2022. The main reason why the numbers do not match those derived from surveillance reports is that the latter includes almost all cases[1] where people had COVID-19 when they died. Reported surveillance deaths will include deaths from COVID-19, deaths that were COVID-19 related and other deaths where the doctor/coroner has determined that COVID-19 was incidental and had no role in the death of the person.
For most of the underlying causes of death reported on by the Australian Bureau of Statistics (ABS), the share of COVID-19 related deaths in 2022 is similar to the share of all non-COVID-19 deaths. The exceptions to this are dementia (which is over-represented in COVID-19 related deaths as frail dementia sufferers are also particularly vulnerable to COVID-19), respiratory disease (under-represented as COVID-19 is more likely to determined to be the underlying cause rather than a contributing cause) and coroner-referred deaths (under-represented, but the position could change as coroner findings are made).
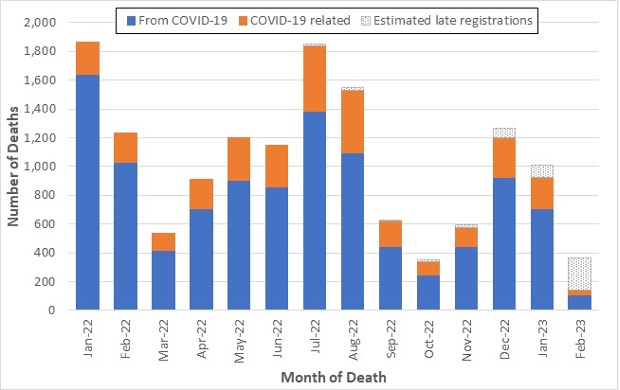
It is unclear how close we are to reaching an endemic state when the impact of COVID-19 on mortality will become (more) predictable. Figure 2 shows that the latest wave of COVID-19 deaths continued in January 2023 (estimated at just over 1,000 deaths) but had ended by February 2023 (similar to the lowest month of 2022 at around 350 deaths).
Figure 2 – COVID-19 deaths in 2022 and the first two months of 2023[2]
The death certificates of about one-third of excess deaths in 2022 had no mention of COVID-19. These non-COVID-19 deaths represent excess mortality of 4%, which is extraordinarily high in itself, as can be seen in Figure 1. Non-COVID-19 excess deaths are particularly apparent in those aged over 75 for both genders and those aged under 65 for females only. We consider that the most likely reasons for these excess deaths are:
- The impact of COVID-19 on subsequent mortality risk, particularly heart disease, stroke, diabetes and dementia, which have all been identified in studies;
- Delays in emergency care, particularly at times of high prevalence of COVID-19 and/or influenza; and
- Delays in routine care, which refers to missed opportunities to diagnose or treat non-COVID-19 diseases and the likelihood of consequent higher mortality from those conditions in future. We understand that disrupted prescription of medications may be particularly likely to be a major risk factor for those with chronic heart disease.
Other possible reasons, which (in our opinion) have had less impact in 2022, include:
- Mortality displacement, which refers to the proposition that many lives that were saved by the reduced spread of respiratory disease in 2020 and 2021 represent vulnerable people who would soon die of their underlying conditions;
- Undiagnosed COVID-19, which clearly happened early in the pandemic, but seems far less likely in 2022, given awareness and testing protocols;
- Mental health issues, widely understood to have arisen from stress associated with the pandemic, but not (or not yet) showing up in suicide mortality data; and
- Unhealthy pandemic-influenced lifestyle changes, which have been documented overseas, but which would likely not have materially affected Australian mortality in 2022.
In this context, we note that vaccination is highly unlikely to be a cause of excess mortality in 2022. Indeed, given the well-documented reduction in COVID-19 mortality risk conferred by vaccination, the 14 vaccine-caused deaths that had occurred by March 2023 are a fraction of the lives saved by vaccination.
Background
The COVID-19 Mortality Working Group has examined the latest Provisional Mortality Statistics, covering deaths occurring prior to 31 December 2022 and registered by 28 February 2023, released by the Australian Bureau of Statistics (ABS) on 31 March. This release also included the article COVID-19 Mortality in Australia, with details on all COVID-19 deaths occurring and registered by 28 February 2023.
Throughout this article, we separate COVID-19 deaths into:
- Deaths “from COVID-19”, namely deaths where COVID-19 is listed as the primary/underlying cause of death;
- Deaths that were “COVID-19 related”, namely deaths where the underlying cause of death has been determined as something other than COVID-19, but COVID-19 was a contributing factor mentioned on the death certificate. (Note that we previously referred to these deaths as “with COVID-19” but have changed our terminology to avoid confusion.); and
- “Incidental COVID-19” deaths, namely deaths where the person was COVID-19 positive at the time of death, but COVID-19 was not recorded on the death certificate. These deaths are included in surveillance reporting (other than where there is a clear alternative cause of death, such as trauma) but are not separately identified in the ABS statistics.
We calculate excess deaths by comparing observed deaths to our “baseline” predicted number of deaths for doctor-certified deaths (by cause) and coroner-referred deaths (for all causes combined).
The Working Group has also examined excess mortality by age/gender and by state/territory. In so doing, we have used additional data supplied by the ABS in a customised report in relation to COVID-19 deaths registered by 28 February 2023, namely:
- The number of deaths each week both from COVID-19 and COVID-19 related, broken down by age/gender; and
- The number of deaths each week both from COVID-19 and COVID-19 related for each of NSW, Victoria and Queensland, plus deaths from COVID-19 for WA and SA. Due to small numbers, the ABS is unable to supply weekly COVID-19 deaths for the smaller states and territories, however we were supplied with annual totals for these states and territories.
We also assess where COVID-19 sits in terms of leading causes of death in Australia.
Baseline Predictions
Our previous Actuaries Digital article discussed in some detail how we arrived at our baseline predicted deaths. In short:
- Our baselines by cause of death are set by extrapolating linear regression models fitted to Standardised Death Rates (SDRs), which are then re-expressed as numbers of deaths.
- For our baselines by age/gender and by state and territory, we have used a slightly different, and more approximate, approach because SDRs are not available.
- Given the slight difference of approach, we end up with small differences in the total predicted numbers of deaths from our cause, age and gender and state and territory models, with increasing deviation as the projection period extends.
- Our models by cause of death remain the base for our “best estimate” of total excess mortality, as we believe that they best reflect the underlying mortality trends in Australia.
The baselines for our estimates of excess deaths remain “in the absence of the pandemic” for each of the three years 2020 to 2022. We have not included any COVID-19 deaths in the baseline, as these would not exist in the absence of the pandemic.
As always, it is important to note that predicted death numbers are increasing faster from demographic changes (ageing and population size) than they are reducing due to mortality improvement. Therefore, our model predicts higher baseline numbers of deaths in each successive year.
Comparison with ABS reporting
The results we present here differ from those quoted by the ABS in its commentary surrounding the release of the Provisional Mortality Statistics. The ABS explicitly states that the comparison presented is not an official estimate of excess mortality and that their baseline for 2022 (being the simple average of the number of deaths from 2017, 2018, 2019 and 2021, with no allowance for mortality trends or demographic changes) merely serves as a proxy for the expected number of deaths.
For example, the latest Provisional Mortality Statistics says: “In 2022, there were 190,394 deaths that occurred by 31 December and were registered by 28 February 2023, which is 25,235 (15.3%) more than the historical average.”
By comparison, we estimate that there were 20,200 (12%) excess deaths in this period. The main reason for the difference between the ABS figure of 25,235 and our estimate of excess deaths of 20,200 is the difference in the baselines used.
Excess deaths to 31 December 2022
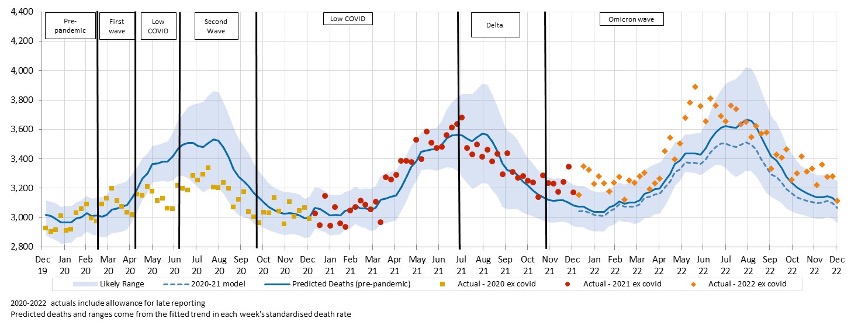
Figure 3 shows the results of our analysis, comparing actual deaths each week to our predicted values and the 95% prediction interval.
Figure 3 – Weekly actual and predicted deaths – All Causes
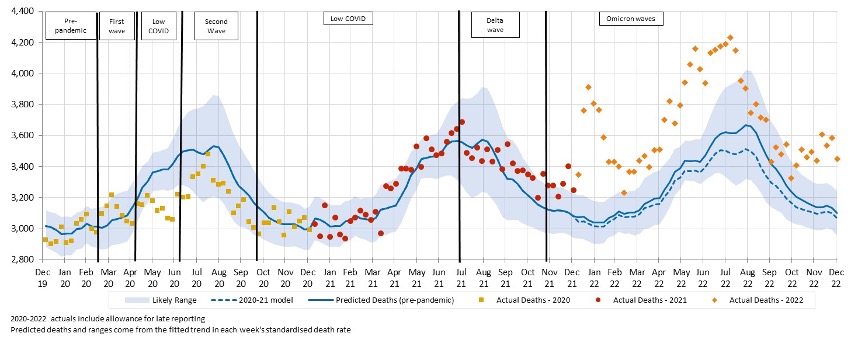
In December, all weeks were well above the upper end of the prediction 95% prediction interval, as has been the case for the majority of 2022. The only period where deaths were not outside the prediction interval was from around mid-August to end-October when COVID-19 prevalence in Australia was relatively low.
Figure 4 shows deaths from COVID-19 and COVID-19 related deaths, noting that, given small numbers, weekly data for COVID-19 related deaths is only available for 2022.
Figure 4 – Weekly actual and predicted deaths – from COVID-19 and COVID-19 related*
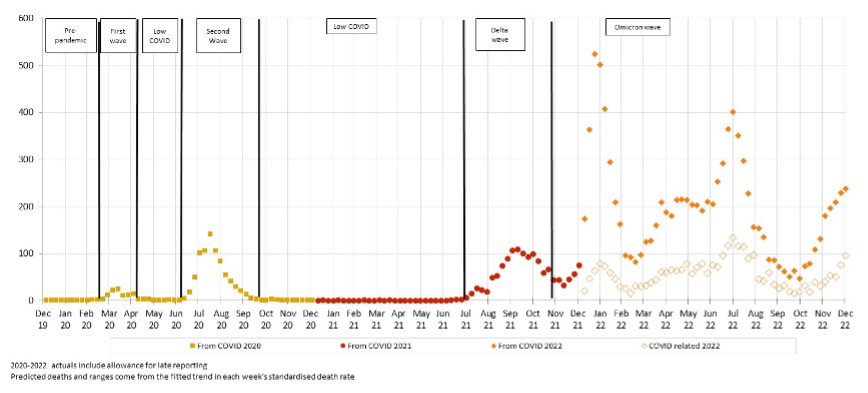
* COVID-19 data from ABS customised report 2023
Deaths from COVID-19 increased across November and December, averaging over 200 deaths per week in December. COVID-19 related deaths have followed the same pattern as from COVID-19 deaths.
It is unclear how many people whose deaths were COVID-19 related would have died during this period anyway and how many may have had their death hastened by COVID-19. Given that COVID-19 is considered to have contributed to the death and that these deaths follow the same peaks and troughs as from COVID-19 deaths, it seems that COVID-19 is a catalyst in these deaths rather than being merely coincidental. We note that the same traditionally happens with the winter peak of respiratory disease deaths.
There may be instances where it is difficult to determine whether a death is due to COVID-19 versus COVID-19 being a contributing cause, and an element of professional judgment by the certifier will necessarily need to be exercised. It is unclear to us how often such decisions may need to be made, and how much “blurring” there may be between deaths from COVID-19 and COVID-19 related deaths.
Figure 5 shows the comparison of actual deaths to predicted after removing deaths from COVID-19 and COVID-19 related deaths.
Figure 5 – Weekly actual and predicted deaths – All Causes excluding deaths from COVID-19 and COVID-19 related deaths
Even after removing all deaths from COVID-91 and those that were COVID-19 related, significant excess mortality remains for 2022, with:
- A spike around the time of the January peak in COVID-19 deaths;
- Another spike coinciding with the peak of the flu season (which this year came just before another peak of COVID-19 deaths) in late June; and
- Another smaller spike in November/December when COVID-19 deaths were again high.
The next section discusses the causes of death driving this trend.
Excess deaths to 31 December 2022 by Cause of Death
Table 1 shows our estimate of excess deaths broken down by cause.
As in our previous work, we have assumed that coroner-referred COVID-19 deaths will be 5% of all COVID-19 deaths in 2022, based on the experience of late 2021 and the emerging experience in 2022. If our estimate of coroner-referred COVID-19 deaths is too high (or low), this will not affect the total level of excess deaths measured; it will just mean that our estimate of non-COVID-19 coroner-referred deaths will be too low (or high) by the same amount.
Table 1 – Excess deaths in Australia – By Cause of Death
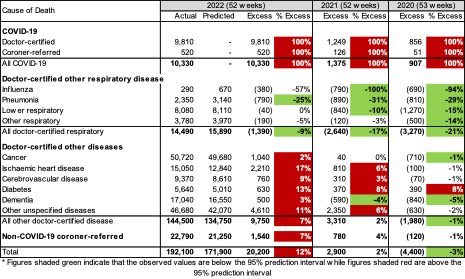
In 2022:
- Total deaths were 12% (or +20,200) higher than predicted, compared with excess deaths of -4,400 for 2020 and +2,900 for 2021;
- There were 10,330 deaths from COVID-19, representing 51% of the excess deaths and including 172 deaths reported as due to Long COVID;
- While not shown in the table, 2,939 COVID-19 related deaths are included among the other causes of death, representing a further 15% of the excess deaths and meaning that 34% of excess deaths (c. 7,000) have no mention of COVID-19 on the death certificate;
- Despite influenza circulating in Australia again in 2022, doctor-certified deaths from respiratory disease were again lower than expected (9% lower), although not as low as we saw earlier in the pandemic;
- While doctor-certified deaths from cancer and dementia are close to expected in percentage terms (2% and 3% higher respectively), these differences are statistically significant;
- Doctor-certified deaths from heart disease, cerebrovascular disease and diabetes were all significantly higher than predicted (by between 9% and 17%);
- Doctor-certified deaths from other unspecified diseases were also significantly higher than predicted (by 11%), continuing a trend observed since April 2021. Note that this is a large “catch-all” category, and it is difficult to infer the reason for this large increase, although history suggests that non-ischaemic heart diseases probably make up more than 25% of deaths from these unspecified causes; and
- Non-COVID-19 coroner-referred deaths were 7% higher than expected.
Figure 6 and Figure 7 show weekly excess deaths by underlying cause (thus including COVID-19 related deaths) since the start of the pandemic, compared with the 95% prediction interval. All graphs are shown using the same y-axis to give a sense of the contribution of each cause. The 9-week centred average is also shown to highlight any trends.
Figure 6 – Weekly excess deaths in 2020-22 for cancer, heart, stroke, and diabetes
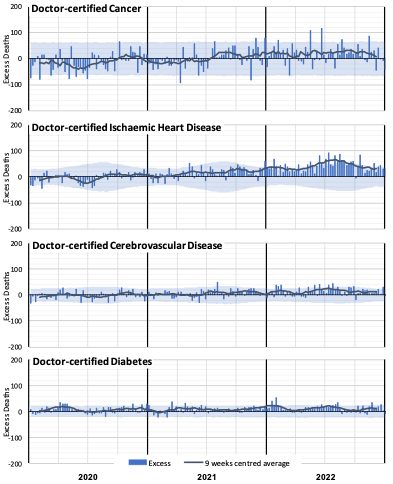
Figure 6 shows a clear increase in excess deaths due to ischaemic heart disease from around March 2021 until around August 2022, with the peaks and troughs following the same timing as deaths from COVID-19 (noting that each chart includes COVID-19 related deaths from that cause). There has been a consistent, albeit volatile, excess for deaths from both cancer and cerebrovascular disease since around July 2021. Diabetes deaths have generally been higher than expected throughout the pandemic, and again the peaks and troughs have followed the same patterns as deaths from COVID-19.
Of these four causes, ischaemic heart disease is the biggest contributor to excess deaths in 2022, followed by cancer.
Figure 7 – Weekly excess deaths in 2020-22 for other causes
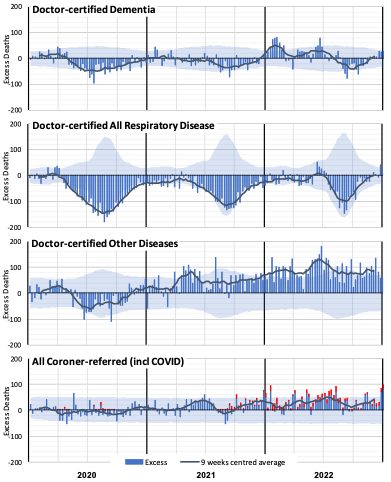
Figure 7 shows negative excess deaths for dementia in 2020, 2021 and September/October 2022 (closely correlated with lower respiratory disease), with higher excess deaths in the first half of 2022 (closely correlated with COVID-19 and flu waves).
Deaths from respiratory disease have been significantly lower than expected throughout the pandemic, except for the short (and early) flu season, which peaked in late June 2022. This coincides with the second 2022 peak in excess non-COVID-19 deaths that we saw in Figure 5.
Deaths from other diseases (where available ABS data does not specify the cause) were also lower than predicted in 2020 (correlated with lower respiratory disease) but have been, as a group, the largest contributor to non-COVID-19 excess deaths in 2021 and 2022. It is not clear what might be driving this, although we expect that at least part of the excess will be in respect of people who otherwise may have succumbed to respiratory disease in 2020 and 2021. We also note that deaths from heart conditions other than ischaemic heart disease traditionally comprise more than 25% of this group and that there does appear to be an increased risk of heart disease after recovering from COVID-19.
Coroner-referred deaths include deaths from COVID-19 that have been referred. In Figure 7, we have separately shown these (in red), using actual coroner-referred COVID-19 deaths for 2020 and 2021 and estimates for 2022 based on our assumption that 5% of all COVID-19 deaths are referred to the coroner. The residual non-COVID-19 coroner-referred deaths are well above expected levels in the second half of 2021 and throughout 2022. We note, however, that suicide monitoring reports for NSW and Victoria show a slight increase in 2022, but not large enough to account for the level of excess seen in those states. Similarly, Australia-wide road death statistics show a small increase in 2022, but not large enough to account for the overall increase.
COVID-19 related deaths
This section examines COVID-19 related deaths being those where COVID-19 was a contributing factor to the death, but where another cause is listed as the underlying cause of death.
Figure 8 shows, for each of the underlying causes of death reported on by the ABS, the share of COVID-19 related deaths compared with the share of actual deaths (excluding from COVID-19 and COVID-19 related deaths) for 2022.
Figure 8 – Share of deaths by Cause – COVID-19 related versus actual non-COVID-19 deaths for 2022
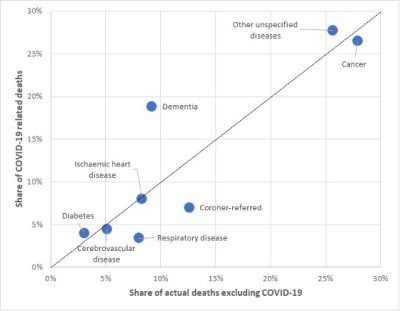
Figure 8 shows that, for most causes of death, the share of COVID-19 related deaths in 2022 is similar to the share of non-COVID-19 actual deaths (most points are close to the diagonal dotted line). However, we can see that:
- Dementia deaths are over-represented in COVID-19 related deaths, accounting for 19% of COVID-19 related deaths but only 9% of non-COVID-19 deaths. Frail dementia sufferers are particularly vulnerable during COVID-19 waves;
- Deaths from respiratory disease are under-represented in COVID-19 related deaths, making up 3% of COVID-19 related deaths but 8% of non-COVID-19 deaths. Perhaps this indicates a tendency to designate COVID-19 as the underlying cause of death of a person who was suffering from both a respiratory disease and COVID-19; and
- Coroner-referred deaths are also under-represented in COVID-19 related deaths. The share of coroner-referred COVID-19 related deaths could increase over the next year as coroner findings are made.
Note that, in Figure 8, deaths from specified diseases are those certified by doctors. Deaths from disease that have been referred to the coroner are included in coroner-referred deaths.
Excess deaths to 31 December by Age/Gender
Table 2 below shows our estimate of excess deaths by age band and gender. We have shown the excess, including all deaths, and then again after deducting from COVID-19 and COVID-19 related deaths.
Table 2 – Excess deaths in Australia – By Age/Gender*
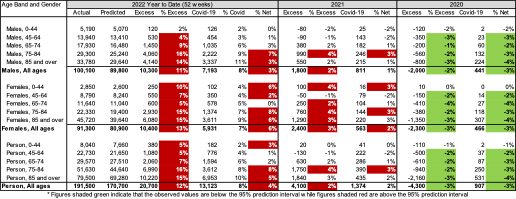
* COVID-19 data from ABS customised report 2023
Almost all age bands show excess deaths in 2022 (which is not all that surprising given the excess deaths for the whole population), but the number and percentage of excess deaths is higher in older age bands. The risk of mortality from COVID-19 is steeper than the underlying age mortality curve, so this result is somewhat expected.
However, it is notable that there are excess deaths in all age groups and that this excess is generally significant, even after removing COVID-19 deaths. To look at this further, we have shown these results similarly to the graphs by cause, showing weekly excess deaths by age band since the start of the pandemic. For these charts, we have been able to show the contribution of deaths from COVID-19 and COVID-19 related deaths (in orange) separately to non-COVID-19 deaths. The 95% prediction interval is also shown. All age bands are shown using the same y-axis to give a sense of contribution of each age band.
Figure 9 – Weekly excess deaths in 2020-22 by age band (all persons)*
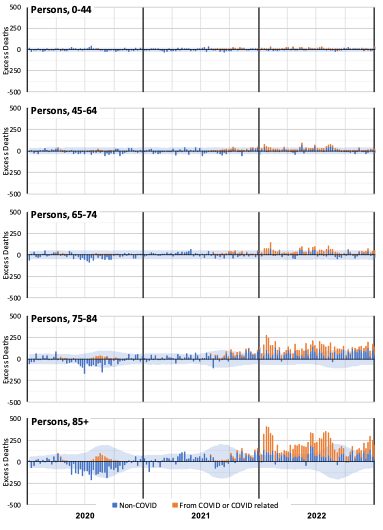
* COVID-19 data from ABS customised report 2023
Figure 9 shows that excess deaths in 2022 are dominated by the older age groups. However, we already expect many more deaths in these age groups. It is instructive to consider the same information with the excess deaths expressed as a percentage of predicted deaths.
Figure 10 – Weekly excess deaths as a % of predicted in 2020-22 by age band (all persons)*
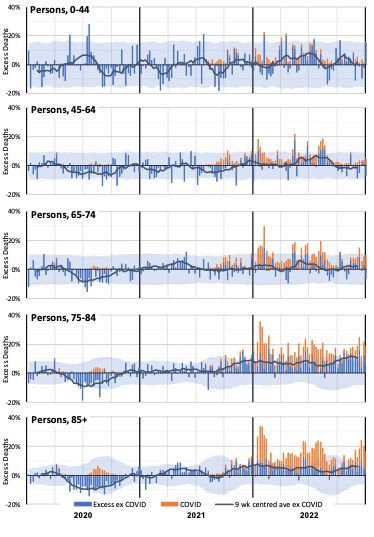
* COVID-19 data from ABS customised report 2023
Figure 10 shows that the older age groups still experienced the most significant increase in excess deaths when expressed as a percentage of predicted deaths. Indeed, deaths of people over the age of 75 are significantly higher than expected in almost every week of 2022.
While the numbers of deaths in the 0-44 and 45-64 age bands are small, we saw in Table 2 that year-to-date excess deaths in 2022 are materially higher than expected. That table also showed that the percentage excess was higher for females than for males.
The differences are worth investigating although the small numbers mean that there is considerable natural variation.
Figure 11 – Weekly excess deaths as a % of predicted in 2020-22 for ages 0-44 and 45-64 by gender*
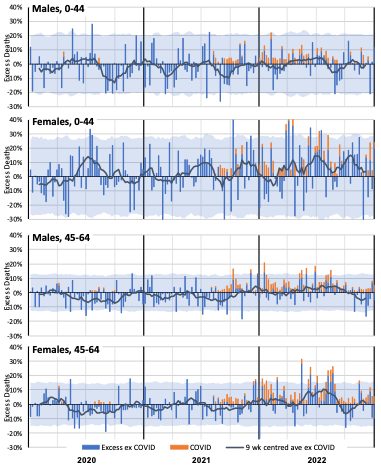
* COVID-19 data from ABS customised report 2023
Figure 11 shows that female non-COVID-19 mortality experience in 2021 and 2022 is noticeably worse than male, especially in the 0-44 age band.
Excess deaths to 31 December 2022 by State/Territory
Table 3 shows our estimate of excess deaths by state/territory, before and after deducting from COVID-19 and COVID-19 related deaths.
Table 3 – Excess deaths in Australia – By State/Territory*
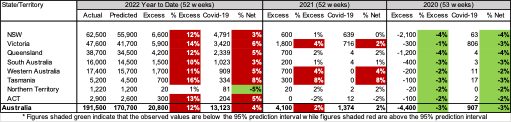
In 2022, all states/territories apart from NT had significant levels of excess mortality ranging from 10% to 16% of predicted. Generally, about half of this is due to deaths from COVID-19, with another 1-2% due to COVID-19 related deaths.
The graphs below show these results week-by-week (with the excess shown as a percentage of the predicted value) for:
- The three largest states (NSW, Victoria and Queensland) where we have weekly information on both deaths from COVID-19 deaths and COVID-19 related deaths;
- SA and WA, where we have weekly information on deaths from COVID-19 only; and
- The smaller states/territories (Tasmania, NT and ACT) where weekly information on COVID-19 deaths is not available.
Figure 12 – Weekly excess deaths as a % of predicted in 2020-22 for NSW, Victoria, Queensland*
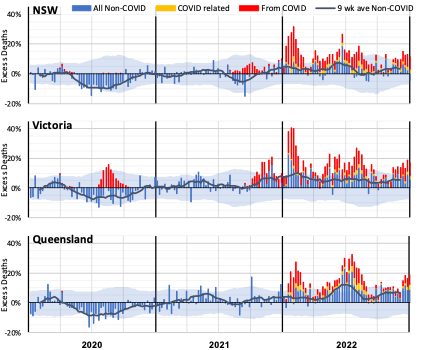
* COVID-19 data from ABS customised report 2023
Figure 12 shows that these larger states all had better-than-expected mortality in 2020. It also shows the impact of the second COVID-19 wave in Victoria.
In 2021, Victoria shows a much higher level of excess deaths in the Delta wave – in the last quarter of the year – than either NSW or Queensland. A large portion of these deaths does not have COVID-19 on the death certificate.
In 2022:
- Queensland had a large peak in non-COVID excess deaths in the middle of the year (at the time of flu and COVID-19 waves). NSW had a smaller peak at this time, but Victoria did not have a similar peak; and
- Barring the winter peaks for NSW and Queensland, Victoria’s non-COVID-19 excess has tended to be higher than the other two large states.
Figure 13 – Weekly excess deaths as a % of predicted in 2020-22 for WA and SA*
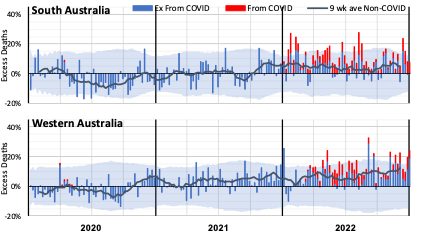
* COVID-19 data from ABS customised report 2023
The SA experience is similar to the three largest states, although somewhat more volatile given its smaller size.
Western Australia, while mostly having excess deaths within the 95% prediction interval, had many more weeks with positive excess deaths than with negative excess deaths. There is no large COVID-19 spike in January and February, thanks to the later opening of WA’s borders.
Figure 14 – Weekly excess deaths as a % of predicted in 2020-22 for Tasmania, ACT and NT
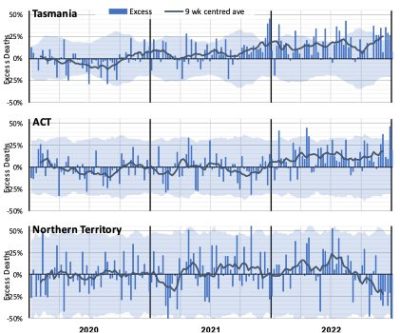
Figure 14 shows the higher volatility of excess mortality experienced by the smallest state and the two territories. Allowing for that volatility, Tasmania had broadly the same experience of excess mortality as the larger states but with a high level of excess deaths during the Delta wave late in 2021.
With its relatively young and affluent population, the ACT has experienced lower excess mortality than the larger states.
The Northern Territory has a very young population, which might explain the low net impact of the pandemic after allowing for the high volatility caused by a very small weekly expected death count. There is no apparent general trend in the excess mortality, although it does appear to have been declining since the middle of 2022. (Note that we have used the same loadings for late-registered deaths for each state. It is likely that registration delays might be longer in the NT compared with larger, more populous states. As such, the reducing trend in excess mortality in the most recent 1-2 months may be a function of our simplified modelling approach rather than a real feature.)
What could be causing the non-COVID-19 excess deaths?
The measurement of higher numbers of deaths than predicted does not tell us why this is occurring. There are several reasons hypothesised around the world (where this effect is occurring to a greater or lesser extent). It isn’t possible to identify from death counts alone what is causing the non-COVID-19 excess deaths, but we have listed below the most likely explanations. We note that multiple factors are likely in play, and different factors may be more or less pronounced at various times.
To summarise the evidence from earlier sections:
- COVID-19 related deaths followed the same pattern as deaths from COVID-19 in 2022;
- Non-COVID-19 excess deaths have been highest when there have been peaks in COVID-19 deaths and peaks in influenza deaths;
- Deaths due to some causes (dementia and “other” diseases in particular) are closely correlated to the level of respiratory disease (including COVID-19) circulating;
- Non-COVID-19 excess deaths are particularly apparent in the oldest two age groups for both genders and the youngest two age groups for females only;
- Non-COVID-19 excess deaths are less apparent when there is no or little COVID-19 circulating, as illustrated by the difference between WA and the other states in early 2022.
Based on these observations, the following indicates which factors, in our view, are likely to be having a greater or lesser impact on Australian excess mortality in 2022.
- Post-COVID-19 sequelae or interactions with other causes of death: Studies have shown that COVID-19 is associated with higher subsequent mortality risk from heart disease and other causes, but certifying doctors would generally not identify a causative link several months after recovery from COVID-19. Therefore it seems likely that there would be more of these deaths than identified. The age-based analysis supports this hypothesis, with non-COVID-19 excess deaths occurring in 2022, even in those under 45, noting that this age group has had low levels of COVID-19 deaths. The absence of excess deaths in WA in January also supports this explanation. Likely impact in Australia: High
- Delay in emergency care: Pressure on the health, hospital and aged care systems, including ambulance ramping and bed block, could lead to people not getting the care they require, either as they avoid seeking help or their care is not as timely as it might have been in pre-pandemic times. The peaks in non-COVID-19 excess deaths at times of high COVID-19 and/or influenza deaths supports this hypothesis.
Likely impact in Australia: High during COVID-19 and influenza peaks
- Mortality displacement: Australia had negative mortality displacement (i.e. fewer deaths than expected) in the first year or so of the pandemic, resulting from the absence of many respiratory diseases. The lower-than-expected mortality from respiratory disease was again apparent in 2021. As such, some of the excess we have seen in some causes in 2021 and 2022 may be the reversing of this effect. People who otherwise may have died earlier had their systems been stressed by respiratory disease may now be succumbing to their underlying illnesses. Conversely, the earlier-than-usual flu season in 2022 appears to have resulted in some forward mortality displacement. Likely impact in Australia: Moderate, likely to reduce over time
- Delay in routine care: Opportunities to diagnose or treat non-COVID-19 diseases have been missed for various reasons including fear and lack of opportunity. There is some evidence that this may be affecting cancer deaths, and that disruptions to prescribing heart medications may be impacting on chronic ischaemic heart disease deaths. It may also be a factor in higher deaths from other causes, such as diabetes, and the large “other” category.
Likely impact in Australia: Low to Moderate, likely to increase over time
- Undiagnosed COVID-19: Some of the excess deaths could be from unidentified COVID-19. This effect happened early in the pandemic, but it seems less likely in 2022, as testing is much more available, particularly for those who are seriously ill (although for mild illness, testing is clearly reduced). While for any deaths where COVID-19 may be suspected, post-mortem testing is occurring in Australia, it is possible that some deaths caused by COVID-19 with unusual symptoms (e.g. some sudden cardiovascular deaths) may not be identified as caused by COVID-19. The timing of the higher levels of non-COVID-19 excess deaths (once COVID-19 related deaths are also removed) coinciding with high levels of COVID-19 deaths suggests that there may be some undiagnosed COVID-19 deaths.
Likely impact in Australia: Low, perhaps higher during COVID-19 peaks
- Mental health issues: There has been much discussion throughout the pandemic about the impacts on mental health, including commentary that lockdowns and other measures are causing an increase in suicide deaths. Data from the latest ABS Causes of Death, Australia publication shows that age-standardised suicides rates for both males and females were lower in 2020 and 2021 compared with the preceding three years, noting that the 2020 and 2021 data is preliminary. The publication also shows that 3.2% of suicide deaths in 2020 (0.06% of all deaths) and 2.6% in 2021 (0.05% of all deaths) had the pandemic mentioned as a risk factor. Even where the pandemic was a risk factor, there were, on average, five other risk factors. The suicide monitoring reports for NSW and Victoria show the same picture for 2020 and 2021, with 2022 slightly higher in NSW and Victoria, but a very small proportion of all deaths. (Lifeline: 13 11 14)
Likely impact in Australia: Low
- Pandemic-influenced lifestyle changes: There is evidence from the UK that a higher proportion of people made less healthy lifestyle choices during lockdowns (e.g. drinking more alcohol, exercising less, higher rates of childhood obesity), and that these less healthy practices have continued. It is unclear to what extent similar factors may be affecting mortality in Australia in 2022. Deaths directly caused by drug and/or alcohol abuse are relatively low compared with those from other causes, but there would be an indirect impact. Likely impact in Australia: Low
- Vaccine-related deaths: While there have been deaths in Australia caused by the administration of COVID-19 vaccines, the number of such deaths has been small. Australia has a very good vaccine approval and safety monitoring processes administered by the Therapeutic Goods Administration. The latest vaccine safety report (to 23 March) shows that, of the 982 reports of death following vaccination, only 14 were found to have been caused by the administration of the vaccine. This is consistent with the TGA’s finding that the “vast majority” of these reported deaths were not caused by COVID-19 vaccination. That must mean that they were due to other, unrelated causes. In addition, the vaccine rollout ramped up slowly from February 2021, with high rates of vaccination in August to October 2021 and again in January 2022, but has been low for most of 2022. This does not fit with the timing or shape of the excess mortality. Likely impact in Australia: Negligible.
Figure 15, which shows excess deaths from doctor-certified respiratory disease, other non-COVID causes and those from COVID-19 and that were COVID-19 related, puts the above into context, across the pandemic.
Figure 15 – Possible causes of non-COVID-19 excess mortality from time to time during the pandemic*
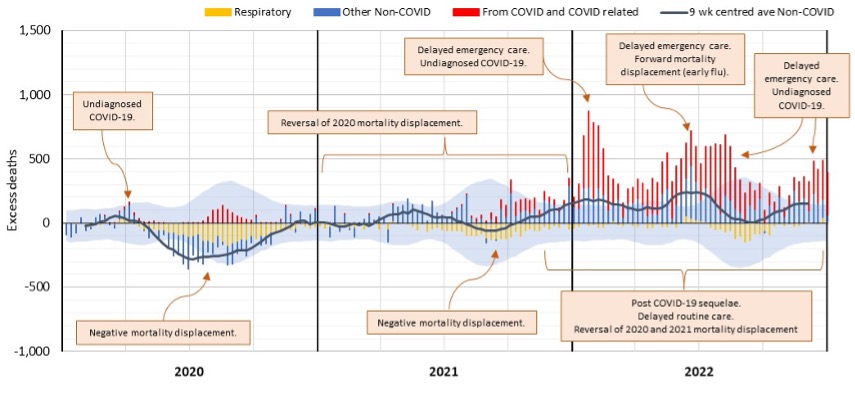
* COVID-19 data from ABS customised report 2023
Leading causes of death
The ABS reports on the top 20 leading causes of death by grouping deaths based on their International Classification of Diseases, version 10 (ICD-10) code. Cancers are grouped based on the region of the body rather than included as a whole. In this section, we assess where COVID-19 sits in terms of leading causes of death in Australia and have followed the ABS classification system.
We have estimated deaths for the leading causes for 2022. To do this, we have:
- Taken doctor-certified deaths by cause to 31 December as shown in Table 1;
- Included an allowance for coroner-referred deaths (using the historical ratio of doctor-certified to coroner-referred deaths); and
- For the leading cancer causes, we have estimated deaths from all cancers and then assumed lung cancers and colon cancers make up 18% and 12% respectively of all cancer deaths. These proportions have been stable over the recent period examined.
Table 4 – Leading causes of death
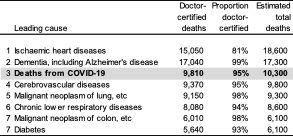
With around 10,300 deaths from COVID-19 in 2022, this puts COVID-19 as the third leading cause of death.
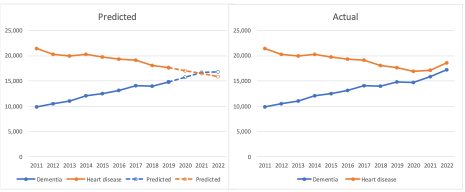
Ischaemic heart disease has been the leading cause of death in Australia for many years. However, the mortality rate for this cause has been declining. At the same time, the population has been aging, resulting in an increasing number of dementia deaths. Our baseline predictions saw dementia overtake ischaemic heart disease to be the leading cause of death in 2022 by a small margin (left panel in Figure 16). However, with the much higher than predicted number of deaths from ischaemic heart disease in 2022, it has remained the leading cause of death (right panel in Figure 16).
Figure 16 – Deaths from ischaemic heart disease and dementia
Standardised Mortality Rates
Figure 17 shows the cumulative standardised mortality rates (SDRs) for 2015 to 2022, expressed relative to the rate for 2019. The SDRs are from the Provisional Mortality Statistics, plus an allowance for late-reported deaths.
Figure 17 – Cumulative standardised mortality rate relative to 2019
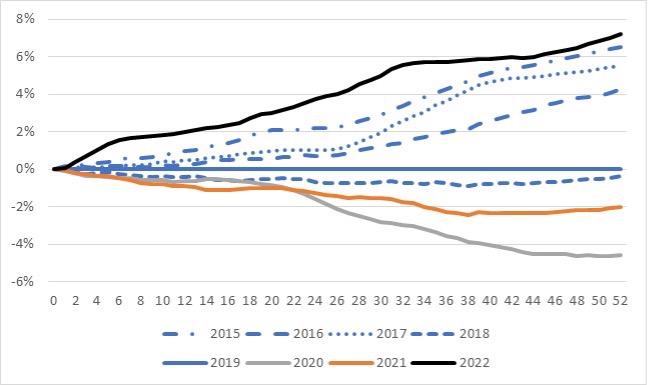
The graph shows that:
- Mortality rates improved over the 2015 to 2019 pre-pandemic years, noting that both 2017 and 2019 were “bad” influenza years, resulting in higher than usual deaths both from and related to influenza;
- The 2020 year is considerably lower than 2019, a result of the lower number of respiratory and respiratory-related deaths in that year due to measures introduced to curb COVID-19;
- 2021 is higher than 2020, a combination of both deaths from COVID-19 during the Delta wave and excess mortality from other causes of death (other than from respiratory disease); and
- For 2022, after being well above all other years shown until mid-August, experience from mid-August to end-October moved the 2022 year much closer to the 2015 year. At the end of the year, 2022 is almost 1% higher than the 2015 year and just over 7% higher than 2019 (noting that if pre-pandemic mortality trends had continued, we would expect 2022 to be around 5% below 2019).
Disclaimer
This monthly COVID-19 mortality analysis is intended for discussion purposes only and does not constitute consulting advice on which to base decisions. We are not medical professionals, public health specialists or epidemiologists.
To the extent permitted by law, all users of the monthly analysis hereby release and indemnify The Institute of Actuaries of Australia and associated parties from all present and future liabilities that may arise in connection with this monthly analysis, its publication or any communication, discussion or work relating to or derived from the contents of this monthly analysis.
COVID-19 Mortality Working Group
The members of the Working Group are:
- Angelo Andrew
- Karen Cutter
- Jennifer Lang
- Han Li
- Richard Lyon
- Zhan Wang
- Mengyi Xu
References
[1] Deaths are only excluded where COVID-19 is clearly not the cause, such as death by trauma.
[2] Note that this data comes from the latest ABS COVID-19 article, based on death certificates. While the ABS data is less timely than surveillance reports, deaths are allocated to the month of occurrence rather than the month of (sometimes quite late) reporting.
CPD: Actuaries Institute Members can claim two CPD points for every hour of reading articles on Actuaries Digital.


