


Why Buying a Home is Far Better than Renting
The opinions expressed within this article are solely the author’s and do not reflect the opinions and beliefs of the website or its affiliates. The information in this article is for general information only. It should not be taken as constituting financial advice.
The Government should do as much as possible to help younger people buy their own homes.
This could involve education, as well as policies to help save for a home deposit.
Current policies that force young workers to repay student debts and divert 12% of their salary to superannuation (from 1 July 2025) are almost cruel – especially when young people desperately need that money for a home deposit. In this article, we outline how owning a home can significantly improve a person’s retirement outcome – without extra contributions.
Some commentators argue that if we help young people to buy homes, then it will increase demand and may push property prices higher. This might be true, but seems intergenerationally selfish, given young people have to compete with others in the property market, including landlords and those living overseas.
The impact of demand from young people wanting to buy a home in which to live might be offset through other policies that influence supply and demand. Australia currently has one in ten dwellings simply left vacant, a high rate of immigration and a pipeline of substantial Government infrastructure programs that takes builders away from building homes. We might also question policies around the use of homes as short-term holiday accommodation that compete with hotels.
Exploring the long-term financial impact of buying a home versus renting, we highlight that the homeowner is far better off than the renter in nearly all stages of their life.
The main driver of this is the fact that homeowners benefit from the growth of an asset that’s up to 10 times larger than the deposit they invest. In the short-term, mortgage repayments can be more than rent would cost, but this subsequently reverses later in life – in a big way.
Rents continue to rise over time, but mortgage repayments don’t rise in the same way. Eventually mortgage repayments cease altogether when the loan is repaid – after perhaps 25 or more years from purchase.
Case study
Here is a projection for a 30-year-old couple who both earn $60,000 per year and have already managed to save $70,000 to buy a home.
They would like to buy the flat in which they are currently living, which is worth $560,000 and currently is costing them $430 per week in rent.
If they purchase the property:
A bank is willing to lend them $500,000[1]. They would pay a deposit of $60,000 which leaves them $10,000 for various other costs[2].
Repayments on the mortgage are $3,190 per month ($38,290 per year or around 40% of their combined after-tax incomes) based on a term of 30 years and interest rate of 6.5% per annum. There would also be ongoing property related costs such as rates and insurance – say $2,500 per year.
Over time, the amount owed to the bank reduces. After 15 years, the amount owing has fallen to $360,000. By this time, the property value is projected to have grown to $938,000. This is based on a 3.5% per year increase in the property value (net of any maintenance costs). Increases in home values are currently tax-free.
By the time they reach retirement at age 67 they own the property outright, worth just under $2 million.
If they continue renting:
If they keep renting, then they might consider investing their $70,000 of savings at the very start of the period for the long term e.g., in line with a balanced risk profile. We assume they contribute this $70,000 into tax-sheltered superannuation and earn 8% per year gross returns (less 1.2% for fees and super taxes). Under current rules, this amount in super would compound with net investment earnings to $187,800 in 15 years’ time and would reach $798,400 by the time they reach age 67.
If their rent increases by 3% per year, then it will rise from the current level of $22,400 per year to $34,900 per year in 15 years’ time. By the time they reach retirement at age 67, the cost of their rent would be $66,870 per year. Note that the annual level of rent at retirement comes to 8.4% of their projected extra super balance – and this rental cost continues to rise over the course of their retirement whereas the superannuation balance eventually reduces.
In the renting scenario, they obviously would not pay any mortgage payments (or the rates or property insurance). In year one, they would have $18,390 per year lower outgoings than the homeowner scenarios ($18,390 = $38,290 mortgage payments + $2,500 for costs – $22,400 rent). We assume they save this extra cashflow to enable a more appropriate ‘like for like’ comparison between renting and buying.
It’s important to note that the lower outgoings by renting not buying, will reverse in future years. The rental cost is assumed to increase over time whilst the mortgage repayments do not (assuming for simplicity that interest rates don’t change). After 22 years, the projected level of rent is higher than the mortgage repayments, rates and insurance combined.
Once the mortgage is repaid, the homeowner is significantly better off – for the rest of their lives. They must still pay rates and insurance, but they enjoy rent-free housing for life and have a tax-free, means-test exempt asset that they can use for things like equity release or funding age care needs or leaving as a bequest.
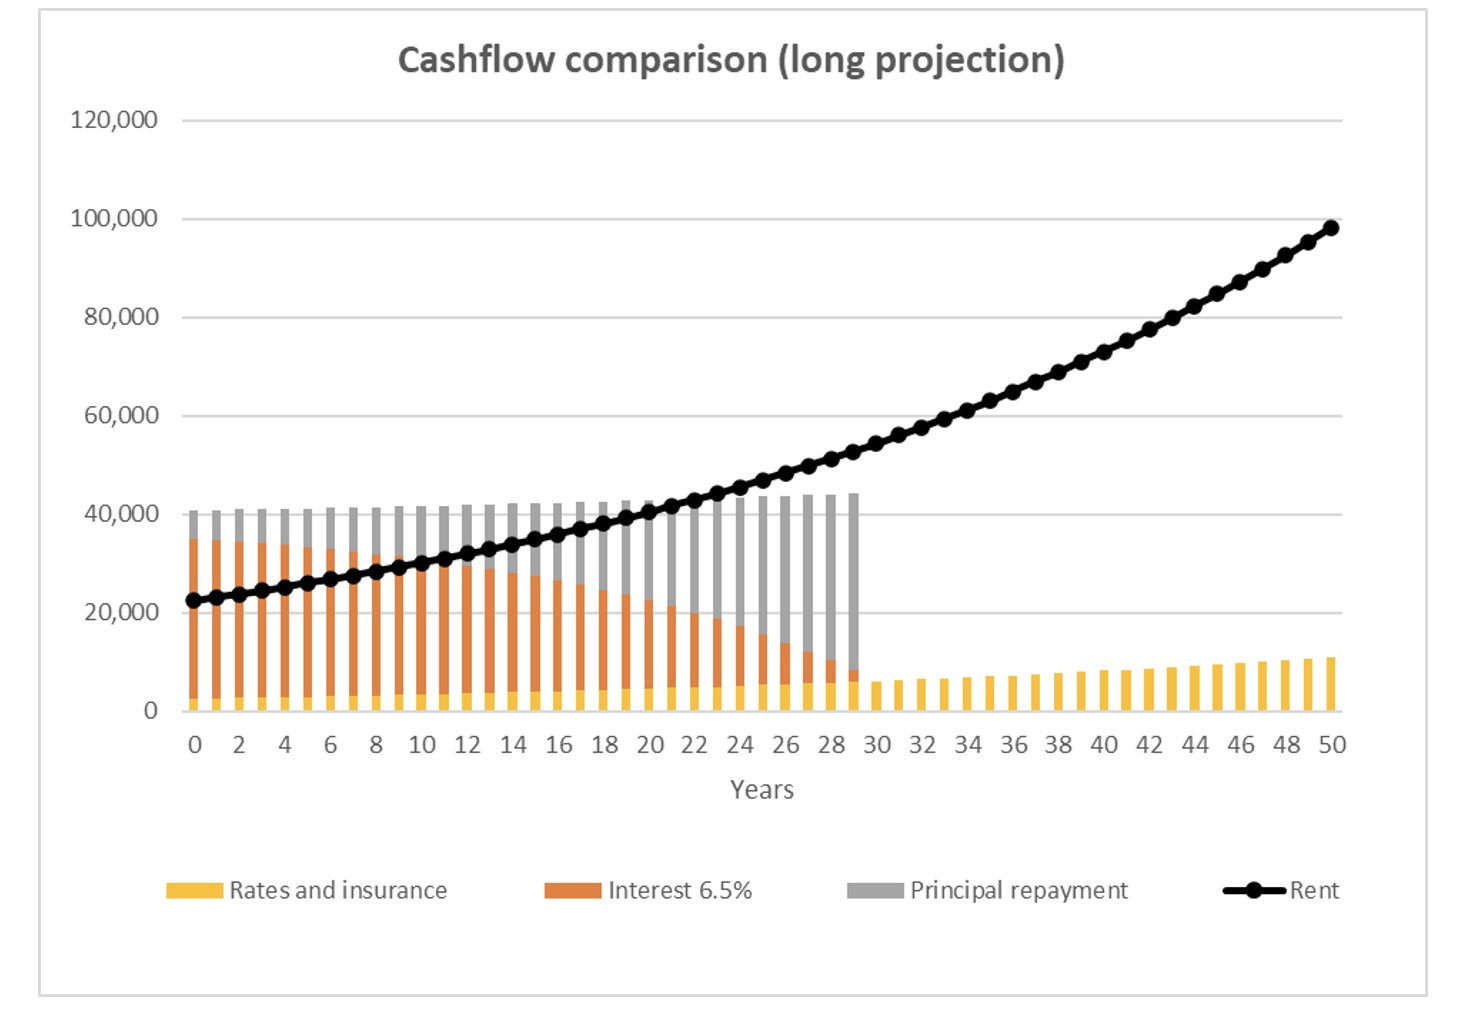
In the following chart, we show a cashflow comparison for the renter compared to homeowner. The black dotted line shows the amount of projected rent. The orange and grey lines show the mortgage repayments (broken down into interest and capital repayments respectively). The yellow lines show the costs of rates and property insurance (assumed to increase by 3% pa).
You can see initially that the outgoings from homeownership are higher than renting, but after 22 years, the projected rent exceeds the costs of property ownership. Once the mortgage is repaid, the costs of renting far exceeds the costs of living in a mortgage-free home.
Even in the early years, it’s key to note these ‘outgoings’ are only part of the picture. The asset value of the property and the superannuation savings are expected to increase in value over time too. If the property increases by 3.5% in the first year, then that’s a $19,600 capital gain (currently tax free).
The next chart below compares the asset values over 15 years. The blue lines are for the renter whereas the black and red lines are for the homeowner.
The thin blue line shows how much extra super balance a renter would have if they contributed their $70,000 of savings into superannuation as a non-concessional contribution and generated 6.8% per annum net returns (8% less 1.2% for fees and taxes). The thick blue line then adds the cumulative value of the extra savings made if they match the total outgoings of buying (in year 1 they’d save $18,390 which would mean their rent + savings is equal to the mortgage repayments plus rates and insurance). We assume these savings earn 3% per annum investment returns net of tax and expenses (in reality, this money might be more likely spent than saved but we include it to help provide a more like-for-like comparison).
The black line shows the projected value of the property for the homeowner. The dashed black line shows the projected amount of mortgage owing. The thick red line is the net equity they would have in the property.
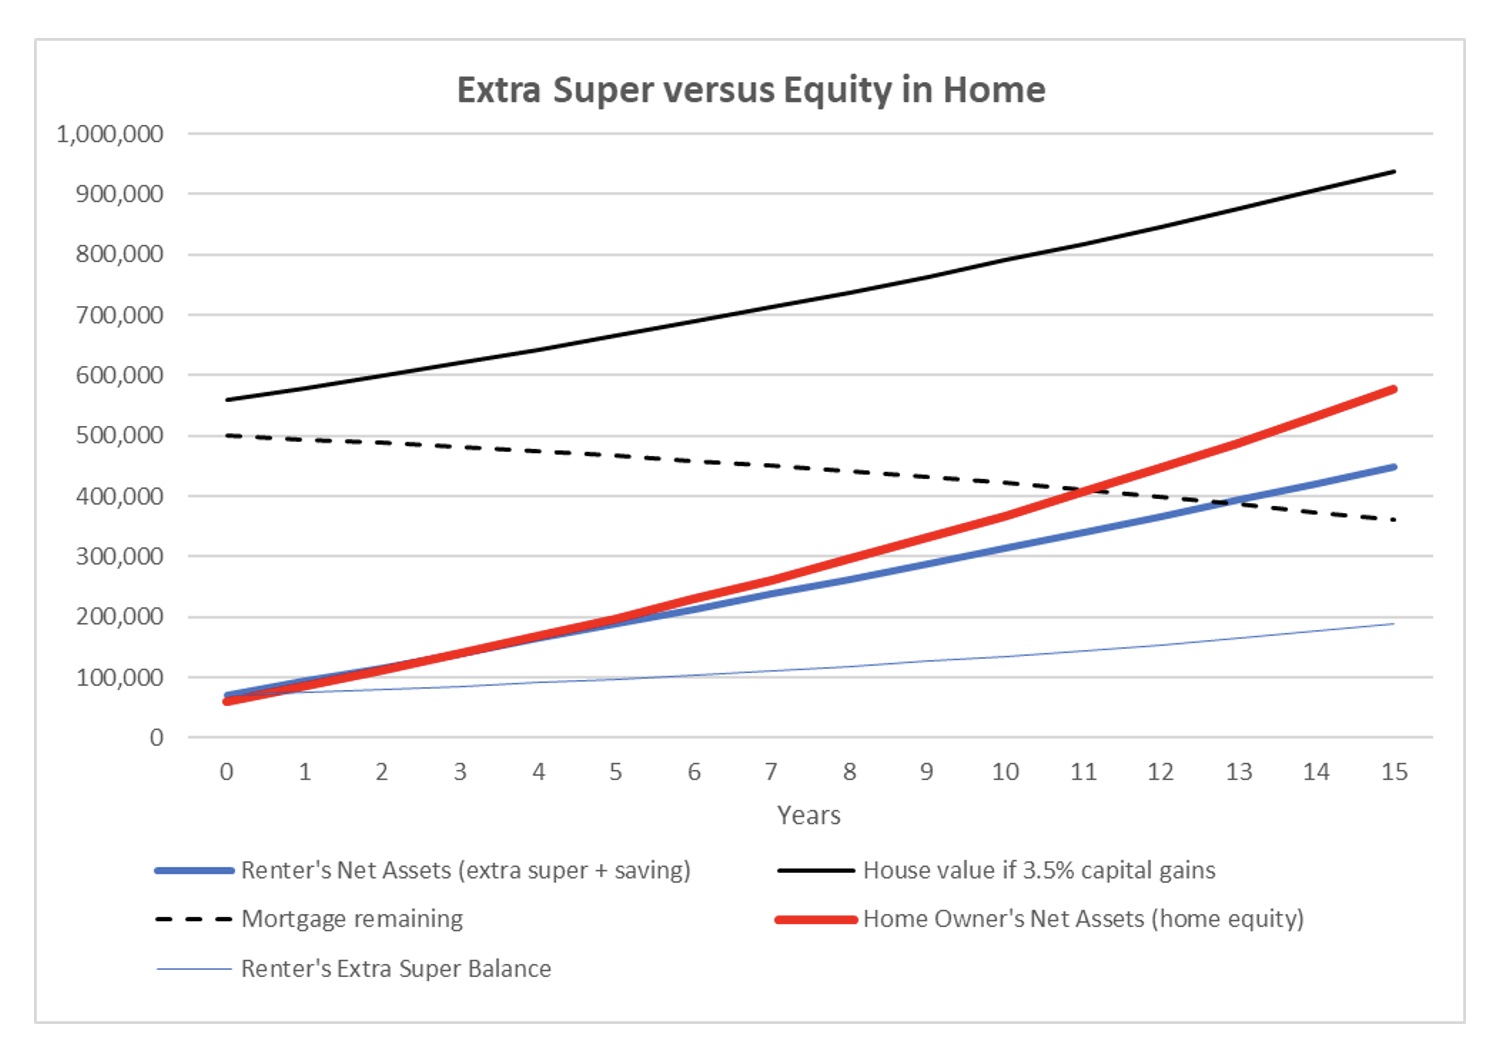
At the start (time zero), the net assets of the homeowner are slightly lower than the renter. This is due to the other assumed costs of buying the property such as legal and mortgage fees, valuation, building inspections, etc.
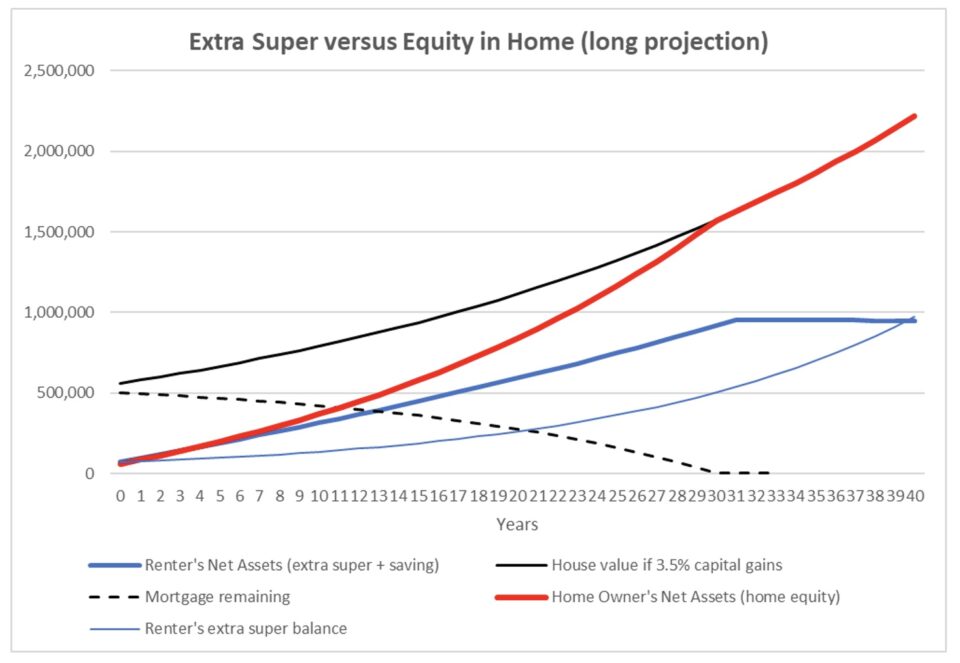
The next chart is the same as above but shown over a longer period. After 30 years, the red line meets the thin black line because the mortgage is fully repaid.
In the long run, the assets of the renter (shown by the thick blue line) are affected by the following:
- The renter’s assumed extra super balance grows with investment returns.
- In the early years, they also save additional amounts as they don’t have to pay the mortgage, etc,.
- But then in later years, those cashflow savings reverse and are assumed to be drawn upon to help pay the rent – given that the outgoings of the renter switch to being higher than the homeowner. This differential becomes dramatic after the mortgage is repaid. After 40 years, the assumed extra savings by the renter are exhausted.
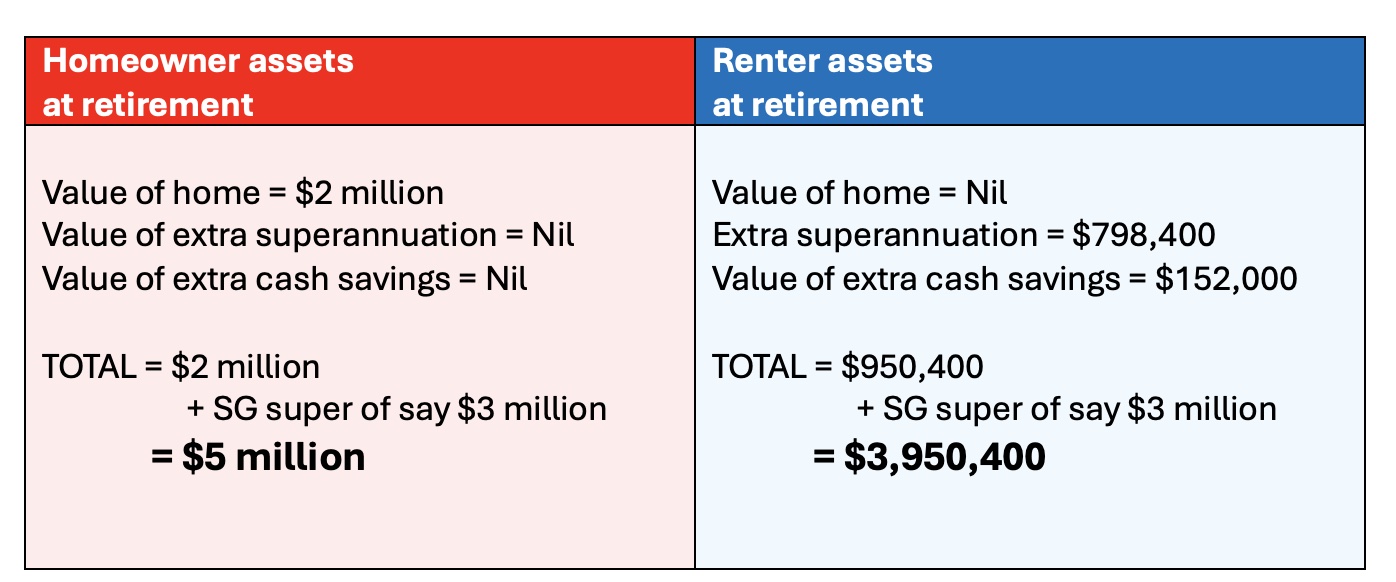
Position at retirement
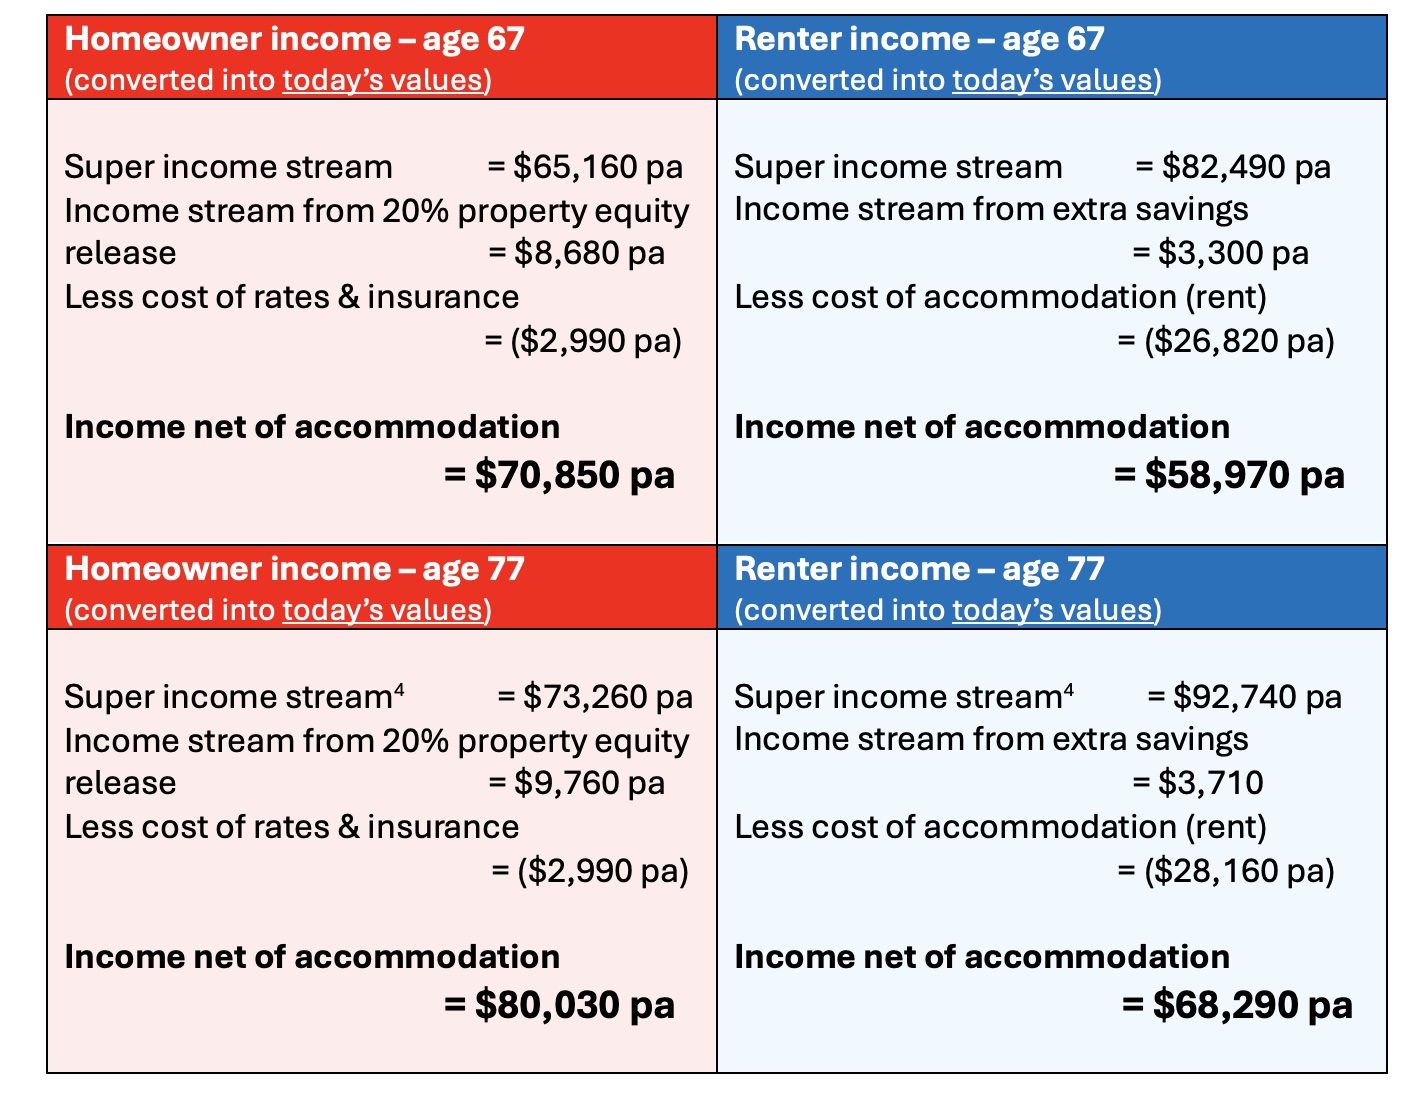
The relative positions of each option once they enter retirement at age 67 are as follows.
In each option we also add an estimate for their projected compulsory superannuation guarantee (SG) contributions over the course of their careers – assuming they work to age 67 and pay the SG contributions.
We assumed for simplicity that no other savings were made by the renter or homeowner between now and retirement other than SG contributions.
In practice, they could each contribute further amounts to increase their superannuation or other savings. After their mortgage is repaid, the homeowner has significantly more savings capacity than the renter does (we have not included this in the figures below).
For the income figures below, we have assumed the use of one of the ‘innovative lifetime income stream’ that life insurers and some superannuation funds are now starting to offer in response to the Retirement Income Covenant[3]. These products provide a simple way of converting superannuation balances into a regular income for the life of a member and their partner. They remove the need for each retiree to guess how long they will live.
For the renter, we assumed their extra savings balance at age 67 is also used to buy a lifetime income stream.
For the homeowner, they have a substantial asset in their home that the renter does not have. We assume they use an equity release structure to withdraw 20% of the equity in the home and use this money to buy a lifetime income stream.
We have converted the annual incomes into today’s dollars (we have removed future price inflation so the income figures are in today’s purchasing power).
Note that if they both contribute at the SG rate between now and retirement then we don’t expect they would be eligible for any means-tested Age Pension when they come to retire – whether or not they rent or own a home. If they did receive an Age Pension, the value of the home is exempt from means-testing under current rules. The asset test thresholds are higher for renters plus there may be rental assistance available (currently up to $4,893 per year[5]).
Wrapping-up
In summary, the scenario where the couple obtain a mortgage and buy a home sees them far better off than renting – by over $1m at their retirement.
Aside from the extra cashflow strain in the early years (which the renter is assumed to match by saving more) the homeowner builds their assets at a faster rate in all future years – as their home is geared i.e., the homeowner benefits from an asset that is up to 10 times larger than their initial investment.
As rents rise, there comes a point where the repayments on the mortgage are less than the cost of renting. If rents rise faster than what we have assumed, then all else being equal this point will occur earlier in time. The benefits of homeownership increase dramatically once the mortgage is fully repaid.
The home becomes a valuable asset for future equity release or to hedge the costs of Age Care and potentially be left as an inheritance.
It is hard to disagree that helping young Australians buy a home as soon as they can, should be a high priority for the Government. Helping Australians to be financially self-sufficient goes further than just saving into superannuation – where the benefits are generally experienced only after retirement (or earlier death or disablement).
Beyond financial considerations, owning your own home is often an important part of living well – particularly after retirement – providing security, satisfaction, and happiness.
References
[1] https://www.commbank.com.au/digital/home-loans/calculator/how-much-can-i-borrow?ei=calc_borrow
[2] They are assumed to be eligible for the First Home Loan Deposit Scheme so don’t pay lenders insurance. They are assumed to pay no stamp duty. See https://www.realestate.com.au/home-loans/guides/all-about-the-first-home-loan-deposit-scheme and https://www.realestate.com.au/home-loans/stamp-duty-calculator?cid=content-article:buyers:stamp-duty
[3] The rate of conversion from lump sum to income was taken from rates provided by Generation Life’s LifeIncome product. This assumes a 2.5% lifebooster rate. The lifebooster feature means higher starting income is payable because thereafter the income only increases each by the return on the chosen investment option less 2.5%. Other superannuation funds that offer ‘innovative lifetime income streams’ include QSuper (part of Australian Retirement Trust), Telstra Super and AMP.
[4] Assuming a gross return of 7.5% per annum in retirement less 1.2% fees.
[5] https://www.servicesaustralia.gov.au/how-much-rent-assistance-you-can-get?context=22206
Key assumptions
Financial assumptions over the long term:
- The renter couple invest their $70,000 savings, not in a deposit but in a balanced superannuation fund earning 8% p.a. gross or before tax, less a 1.2% p.a. allowance for fees and tax (net of imputation credits) = 6.8% p.a. net returns.
- Instead of buying a home, they pay rent, with rent increasing by 3% per year over the long-term.
- Mortgage interest rate 6.5% p.a.
- Bank interest on cash savings 3% p.a. net of tax.
- Salary increases 3.5% per annum.
- Capital gains on the home of 3.5% per annum. This is net of any maintenance costs. In reality property prices are often assumed to increase faster but it’s important to acknowledge properties require maintenance and part of the total capital gain absorbs the costs of maintenance.
Case study assumptions:
- Assumes the home-buyers are in continuous full time employment and can qualify for a mortgage.
- The First home-buyers qualify for Nil Stamp Duty and Nil Mortgage Insurance cost schemes.
- Assumed the home-buyers pay $2,500 per annum for council rates and building insurance, increasing at 3% p.a.
- Chart figures are in nominal terms (we have not removed the effects of future inflation).
- The graphs of projected super balances relate only to the amount contributed at the date of home purchase. Both the buyers and renters would also have a balance relating to their SG contributions in addition to what is shown in the charts. We allow for this in the retirement projections section assuming 12% SG contributions.
Other things to consider:
- In reality there could be interest rate shocks and market falls (of both the home value and super returns).
The Actuaries Institute is not a financial adviser. You should consider seeking independent legal, financial, taxation or other advice to see how the article information relates to your personal circumstances. The Actuaries Institute is not liable for any loss caused, whether due to negligence or otherwise arising from the use of, or reliance on, the information provided directly or indirectly, by use of this article.
CPD: Actuaries Institute Members can claim two CPD points for every hour of reading articles on Actuaries Digital.


