


COVID-19: Total excess mortality for first two months of 2022 estimated at 15%
Catch up on the Actuaries Institute’s COVID-19 Mortality Working Group’s latest analysis of excess deaths.
In summary:
|
![]()
Background
The COVID-19 Mortality Working Group has examined the latest provisional mortality statistics up to 28 February 2022, released by the ABS on 25 May.
We have compared the observed deaths to our ’baseline‘ predicted number of deaths for doctor-certified deaths broken down by cause, plus coroner-referred deaths in total.
We have also:
- provided an indicative estimate of excess mortality due to COVID-19 only, for the months of March to May 2022; and
- compared our excess mortality estimates to those produced by the ABS and the World Mortality Dataset (WMD) that are in turn available from Our World in Data (OWID).
Inclusion of coroner-referred deaths
Our most recent article examined the ABS data up to 31 December 2021. This data covered doctor-certified deaths but not those referred to the coroner. About 12% of all deaths are referred to the coroner, including about 6% of deaths from disease and nearly all of those from external causes.
To provide as complete a picture as possible of total deaths, the ABS now includes an estimate of coroner-referred deaths. This uses provisional reports of deaths to the coroner, enabling the death to be counted and basic demographic information such as age, gender and state/territory to be reported.
However, by their very nature, these reports have not yet had the cause of death determined, so the ABS cannot report these deaths by cause. This means that the ABS reports now represent provisional estimates of all deaths in Australia, but any analysis by cause still reflects doctor-certified deaths only.
Baseline prediction for 2020 and 2021
In our previous work, we formed estimates of the baseline predicted numbers of deaths for 2020 and 2021 by:
- scaling actual weekly deaths from 2015 to 2019 so that they are representative of the number of deaths in those years if they had the 2020 or 2021 population size and age mix;
- fitting a linear regression model to the scaled deaths from 2015 to 2019; and
- extrapolating the linear regression model to arrive at a predicted number of deaths for each week in 2020 and 2021.
For this work, we have followed the same approach, however we have based our modelling on standardised death rates (SDRs) calculated by the ABS, rather than scaled deaths, as SDRs encapsulate more information than our scaled deaths. We have then converted the projected SDRs into equivalent numbers of deaths, as these are intuitively easier to understand.
Our estimates of excess deaths for 2020 and 2021 remain ‘in the absence of the pandemic’.
![]()
Baseline prediction for 2022
Now we need to form a baseline prediction for 2022. In so doing, we have decided that it is appropriate to continue to estimate our baseline in the absence of a pandemic. This makes the measurement and analysis of excess mortality more meaningful.
So far, we have used the 2015-19 years as the basis for our projections and have been able to attribute excess deaths to the impacts of the pandemic. However, as time marches on, this approach becomes more problematic; the 2015-19 years are getting old.
While it is completely reasonable to project mortality out for one year (2020), and still justifiable to project mortality out for a second year (2021), projecting out for a third year (2022) feels like a stretch. Ignoring the latest two years of mortality data in forming projections for 2022 also does not feel right.
Nevertheless, as we have decided to continue to measure excess deaths relative to no pandemic, we cannot simply use the 2020 and 2021 experience without adjustment. At the same time, it is hard – if not impossible – to determine how much of the experience is due to the pandemic and how much is random.
Accordingly, we have:
- not included any COVID-19 deaths in the 2022 baseline, as these would not exist in the absence of the pandemic;
- used 2015-19 experience to set our 2022 baseline for deaths from respiratory disease and dementia, on the basis that 2020 and 2021 experience for these causes was materially affected by the pandemic; and
- used 2015-21 experience to set our 2022 baseline for deaths from all other causes and for coroner-referred deaths, on the basis that it is likely that 2020 and 2021 experience more closely reflects a slow-down in underlying mortality improvement than the impacts of the pandemic.
This approach results in a higher baseline for deaths from respiratory disease and dementia than would be the case if we had included 2020 and 2021 data in determining the trend. Including 2020 and 2021 in determining the trend for other cases (excluding COVID-19) has also increased the baseline relative to the 2015-19 trend. However, we consider it to be our best estimate of expected 2022 deaths in the absence of a pandemic.
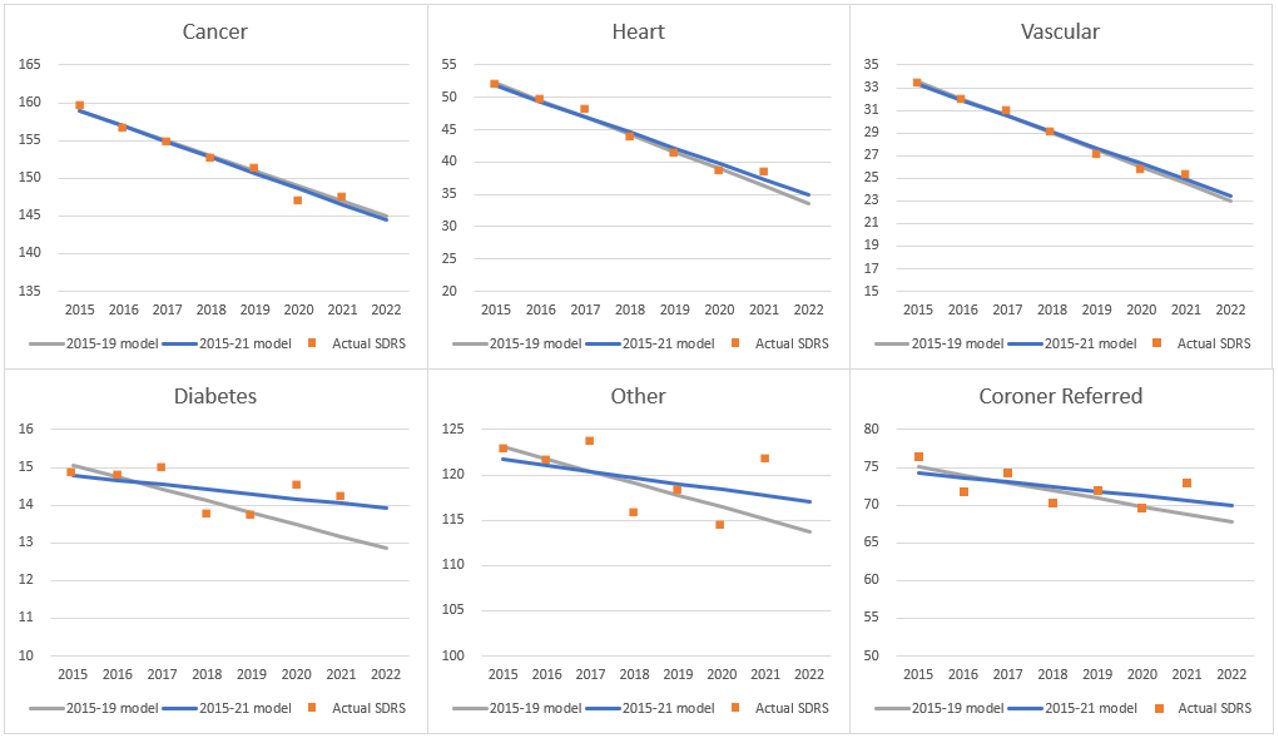
As always, it is important to note that predicted death numbers are increasing faster from demographic changes (ageing and population size) than they are reducing due to mortality improvement. As a result, our model predicts higher deaths in each successive year. In each of the figures below we show death rates rather than numbers, to enable a clearer understanding of the trends.
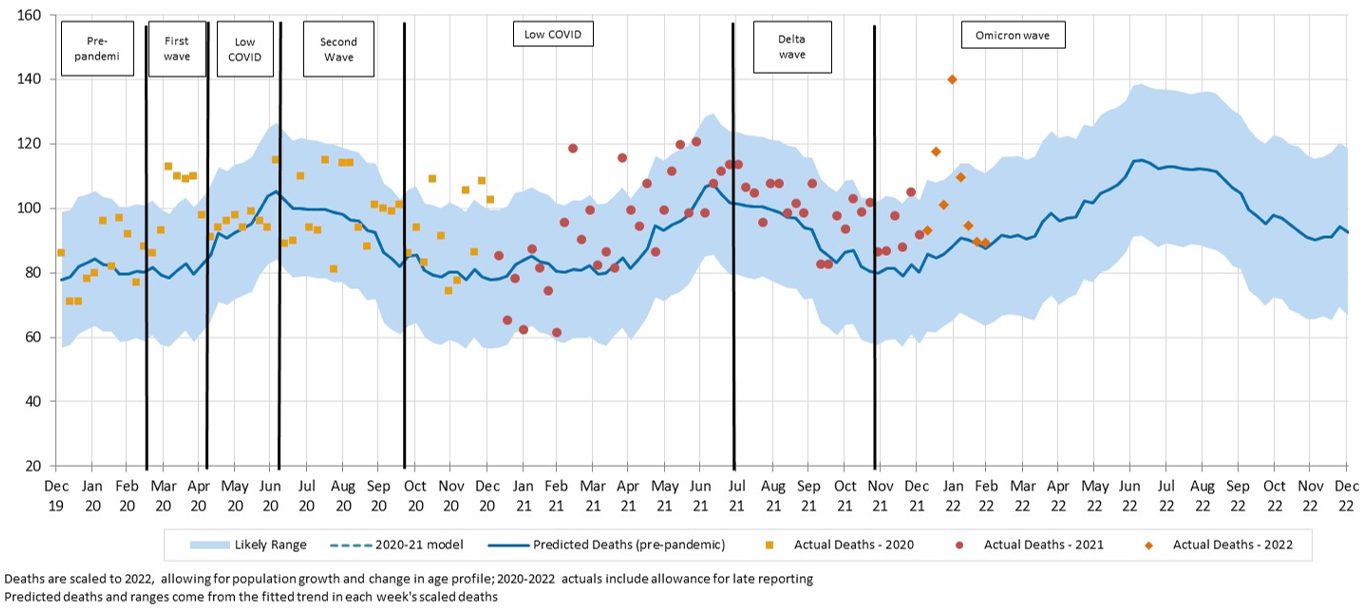
Figure 1 shows the impact of moving from the 2015-19 models to the 2015-21 models for the non-respiratory causes of death.
Figure 1 – Actual and modelled SDRs (deaths per 100,000 standard population) for non-respiratory causes, comparing 2015-19 and 2015-21 trends
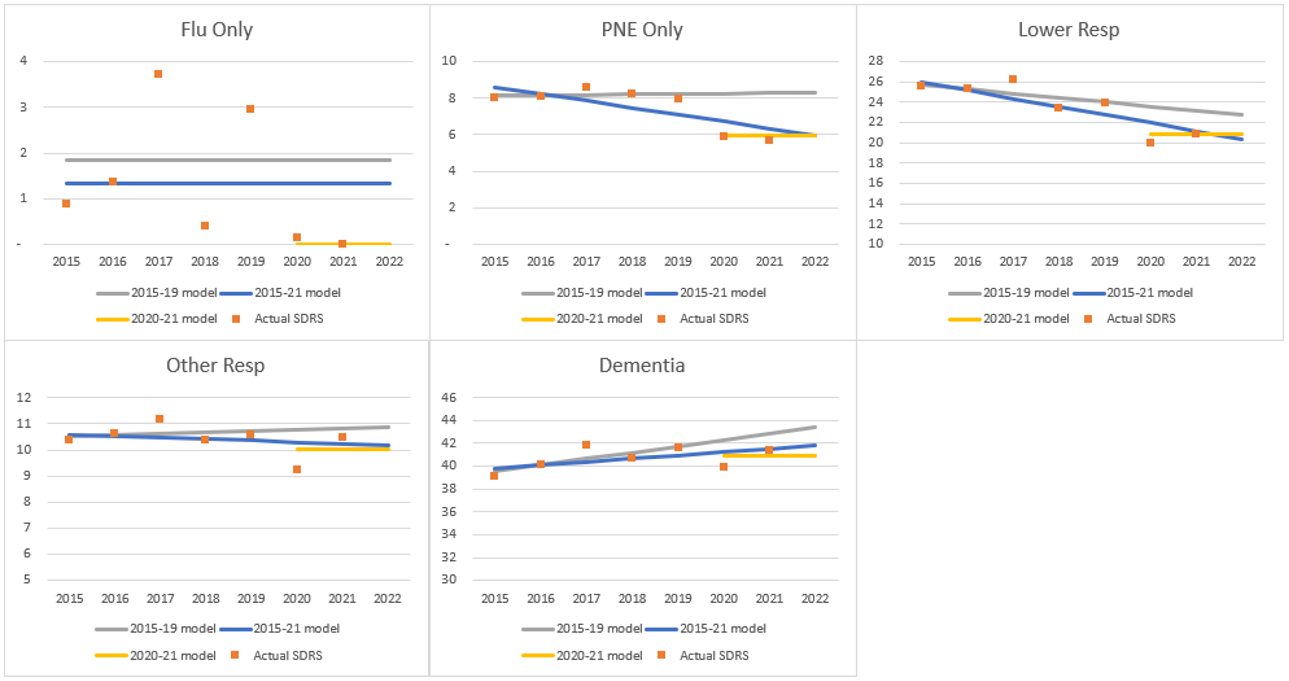
It is unclear how deaths from respiratory disease and dementia may change in 2022 and beyond, with:
- international borders are now open, meaning that we will observe deaths due to influenza once again; but
- the likelihood that those most susceptible to respiratory disease will continue to protect themselves (or will be protected by their aged care homes and hospitals).
Therefore, it is useful to include a reference to the average experience in 2020-21 when analysing mortality from these causes.
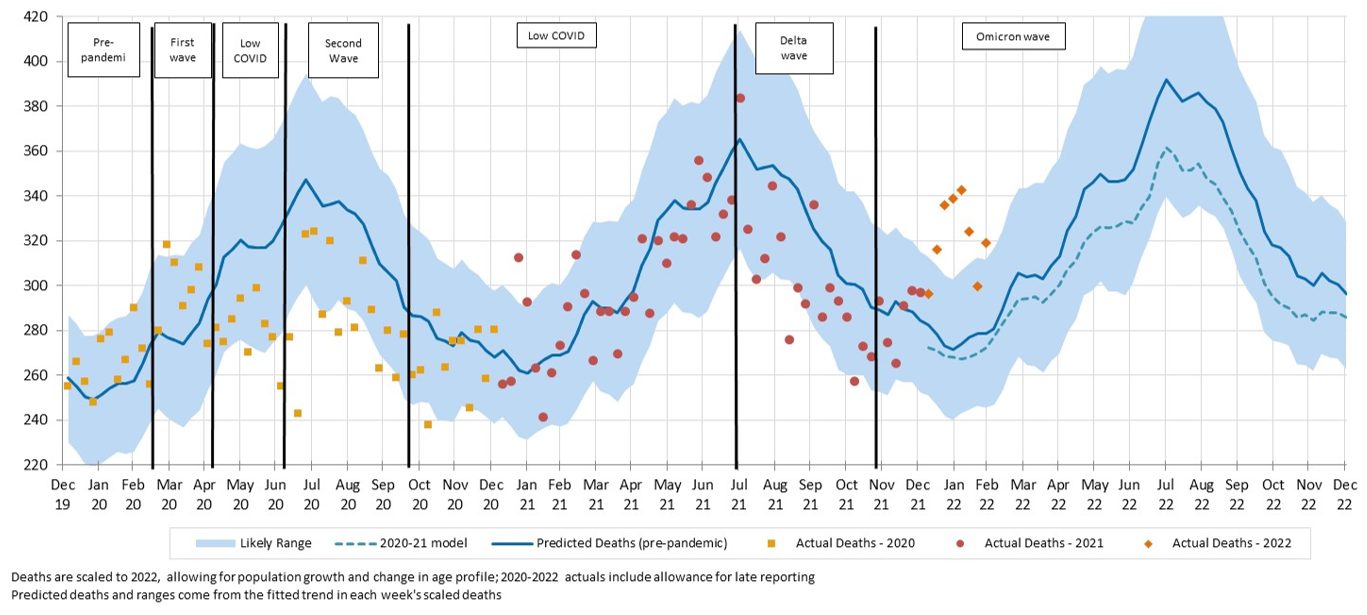
Figure 2 shows the difference between the two projection trends for the respiratory causes of death and for dementia. It also shows a model fitted to the2020 and 2021 years only but without any time trend (essentially a model of the average experience across these two years).
Figure 2 – Actual and modelled SDRs (deaths per 100,000 standard population) for respiratory disease and dementia, comparing 2015-19 and 2015-21 trends and showing the 2020-21 average
Excess deaths to 28 February 2022
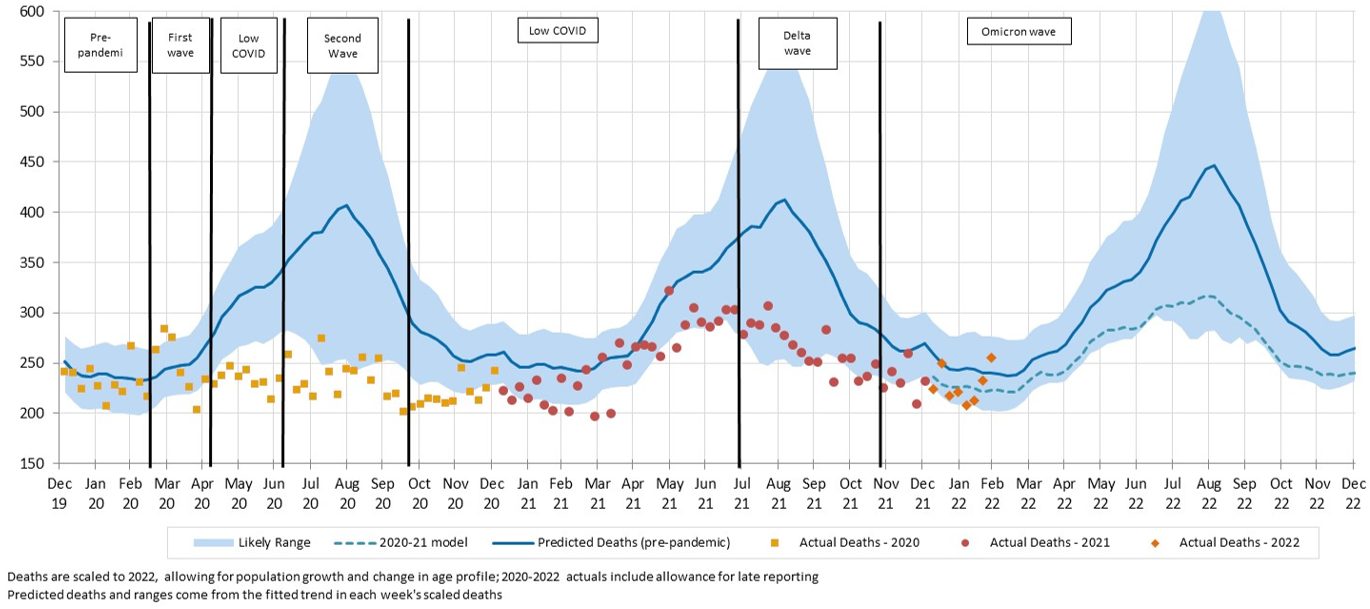
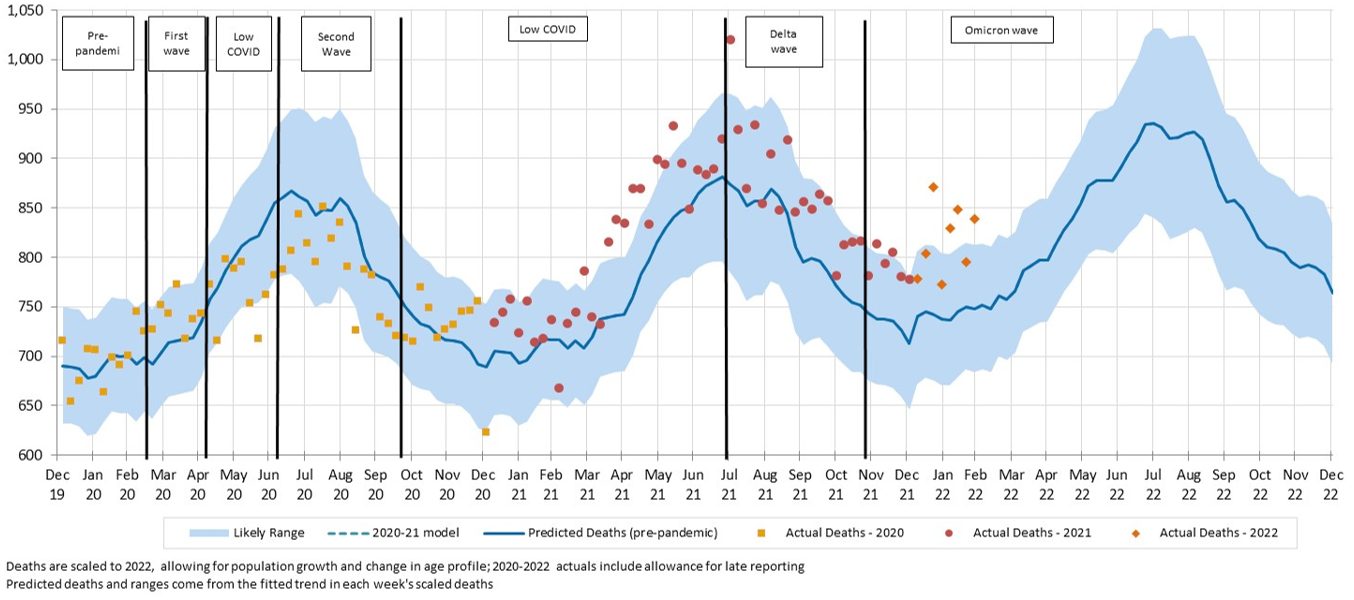
Figure 3 and Table 1 below summarise the results of the analysis. This article concentrates on the experience in 2022, but we have also shown the 2020 and 2021 results for context.
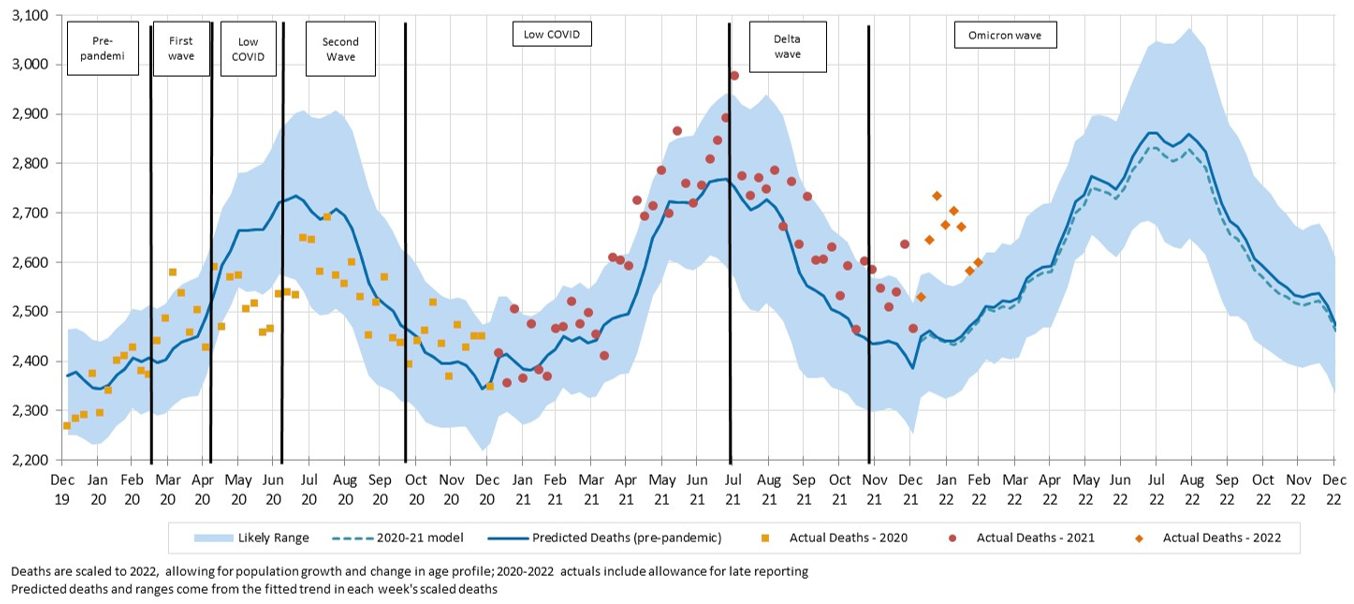
Figure 3 – Weekly actual and predicted deaths in Australia – all causes
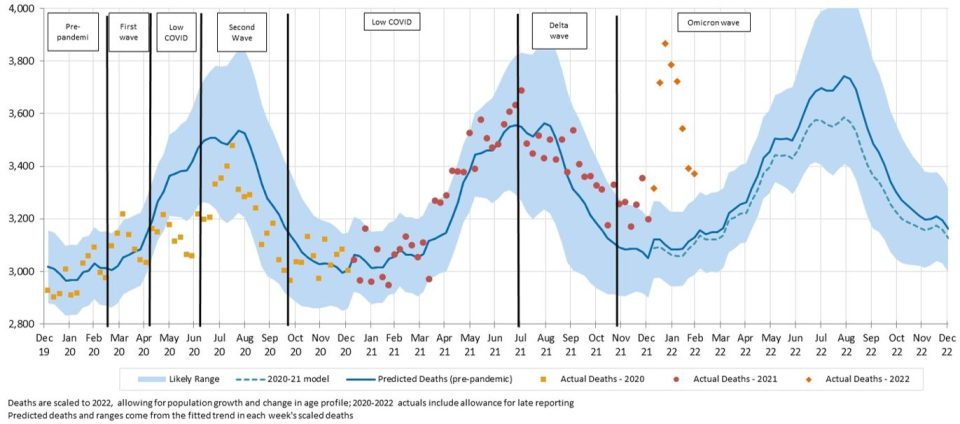
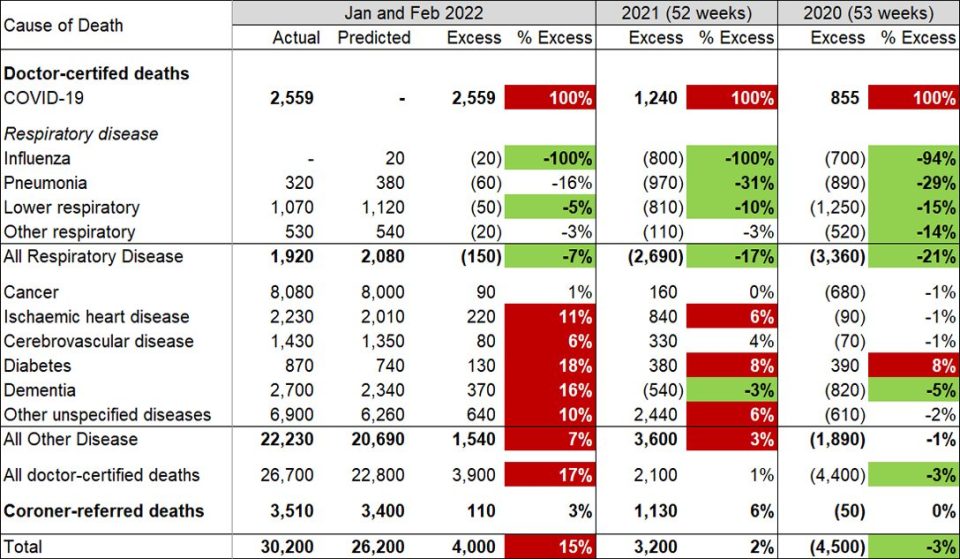
Table 1 – Excess deaths in Australia – 2020, 2021 and January & February 2022
For the first two months of 2022, total deaths were 15% (or +4,000) higher than predicted (18% higher in January and 13% higher in February). This compares with excess deaths of -4,500 for 2020 and +3,200 for 2021. Deaths were above the upper end of the prediction interval (i.e. above the 97.5th percentile) for every week so far in 2022.
By cause, in aggregate for these two months:
- there were 2,559 doctor-certified deaths from COVID-19, representing around two-thirds of the excess deaths;
- deaths from respiratory disease continued to be lower than expected (down 7% or 150), noting that there are normally relatively few such deaths at this time of the year;
- deaths from cancer were close to expected, as has been the case so far throughout the pandemic;
- deaths from heart disease, cerebrovascular disease, diabetes, dementia, and other diseases were all higher than predicted (by between 6% and 18%, or a total of 1,540); and
- coroner-referred deaths were a little higher than expected, noting that some COVID-19 deaths (such as when people die at home) will have been referred to the coroner.
Data included in the ABS article COVID-19 Mortality in Australia released on 18 May 2022 shows that, in the months of January and February, there were 401 deaths in people who were COVID-19 positive at death but where COVID-19 was not the primary cause of death. This means that COVID-19 was a contributory factor in around one third of the excess mortality from non-COVID-19 causes.
![]()
COVID-19 related deaths in March to May 2022
While the ABS provisional mortality statistics data is only available until the end of February 2022, surveillance COVID-19 deaths are available daily. Figure 4 shows the number of such deaths in each month of 2020, 2021 and first five months of 2022.
On 31 March, NSW Health released a report that detailed the outcomes of a reconciliation between their daily death counts and data held by Births, Deaths and Marriages (which is the basis of the ABS data). This reconciliation identified 331 deaths that had not been captured in the daily counts. We have shown these deaths separately in the chart, allocated to the months when the deaths occurred.
Figure 4 – COVID-19 deaths in Australia, reported from surveillance systems
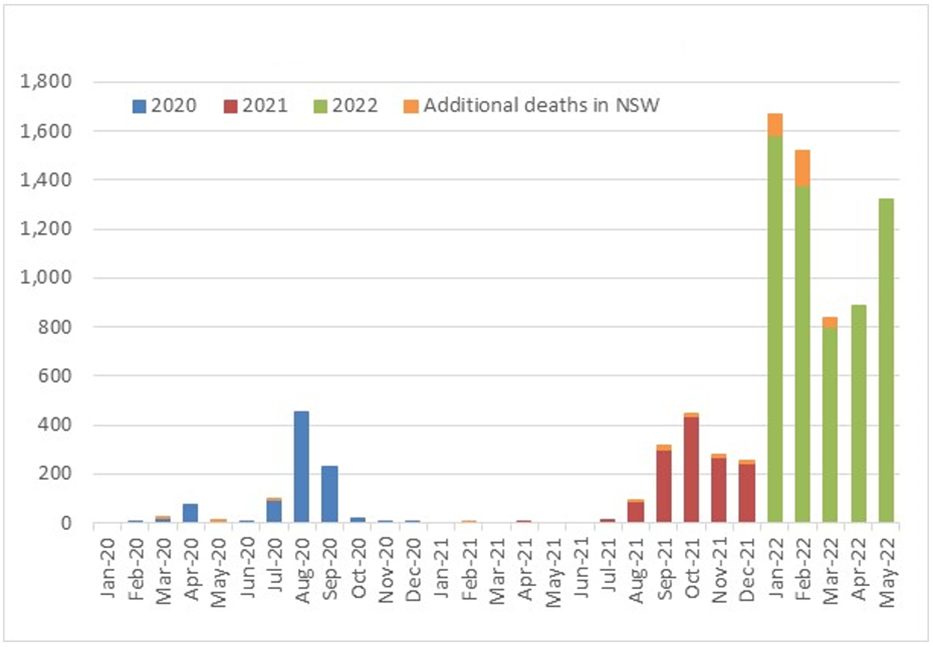 Including the additional NSW deaths, there were 912 official COVID-19 deaths in 2020 (including 854 doctor-certified) and a further 1,402 deaths in 2021 (1,212 doctor-certified). So far in 2022, there have been 6,242 COVID-19 deaths. Of these, 3,054 have occurred in the last three months (where we have no provisional mortality statistics).
The ABS article COVID-19 Mortality in Australia showed that, since the Omicron wave, COVID-19 was not the underlying cause of death on an increasing proportion of death certificates mentioning COVID-19.
Figure 5 – A comparison of deaths ‘from’ COVID-19 to those ‘with’ COVID-19 (source: ABS)
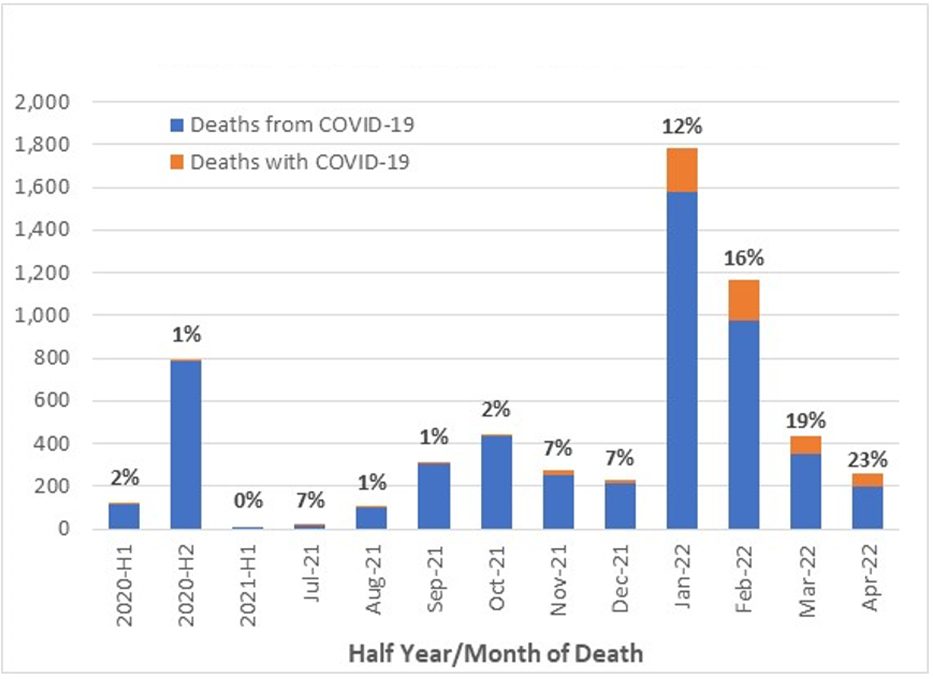
Figure 5 shows that, in January 2022, 12% of COVID-19 deaths were with COVID-19 and that this proportion rose to 16% in February.
A comparison of Figure 5 with Figure 4 shows that most deaths with or from COVID-19 in March and April have not yet been reported by the ABS. However, we note that the proportion with COVID-19 is higher again in March and April. We consider it reasonable to assume that, in March to May 2022, around 15-20% of COVID-19 deaths may have been with COVID-19 rather than from COVID-19. Therefore, we estimate that, of the 3,054 deaths reported in March to May 2022, around 2,500 may be due to COVID-19.
Our prediction model suggests that, without a pandemic, there would have been a total of around 42,900 deaths in the month of March to May of 2022.
Thus, COVID-19 deaths represent around 6% extra mortality over March to May 2022 (around 5% in each of March and April and about 7% in May). As we consider it unlikely that mortality from non-COVID-19, non-respiratory causes will be in line with our pre-pandemic predictions, given the higher-than-expected mortality in 2021 and early 2022, we think it likely that total excess mortality in that period will have been higher than 6%.
Figure 6 combines our preliminary estimate of excess deaths due to COVID-19 only for March to May 2022 with our detailed excess death estimates shown earlier, to reveal cumulative excess mortality since the start of 2020.
Figure 6 – Estimated cumulative excess deaths in Australia since 1 January 2020
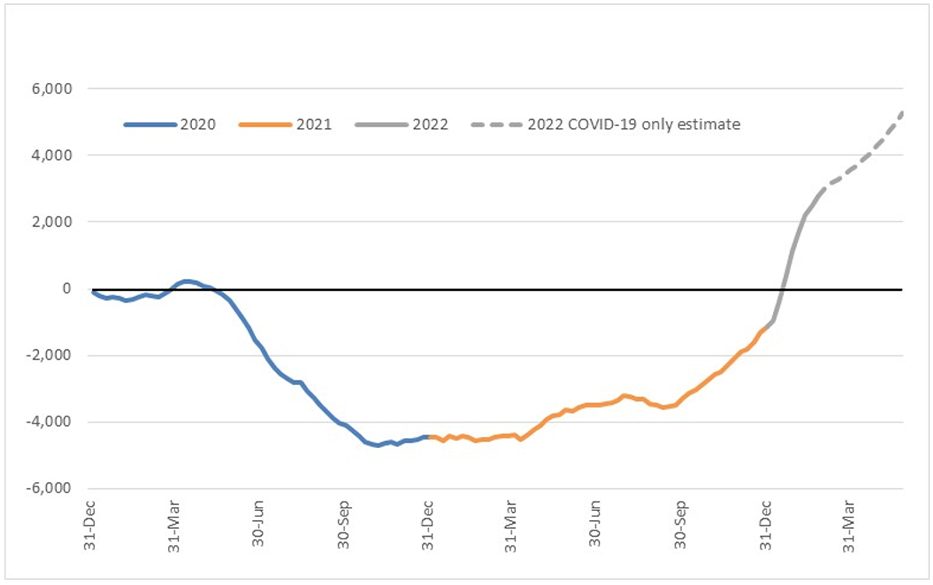
Deaths from the Delta wave in the latter part of 2021 and the Omicron wave in early 2022 had fully eroded the negative excess deaths experienced earlier in the pandemic by early January 2022. Cumulatively across the pandemic, our conservative estimate is that Australia had experienced 5,500 excess deaths by the end of May 2022. This represents an average excess mortality rate of about 1% to 1.5% over that time.
![]()
Comparison to ABS excess deaths
With the latest release of provisional mortality statistics, the ABS also released an updated analysis of excess deaths for doctor-certified deaths only.
A key difference in approach between our estimate of excess deaths and the ABS estimate is the data used to form the estimate of predicted deaths. As described earlier, our expected number of deaths in 2020 to 2022 are in the absence of the pandemic. The ABS has used data from 2016 to 2020 to form an estimate of the expected deaths in each year 2016-2022. Compared with our approach:
- the ABS estimates are not ‘in the absence of a pandemic’, given that they use the 2020 year in forming their predictions;
- the ABS prediction for 2020 is based on data that includes the 2020 year, so it is not formed independently; and
- the ABS predictions do not explicitly allow for changes in population size and age distribution, rather implicitly assuming them from prior trends.
Table 2 shows a comparison between our estimate and the ABS estimate.
Table 2 – ABS v actuaries estimates of excess doctor-certified deaths in Australia
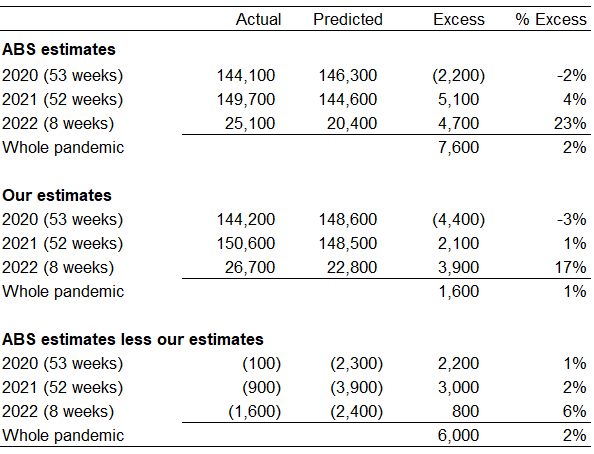 |
The ABS estimates of excess deaths are higher than our estimates for all years, but particularly for 2022:
- Our estimate includes a higher number of ‘actual’ doctor-certified deaths. This is due to our inclusion of an allowance for late-registered deaths.
- Our predicted numbers of deaths are higher than the ABS. This is likely to be largely due to the ABS including the year 2020 (with low deaths from respiratory diseases) in the predictive model, as well as allowing only implicitly for changes in population size and age distribution.
 Comparison to WMD excess deaths
The World Mortality Dataset (WMD) analyses excess deaths all around the globe, using the approach of the June 2021 paper Tracking excess mortality across countries during the COVID-19 pandemic with the World Mortality Dataset by Karlinsky and Kobak. The full database of actual deaths, predicted deaths and excess deaths for each country is available on GitHub.
Our World in Data draws its information on excess deaths in Australia from the WMD.
Table 3 – WMD v actuaries estimates of excess total deaths in Australia
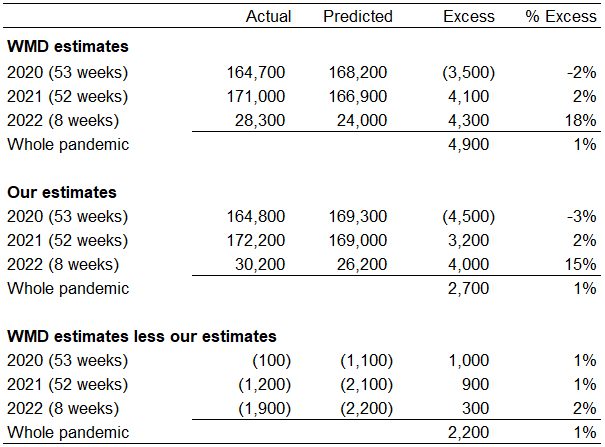 |
Our estimates of excess deaths are a little higher than the WMD estimates:
- As for the comparison with the ABS, our estimate includes a higher number of ‘actual’ doctor-certified deaths due to our inclusion of an allowance for late-registered deaths.
- Our predicted values are quite close for the 2020 and 2021 years, but our estimates are higher than WMD for the first two months of 2022. This is likely due to modelling differences; we have adopted predicted values for 2022 that incorporate a slowdown in the mortality improvement observed in 2020 and 2021, whereas WMD would be projecting this improvement to continue.
Comparison to previous estimate of excess deaths
Table 4 compares our current estimates of excess deaths for 2020 and 2021 to our previous estimates (formed using data to 31 December 2021). We have shown the amounts spilt between doctor-certified and coroner-referred deaths.
Table 4 – Revisions to actuaries estimates of excess total deaths in Australia
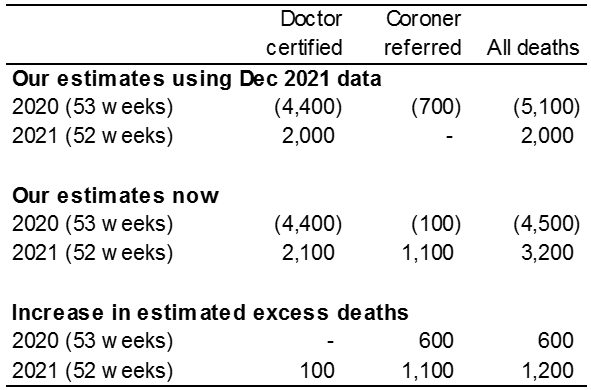 |
For 2020, our estimate of excess deaths has increased from -5,100 to -4,500 (+600) while for 2021, our estimate has increased from +2,000 to +3,200 (+1,200).
Almost all of this change is in respect of coroner-referred deaths, noting that when we formed our December 2021 estimates there was only very limited information available on actual coroner-referred deaths for 2020 and no information at all for 2021.
- For 2020, the increase of 600 coroner-referred excess deaths is due in equal measure to a slightly higher number of actual deaths and a small downwards revision to our predicted number of deaths.
- For 2021, the increase of 1,100 coroner-referred excess deaths is largely due to higher numbers of actual deaths (+900) and a small downwards revision to our predicted number of deaths (-200).
| The remainder of this article shows actual versus predicted deaths to 28 February 2022. Analysis and discussion of individual causes of death refer to doctor-certified deaths, while coroner-referred death are for all causes combined. |
COVID-19 deaths in 2021
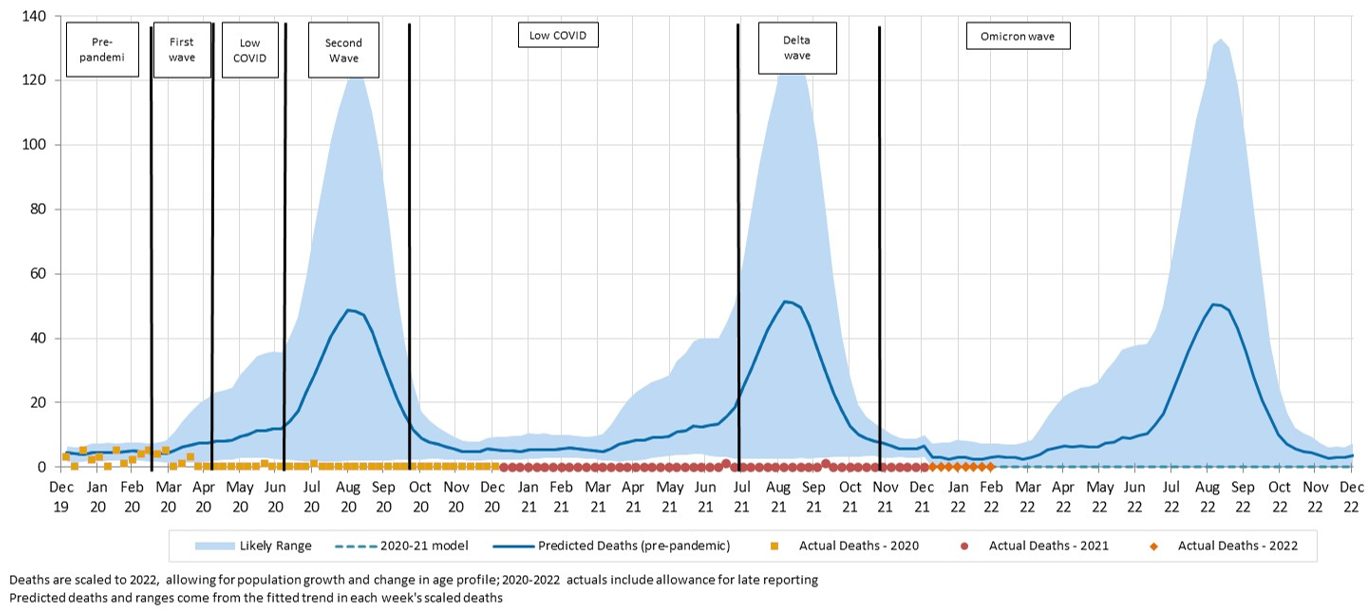
Figure 7 – Weekly actual and predicted doctor-certified deaths in Australia – COVID-19
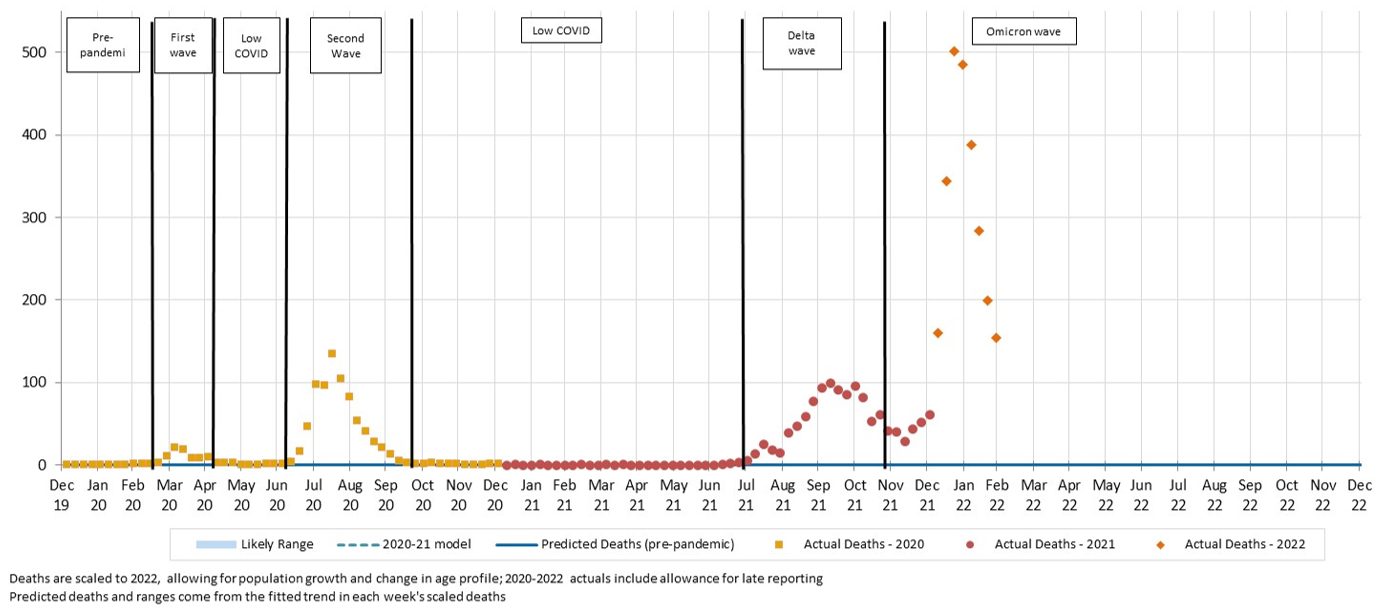
There were 2,521 doctor-certified deaths from COVID-19 in January and February 2022, compared to the 3,188 surveillance deaths (667 fewer). We would not expect the numbers to be identical, because:
- there are delays between time of death and lodgement of the doctor’s certificate (noting that we have not made any allowance for late reported COVID-19 deaths);
- the reporting criteria are different, with the main difference being that the surveillance reporting includes all deaths in people who have died while COVID-19 positive and without another clearly obvious unrelated cause (e.g. trauma), whereas the ABS deaths only include deaths where COVID-19 was the primary cause of death; and
- some COVID-19 deaths will be referred to the coroner (e.g. deaths occurring at home).
Clearly, COVID-19 deaths in 2022 have far exceeded deaths from this cause earlier in the pandemic, with some weeks recording around 500 deaths due to COVID-19.
![]()
Deaths from respiratory disease
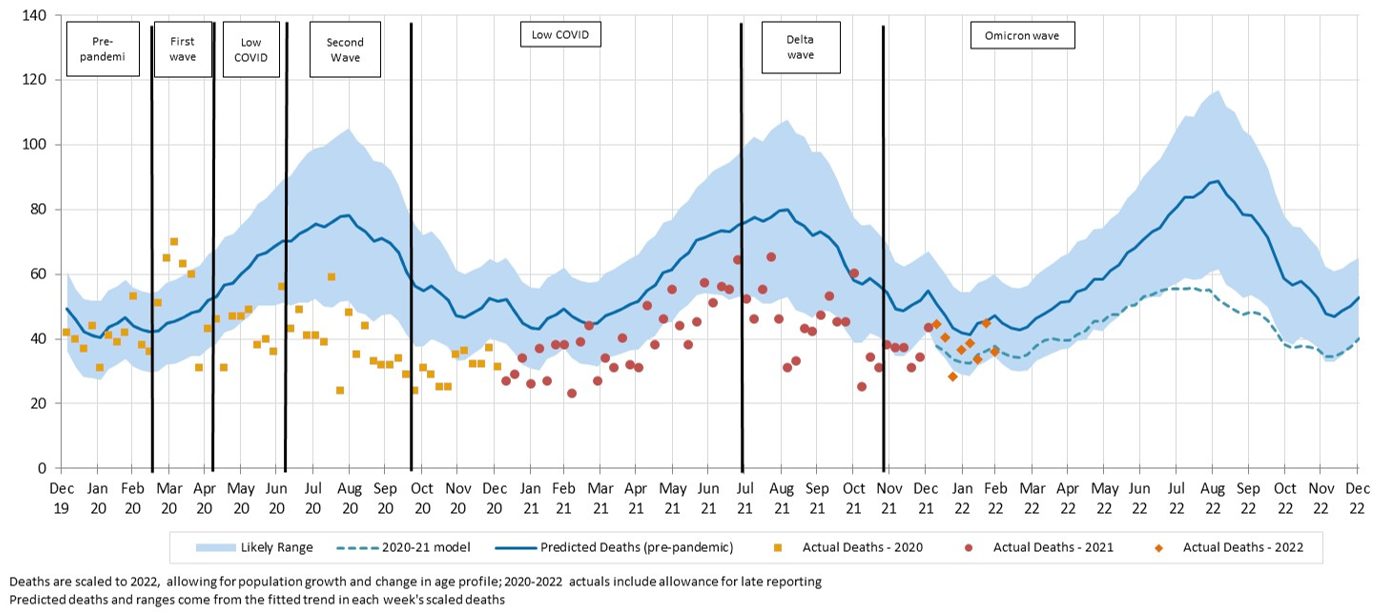
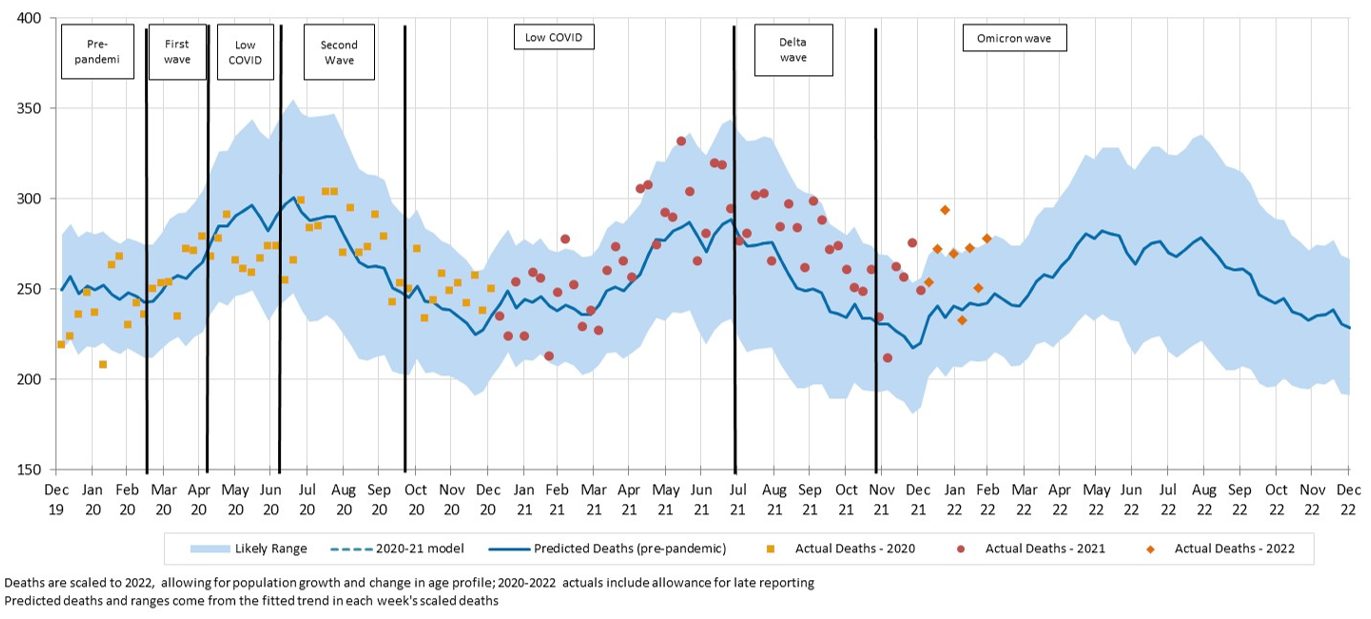
Figure 8 – Weekly actual and predicted doctor-certified deaths in Australia – all respiratory diseases
In most weeks of 2022, deaths from respiratory disease were lower than expected, following the trend throughout most of the pandemic. Note, however, that the numbers of respiratory deaths in the last two weeks of February were similar to or higher than expected.
The following figures present a breakdown of respiratory disease into influenza, pneumonia, lower respiratory disease, and other respiratory diseases.
Figure 9 – Weekly actual and predicted doctor-certified deaths in Australia – influenza
There have been no Influenza deaths so far in 2022.
Figure 10 – Weekly actual and predicted doctor-certified deaths in Australia – pneumonia
There were fewer pneumonia deaths than predicted so far in 2022, although within the 95% prediction interval.
Figure 11 – Weekly actual and predicted doctor-certified deaths in Australia – lower respiratory diseases
Deaths from lower respiratory disease were close to predicted in 2022.
Figure 12 – Weekly actual and predicted doctor-certified deaths in Australia – other respiratory diseases
Deaths from other respiratory diseases continue to be close to our predictions in 2022 with the exception of the last week of February which was very high (above the 95% prediction interval).
![]()
Non-COVID-19 and non-respiratory deaths
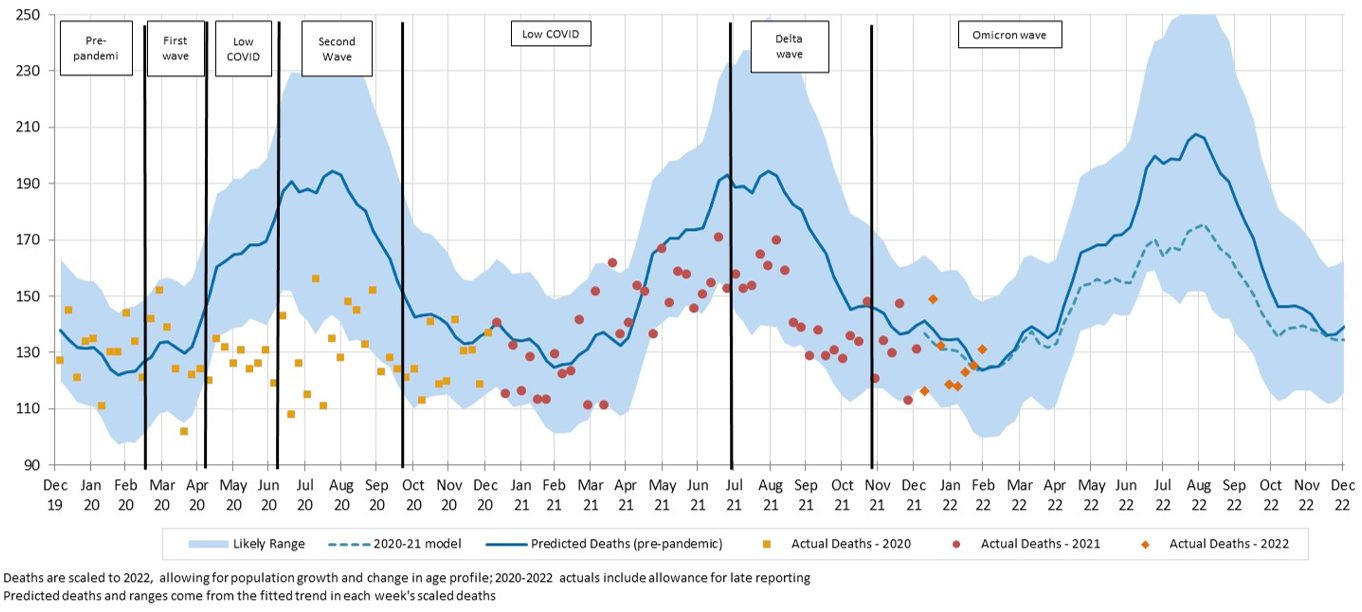
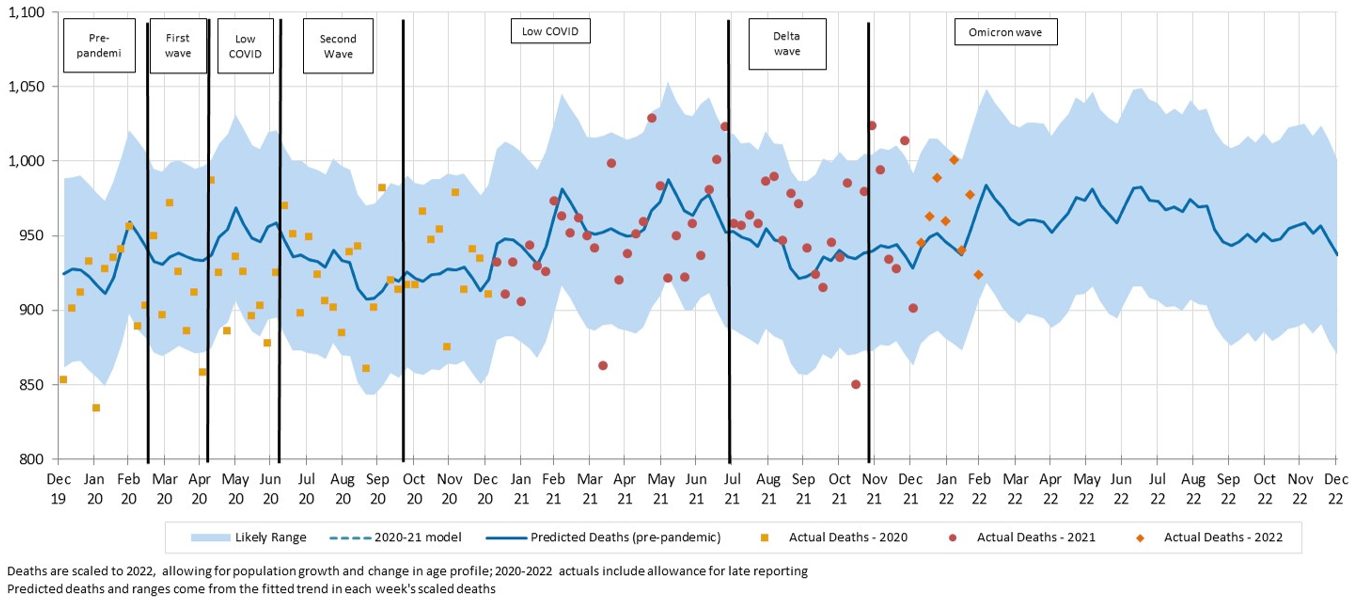
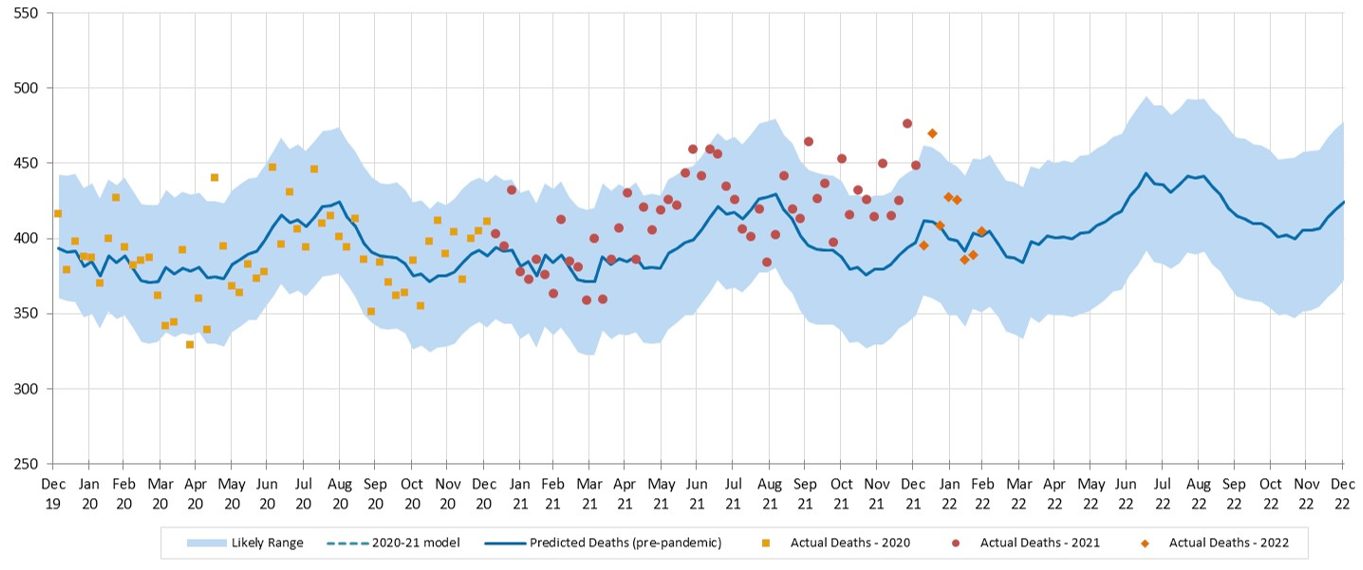
Figure 13 – Weekly actual and predicted doctor-certified deaths in Australia – all causes other than respiratory diseases and COVID-19
Excluding deaths from COVID-19 and respiratory diseases, deaths in January and February 2022 were much higher than expected, and well above the prediction interval for many weeks. Almost all causes of death exhibit this trend; cancer is the only exception.
The following figures show a breakdown of non-respiratory/non-COVID-19 deaths into cancer, heart disease, cerebrovascular disease, diabetes, dementia, and all other causes.
Figure 14 – Weekly actual and predicted doctor-certified deaths in Australia – cancer
Cancer deaths continue to be close to predicted numbers for most weeks. With diagnostic testing down in 2020, there were concerns that there would be a spike in cancer deaths in 2021 and beyond. While it is still early days, we are not yet seeing any evidence of this effect.
Figure 15 – Weekly actual and predicted doctor-certified deaths in Australia – ischaemic heart disease
Deaths from ischaemic heart disease were 11% higher than predicted so far in 2022, with 5 out of 8 weeks at or above the prediction interval.
Figure 16 – Weekly actual and predicted doctor-certified deaths in Australia – cerebrovascular disease
For cerebrovascular disease, actual deaths are 6% higher than predicted so far in 2022. Three weeks are well above the prediction interval.
Figure 17 – Weekly actual and predicted doctor-certified deaths in Australia – diabetes
Deaths from diabetes are 18% higher than expected so far in 2022, with one week in particular very high. Deaths from diabetes only make up a small proportion of all deaths, which leads to a somewhat higher volatility, however most weeks have been above the mean prediction since early 2021.
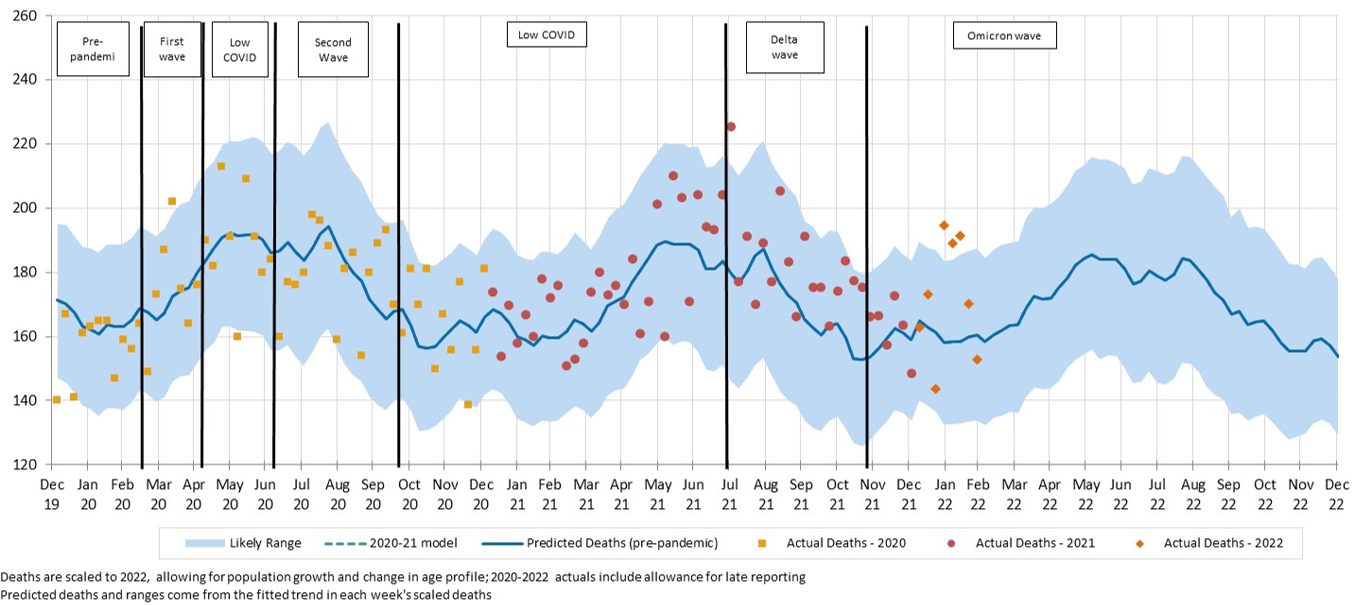
Figure 18 – Weekly actual and predicted doctor-certified deaths in Australia – dementia
Deaths from dementia were significantly higher than expected and well above the prediction interval for most weeks of 2022 to date.
Figure 19 – Weekly actual and predicted doctor-certified deaths in Australia – other unspecified diseases
Deaths from other causes, i.e. those not explicitly reported on by the ABS, were again much higher than expected in 2022. Four weeks were higher than the upper limit of the prediction interval.
![]()
Coroner-referred deaths
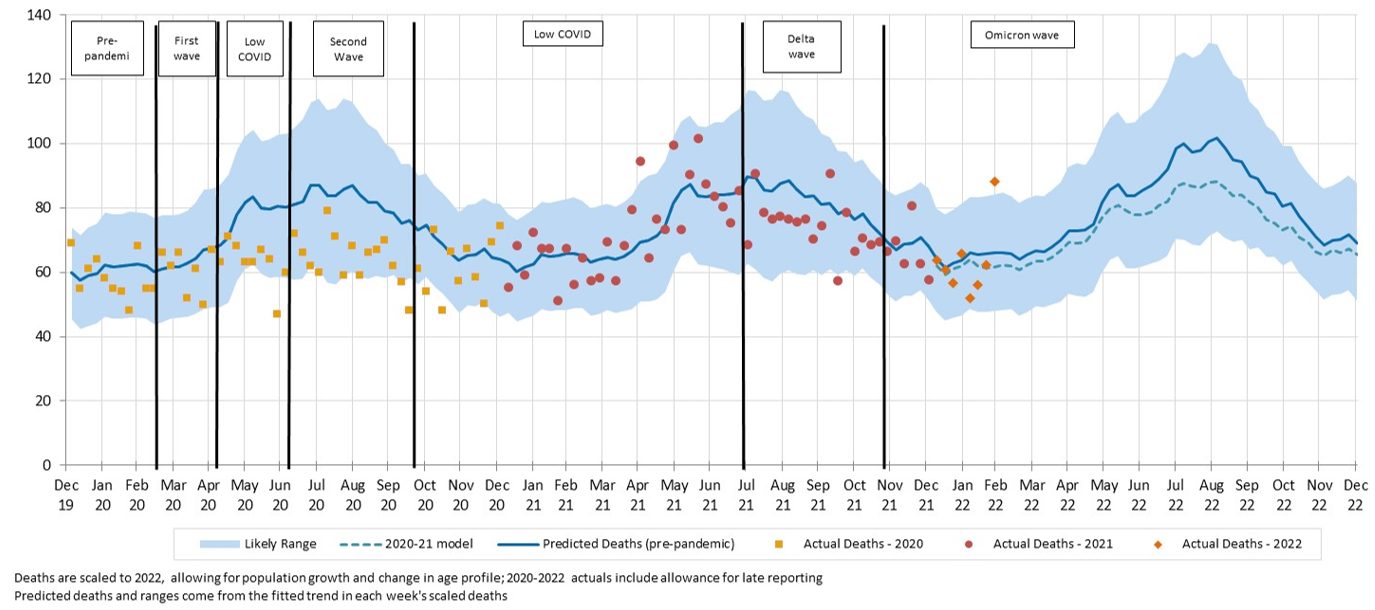
Figure 20 – Weekly actual and predicted coroner-referred deaths in Australia – all causes
Coroner referred deaths were close to predicted for most weeks of 2022 after generally being above predicted in 2021.
|
Members of the COVID-19 Mortality Working Group:
|
CPD: Actuaries Institute Members can claim two CPD points for every hour of reading articles on Actuaries Digital.


