


63 Years of Australian investment performance to 30 June 2022
In this article, Colin Grenfell provides some observations drawn from the Australian Investment Performance Paper that will be presented later this year at the 2023 International Congress of Actuaries (‘ICA’) in Sydney in May.
Every two to four years, since 2005, the Institute has published papers prepared by Colin on Australian investment performance. These papers are discussed at Institute conferences, Insights Sessions and ICAs. Each of these papers tabulates and summarises annual average investment performance statistics for:
(a) risk margins over 10-year bond rates,
(b) coefficients of variation,
(c) skewness and kurtosis, and
(d) cross and auto-correlations.
From these results, assumptions are developed for the mean, standard deviation, skewness, kurtosis, cross and auto-correlations for each “sector”. The assumptions are intended for both medium-term (3 to 10 years) and long-term (10 to 100 years) modelling. The latest assumptions are primarily designed for use until about 2025 in stochastic investment and asset-liability modelling.
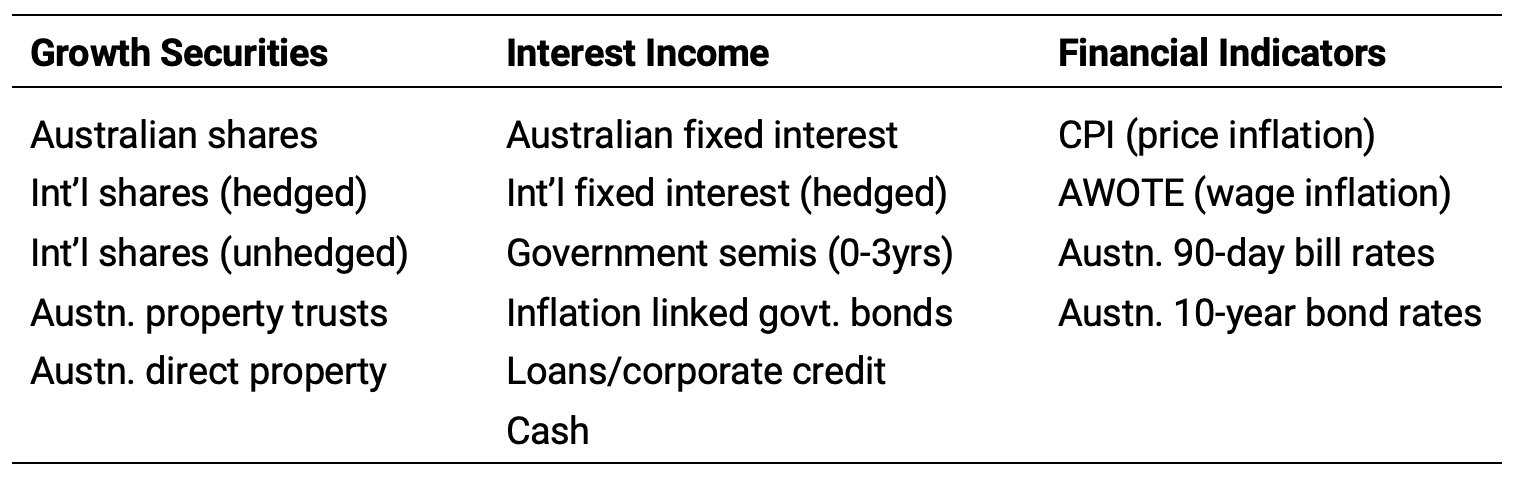
The analyses span 15 sectors covering 11 asset classes and 4 key financial indicators:
The latest analysis – Australian Investment Performance 1959 to 2022 (and Investment Assumptions for Stochastic Models) – will be presented at ICA 2023 in the form of a short video with a link to the 88-page supporting paper.
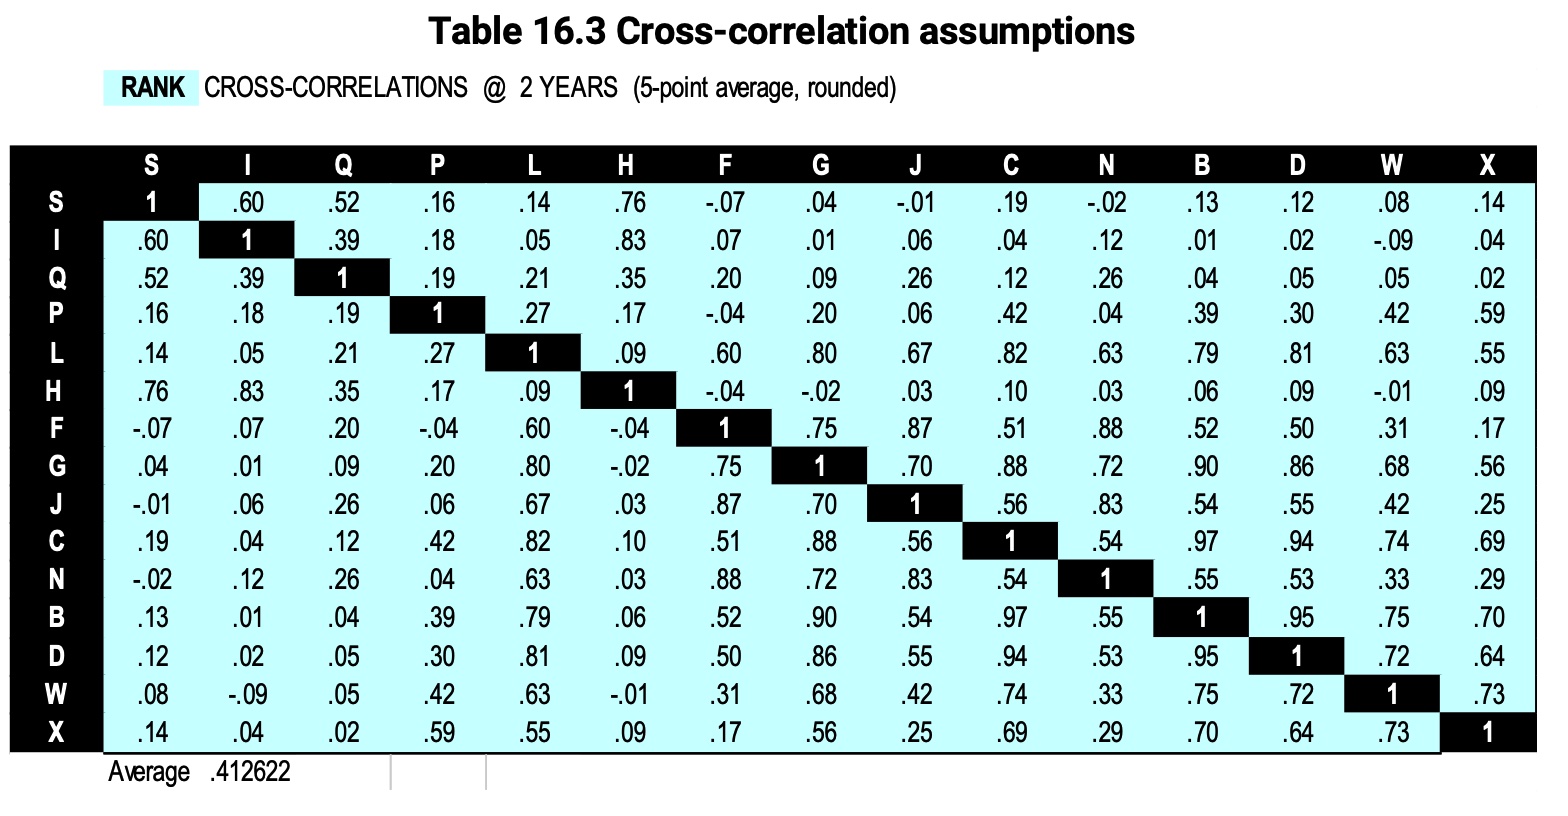
By fitting double and single sine curves to past historical annual forces, “n-year” economic cycles are identified. The methodology for determining assumptions then seeks to determine a best estimate of the n-year first, second, third and fourth moments ending two years after the end of the data period. The one methodology is used, with only slight variations, for calculating assumptions for risk margins, standard deviations, skewness, kurtosis and cross and auto-correlations. The methodology involves six steps. The main resultant assumptions (before tax and fees) are set out below in Tables 16.1 and 16.3.
Table 16.1 Investment assumptions
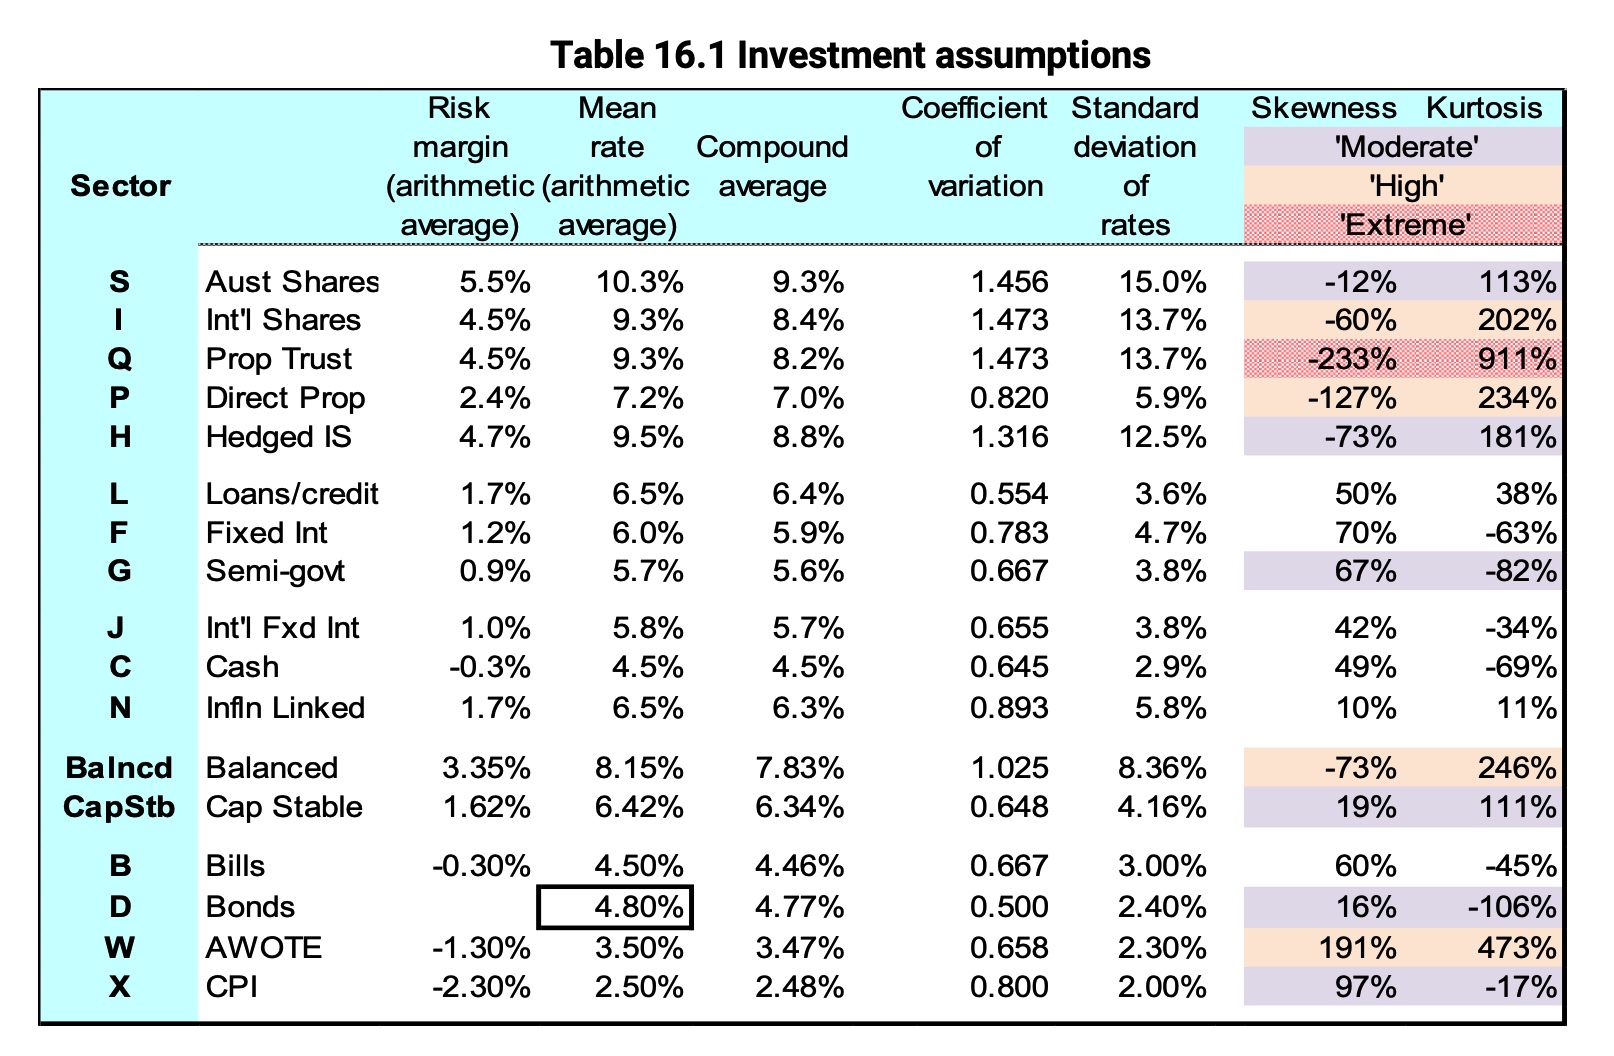
Table 16.3 Cross-correlation assumptions
The paper emphasises that wherever possible, it is desirable for the setting of long-term assumptions to analyse results over at least one full economic cycle and explains why 46‑year periods were considered suitable for this purpose. Other observations (from section 20.5 of the paper) include:
- When setting long-term investment assumptions, there are strong reasons for expressing investment returns as a margin (or “risk margin”) over bond rates rather than as margins over CPI or AWOTE. The CPI has significantly higher coefficients of variation and generally higher standard deviations than bond rates. This makes it more difficult to determine reliable real returns (vis-a-vis bond risk margins). Also, the correlations of sector returns against bond rates are usually higher than the correlations against CPI.
- Care is needed when using running averages. This is because their trends are impacted by both new data being introduced each year and the old data dropping off. For skewness and kurtosis, “phasing” was introduced to address this difficulty. The old data dropping off was phased over 5 years.
- For ‘Balanced’ portfolios, the financial impact of the coronavirus global pandemic during 2020-2022 was far less severe than that of the 2007 Global Financial Crisis.
- For ‘Balanced’ portfolios the impact of the 2007 Global Financial Crisis was not an isolated event. The proportional falls in unit prices in 2007, and the subsequent initial years of recovery, were very similar to those experienced during and following the 1973-74 ‘oil shock’ market crash.
- For many sectors the skewness and/or kurtosis assumptions are either significantly negative or significantly positive. This sounds a warning for those who use normal or lognormal models in relation to investment performance (refer Skewness and Kurtosis of Australian Investment Performance).
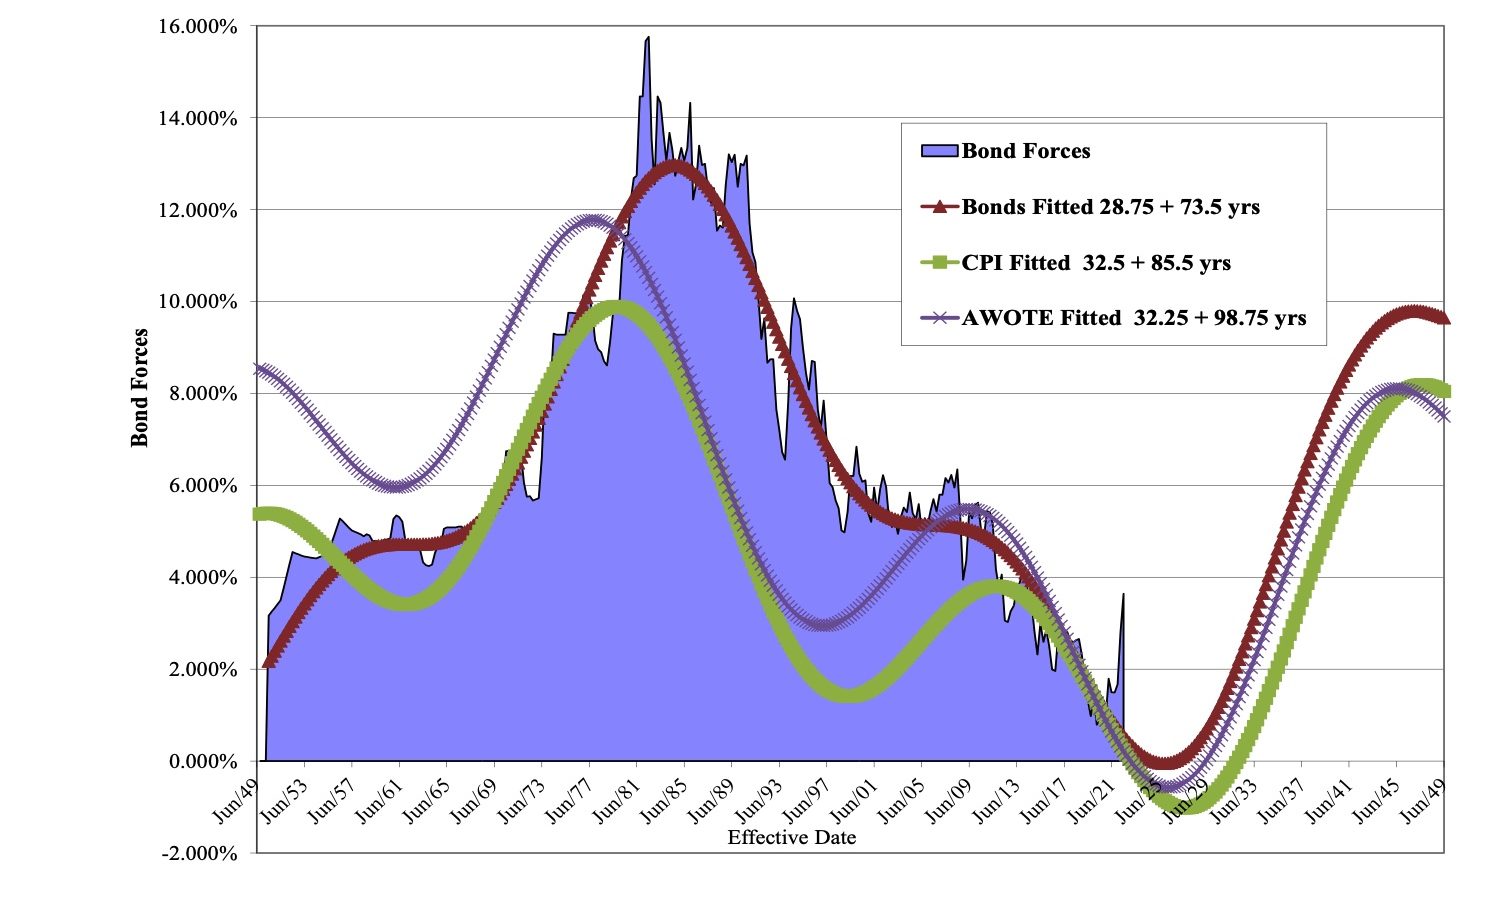
- Although historically rates of AWOTE and CPI have had significantly different turning points from bond rates, projections based on double sine curves show that turning points in future may coincide for all three rates, with the next minima for all three of these being between December 2025 and September 2027 (refer Figure 14.1 below).
- Up to a lag of 5.5 years, all four equity (i.e. “share”) sectors have a much higher frequency of negative than positive auto-correlations. This illustrates the tendency for market prices to “bounce back” after falls and/or to “drop again” after price increases – somewhat similar, but different, to mean reversion.
- For Australian shares, there is significant stability in the S sector auto-correlations over the entire 63-year period examined.
Figure 14.1 Bond, CPI and AWOTE – double cycles
CPD: Actuaries Institute Members can claim two CPD points for every hour of reading articles on Actuaries Digital.


