


Significance of Negative Investment Auto-correlations
In the second of three articles written by Colin Grenfell and Cary Helenius, the authors illustrate the significance of negative share market investment auto-correlations and highlight the importance of including auto-correlations in investment modelling and simulations.
The negative auto-correlations are a robust statistical feature observed in over 60 years of historical share market performance data that impact the expected pattern of future investment returns. The negative auto-correlations observed in the early lag periods contrast to some other investment markets (e.g., fixed interest) where stronger positive auto-correlations are observed. Negative auto-correlations in investment markets can significantly impact:
- the duration of cumulative negative or cumulative positive investment performance, and
- the means, standard deviations, percentiles and confidence intervals of projected investment outcomes over the first 20 years of 40-year projections.
We have used the actual investment data, and simulations, to analyse the investment performance data and the impact of negative auto-correlations:
- confirming that the quarterly investment data also contains the negative auto-correlations that were previously found in the annual data
- examining the impact of negative share market auto-correlations on the duration of cumulative periods of negative investment returns by
- comparing share investment data with fixed interest investment data, and
- comparing the actual share investment data to a ‘randomly sorted’ dataset
- and using the Austmod simulation model to run comparisons on 40-year projections.
How auto-correlations impact investment and data projections
As previously noted, the negative auto-correlations are similar but different to “reversion to the mean”. The presence of the negative share investment auto-correlations for lags under five and a half years does indicate that performance trends in investment markets tend to weaken or reverse over this period, whereas positive auto-correlations suggest that trends in investment performance tend to be maintained for these periods.
The difference is in the “path being taken”, with negative auto-correlations having a statistically significant pattern of “regular” changes in earnings momentum (i.e., more predictable twists and turns) to move the results above or below the mean compared to positive auto-correlations tending to continue their trend above or below the mean before randomly changing direction and then maintaining the new course for an extended period. Random results can also show reversion to the mean but do not have a statistically significant pattern in moving above or below the mean.
Negative auto-correlations in quarterly Australian share investment data
Table 1: Quarterly auto-correlations from September 1963 to September 2023
(Averages for the results in the quarters commencing September, December, March and June)
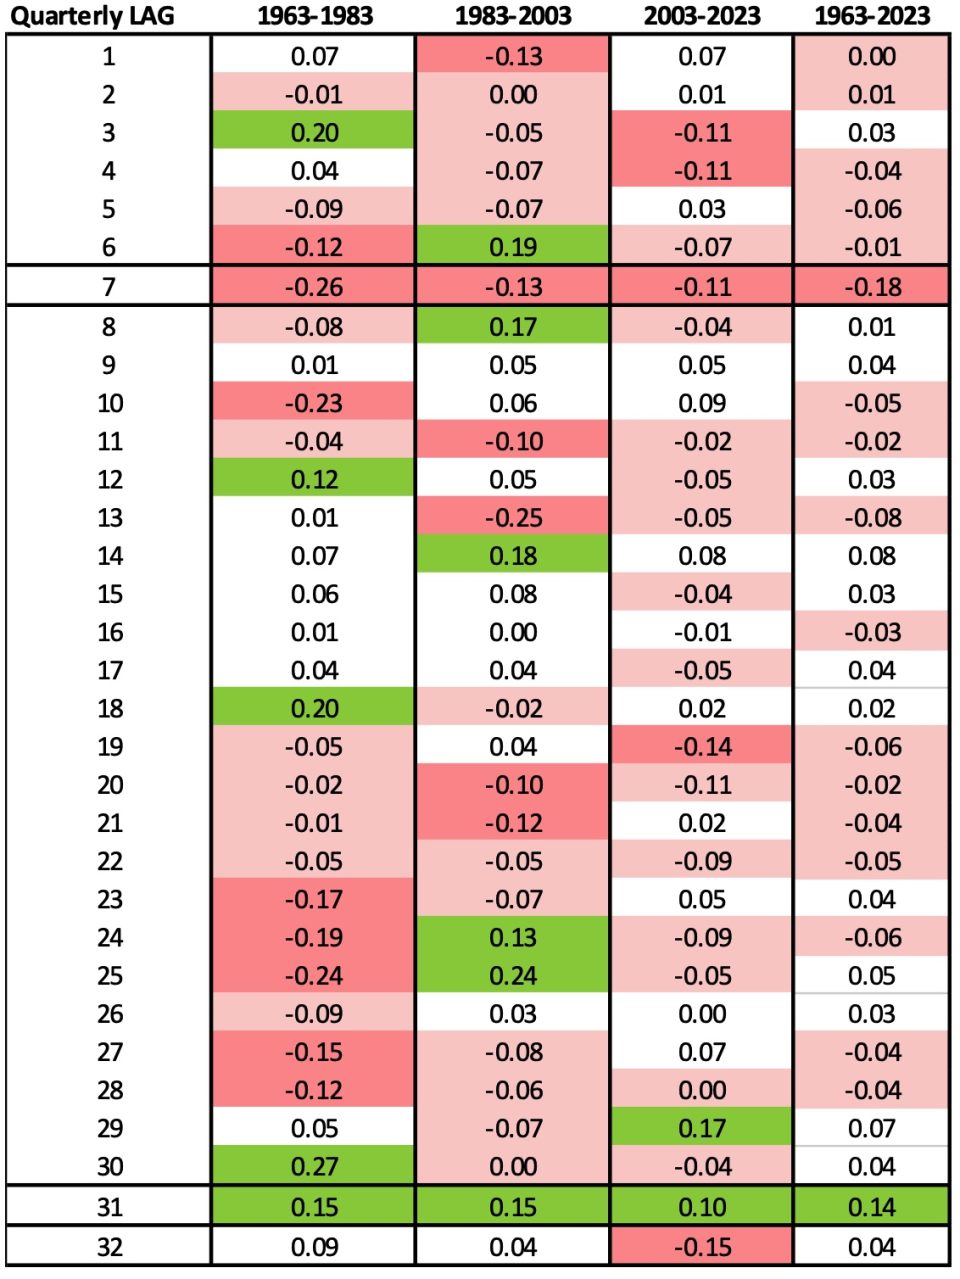
Table 1 highlights the number of negative auto-correlations consistently observed in the quarterly data, with lags up to 32 quarters. In particular, there is a consistent feature of a relatively large negative auto-correlation that occurs at a 7-quarter lag that featured consistently across all the time periods that were analysed.
A consistent positive auto-correlation also appears at the 31st quarter lag consistent with the 8-year positive auto-correlation observed in the previous article.
Negative auto-correlations are widespread in the data for quarterly lags of less than 30 quarters.
Comparison of share data to fixed interest
The presence of auto-correlations in the investment data has important implications for both sustained positive and sustained negative investment performance and hence important implications when considering the appropriateness of various investment mixes to support accumulation and decumulation of superannuation funds.
Table 2: Annual investment performance from 1963 to 2023
(Longest number of years of cumulative negative performance)
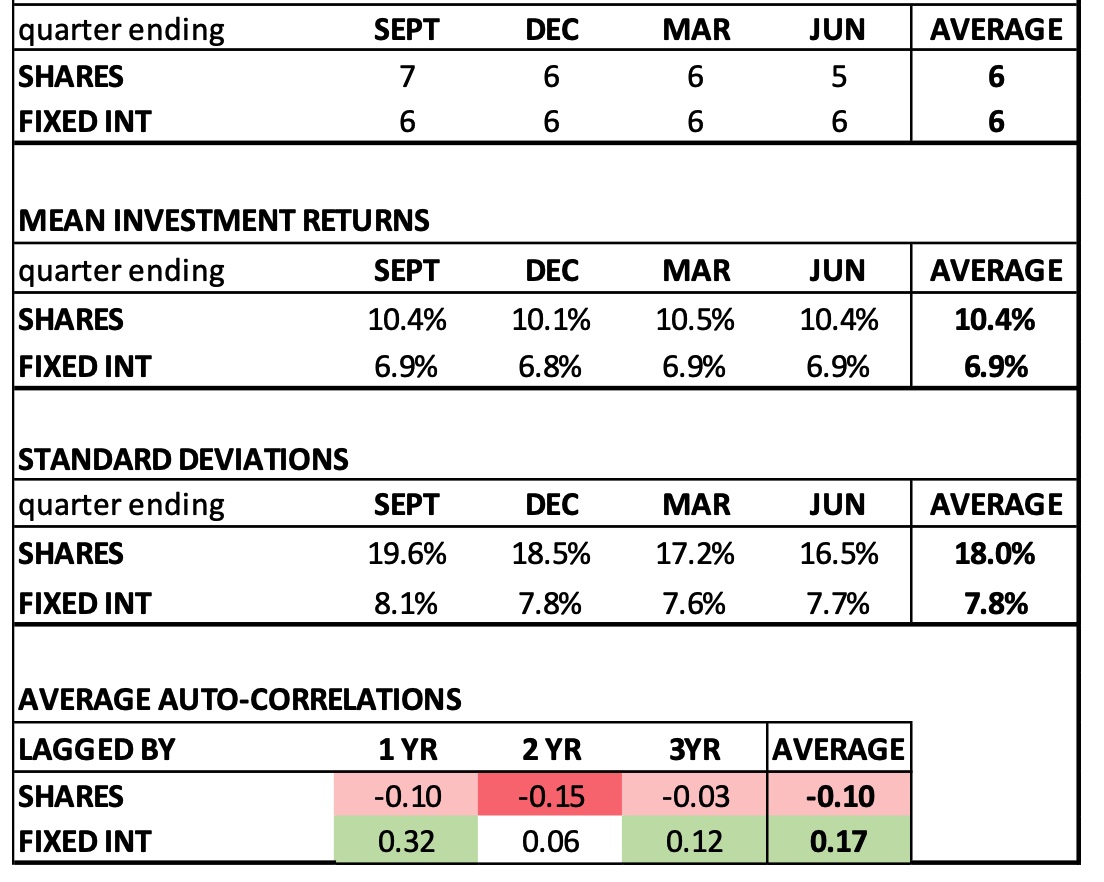
The data in Table 2 highlights the number of years of cumulative negative performance that are observed for the Australian share and fixed interest markets, using the actual 60 years of historical data, for each of the quarter ends, up to and including 30 September 2023. It also shows the average annual investment returns and standard deviations. The auto-correlations are the average results across the four quarter ends and demonstrate that fixed interest tends to exhibit positive autocorrelations compared to the negative autocorrelations observed in the share data.
Overall, the number of years of cumulative negative performance is similar for the share and fixed-interest markets. It is interesting to note that for the 60 years ending in June 2023, that shares had a lower period of cumulative decline (five years) compared to the fixed interest market (six years).
The similarity of the share and fixed interest results is somewhat surprising given the higher volatility of share returns, reflected in the much higher observed standard deviations, and it tends to go somewhat against the argument that shares present a higher risk to investors than fixed-interest.
Whilst not immediately obvious, the answer can be attributed to the share market negative auto-correlations observed for the shorter lags. Specifically, in the absence of these negative auto-correlations, the share market would have far longer periods of cumulative negative performance compared to fixed interest investments.
Actual share data vs. randomised share data
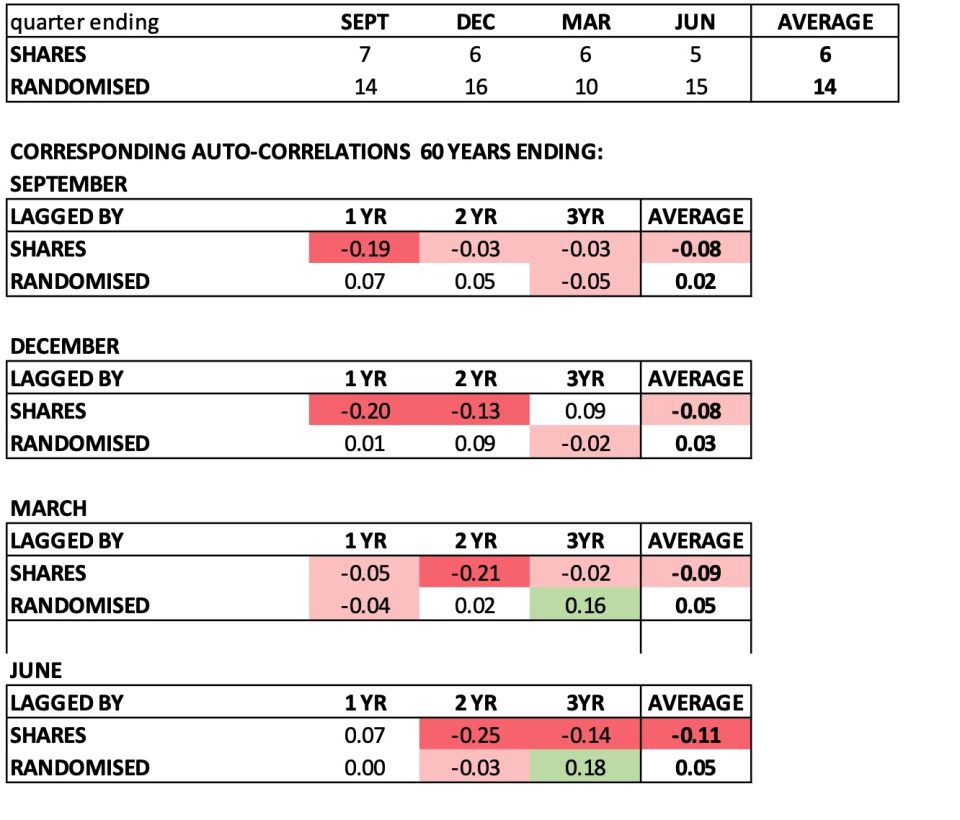
Table 3 is based on the actual historical data for the Australian share market over the 60 years to 30 September 2023 at various quarterly ends (similar to Table 2). The share market has had negative auto-correlations for lags up to three and a half years. Table 3 compares the actual data to an identical set of investment data points which have been randomly sorted to produce non-significant negative auto correlations for lags up to 3 years. Both data sets have the same mean and standard deviation as shown for shares in Table 2 (and the same skewness and kurtosis). This process clearly shows that when the impact of negative auto-correlations is removed from share performance data it significantly lengthens the periods of cumulative negative performance from an average of 6 years to almost 14 years in this example.
These observed results highlight the importance of having simulation models, such as the Austmod model, that incorporate the observed negative auto-correlations (or extrapolated trend results from the observed data). If the auto-correlations are ignored there is a risk that simulations will produce results that are inconsistent with features observed in historical investment performance and resulting in potentially misleading outcomes.
Table 3: Longest number of years of cumulative negative performance
Austmod simulation analysis
To provide some further insight, and to reconfirm these observations, we undertook an analysis by running simulations using the Austmod model.
Methodology
In the analysis, we ran 1,000 simulations to compare datasets using the same investment output in two runs, one which targeted an auto-correlation profile as outlined in Appendix B of Colin’s ICA 2023 Paper, and the other with unspecified random auto-correlation.
We used the 40-year projection mode, with no allowance for fees or taxes. Each simulation projected a $10,000 initial investment using a 100% asset allocation to Australian shares to produce annual projected amounts for each of the 40 years.
The output provided a total of 1,000 simulations and 1,000 comparisons. We limited the runs by only including those that had a negative auto-correlation that summed to at least -0.2 in the first 3 years, leaving 467 simulations to analyse.
Each of the individual 467 investment scenarios had different mean returns and standard deviations, but importantly, each had an identical comparison dataset with exactly the same investment performance data. In aggregate for the 40th year of the projections the 467 targeted runs and comparison runs had the same means, standard deviations, skewness and kurtosis but only differed in auto-correlation characteristics.
Results
In our simulations, this impact of the negative auto-correlations can only be observed to around the 20-year mark of the projections, because both the targeted and the comparison data sets were forced to become equal by the 40th year.
Chart 1 shows the material percentage difference in the means for the “with negative auto-correlation” run to the “comparison” run. This is clearly observed up to year 20, after which both runs come back into agreement by year 40.
Chart 1: Comparison of simulated means with and without negative autocorrelations
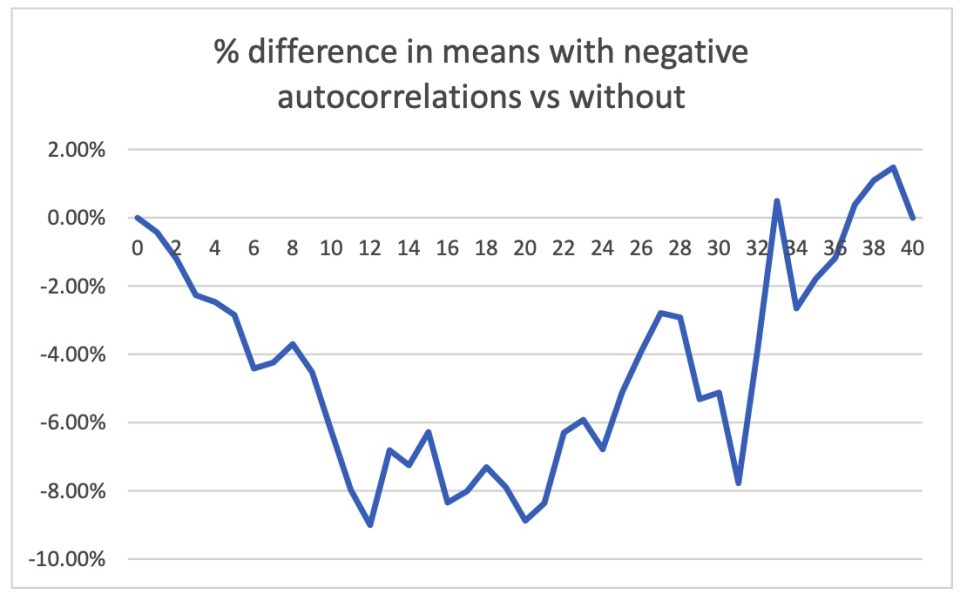
Table 4 shows the differences in negative auto-correlations on percentile ranges, means and standard deviations for the aggregate results of the 467 targeted simulations compared to the comparison runs in 5-year intervals up to year 20 of the projections:
Table 4: Austmod simulation data summary table – Percentage difference in percentiles for neg-auto vs. comparison projected benefits
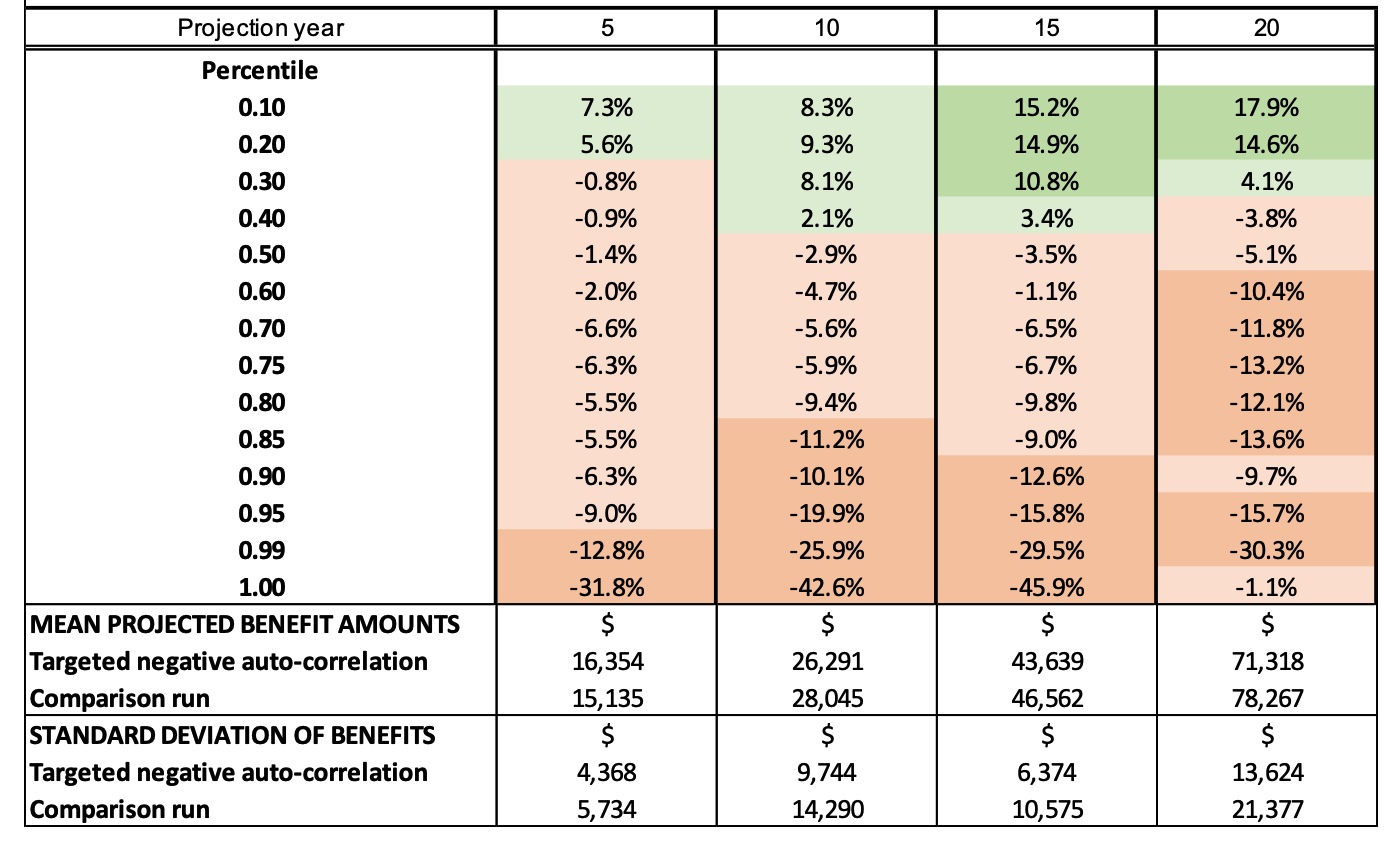
The results highlight that the presence of negative auto-correlations in the simulation significantly changed the percentile ranges with increases in percentile ranges highlighted in green and significantly reduced the percentile values (from about the 60th to 100th percentile) highlighted in orange.
The means for the benefit projections are lower than the comparisons in all but year 5 for the targeted negative auto-correlation runs, and the standard deviations are lower in each case. This has significant implications in determining confidence intervals based on the projection output for any time frame prior to the final year of projection.
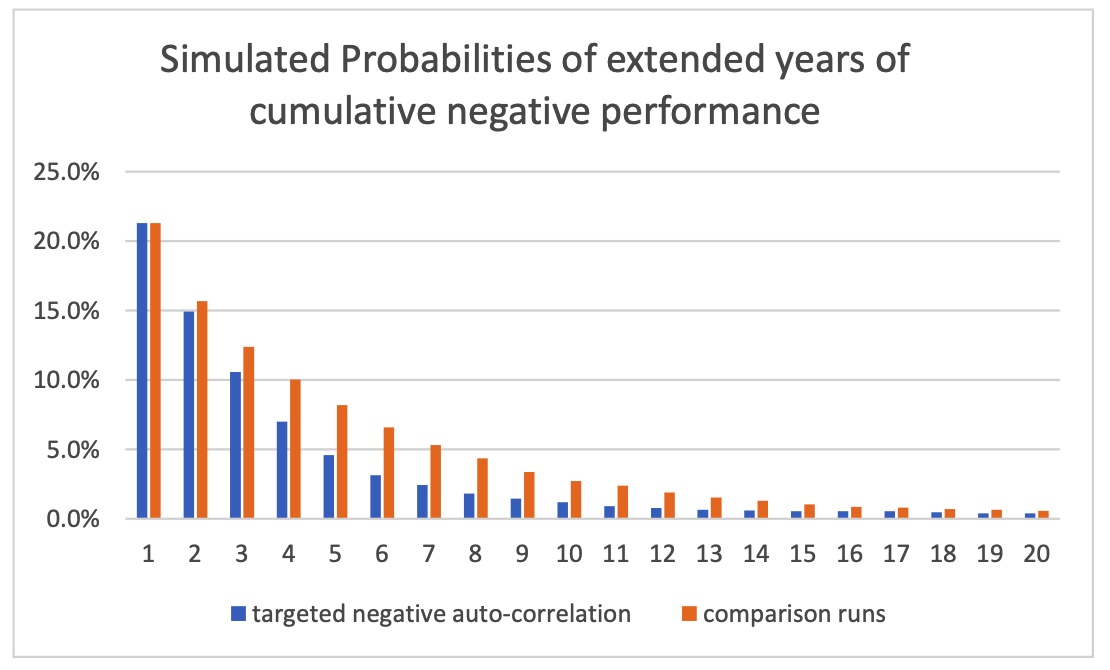
In Chart 2 below, we compare the accumulated negative performance periods for the two datasets and the trends are very clearly observed in the periods up to the 20-year point of the projection.
Consistent with the actual Australian share market performance, the probabilities of extended runs of cumulative negative investment performance were higher when the short-term negative auto-correlation was ignored.
Chart 2: Simulated probabilities of extended years of cumulative negative performance
Implications
We believe it is critical for auto-correlations to be included in investment projection models in determining potential investment performance, or otherwise results produced can potentially be quite misleading.
These results suggest that negative auto-correlations should be incorporated in investment modelling to avoid potentially misleading outcomes in areas such as;
- solvency projections,
- asset liability modelling,
- investment asset allocations, and
- assessment of investment product profitability signatures.
Further work
The Austmod model is also capable of 100-year projections and this methodology could be adopted to illustrate the potential differences in outcomes for periods of (say) up to 50 years.
CPD: Actuaries Institute Members can claim two CPD points for every hour of reading articles on Actuaries Digital.


