


Account-based pension drawdown patterns
The Retirement Income Covenant Explanatory Memorandum suggests that trustees should consider assisting members with ‘specific drawdown patterns that provide higher incomes throughout retirement’. For this, Colin Grenfell suggests an alternative account-based pension drawdown pattern, and tests this using historical investment performance.
As set out in the Explanatory Memorandum, a trustee’s retirement income strategy may include providing a range of assistance to beneficiaries, such as:
- developing and/or offering specific retirement income products;
- developing specific drawdown patterns that provide higher incomes throughout retirement;
- providing budgeting tools or expenditure calculators to identify income and capital needs over time;
- providing factual information about key retirement topics, such as eligibility for the Age Pension or aged care, the concept of drawing down capital as a form of income, or the different types of income streams available; and
- providing forecasts to beneficiaries during the accumulation phase about potential income in retirement through superannuation calculators or retirement estimates.
This article focuses on the second bullet point above, but aspects of it are also relevant to the other four dot-points.
Many funds already provide a minimum account-based pension product for retiring members. However, an account-based pension providing just the minimum drawdown does not, when used alone, satisfy the Retirement Income Covenant requirements. An account-based pension based on the Minimum Drawdown rules involves sudden increases in retirement income at ages 75, 80, 85, 90 and 95 and hence comes with an element of instability in expected retirement income. As illustrated later in this article, the minimum drawdown can also potentially, and perhaps unintentionally, delay consumption.
Better than the minimum
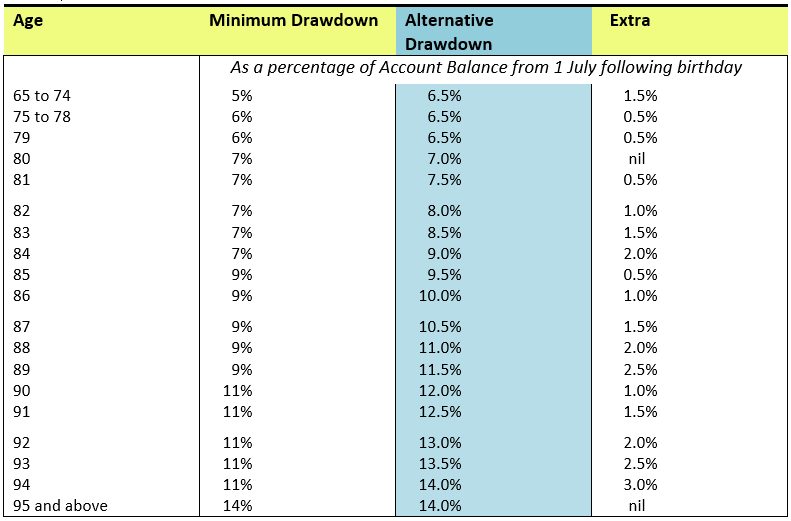
To improve payments in the early years, often associated with ‘active’ retirement, and to give a smoother payment pattern in later years, the balance of this article will be based on the ‘alternative’ payments shaded blue in Table 1 below. Until age 95, the alternative drawdown also provides some flexibility to reduce drawdowns at any time, to the minimum level, without adverse tax consequences.
Compared with the Institute’s Draw your decennial age ‘rule of thumb’, the ‘alternative’ payments commence at a higher level (based on a 6.5% drawdown rather than 6%). Also, the ‘rule of thumb’ follows the ‘minimum drawdown’ jagged path after age 79. Importantly, the Institute noted that spending your ‘decennial age’ was a crude measure in the absence of financial advice, and this warning also applies to the ‘alternative’.
Table 1
What are the consequences?
There are no free lunches with investing – the higher early year drawdowns with the alternative will mean lower drawdowns in later years. Will these lower drawdowns be significant? To partially answer this, Chart 1 below illustrates account-based pension drawdowns (deflated for inflation) for a retiree aged 67 with an initial account balance of $1,000,000. Chart 1 is based on the fixed real return of 3% per annum specified in the Australian Securities and Investments Commission’s Class Order 11/1227 and does not include allowance for the Age Pension.
Chart 1
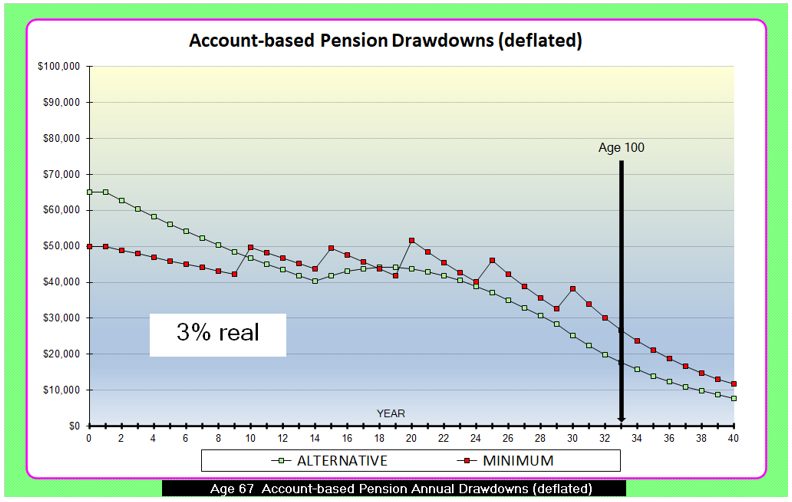
The above illustration assumes a fixed real return for the period after retirement. This does not consider the intended asset allocation of the member, or whether 3% pa above wage or price inflation (net of investment fees and costs and net of investment tax) is a realistic return.
Testing with historical data
A more realistic comparison of the two drawdown patterns is possible by using historical investment performance data and historical information about Average Weekly Ordinary Times Earnings (AWOTE) and Consumer Prices Indices (CPI). Of course, it must always be kept in mind that the past is not necessarily representative of the future.
Chart 2 below uses the Austmod historical investment performance and financial data described in Sections 3 and 4 of my August 2021 Actuaries Institute paper Australian Investment Performance 1959 to 2021 (and Investment Assumptions for Stochastic Models). This data is similar to the Australian Prudential Regulation Authority Heatmap benchmarks but extends back to 30 June 1959 at quarterly intervals. The data used in this article is that for a typical balanced portfolio with 70% growth securities and is before tax, before imputation credits and before fees. For a pension portfolio, this is marginally conservative because the impact of imputation credits usually exceeds the impact of fees.
The database is currently updated to 31 December 2021. This means that there are 245 possible return paths with quarterly start dates between 30 June 1959 and 31 December 2020, with potential durations ranging from 62 years to one year. A difference in the start date of only one quarter can make a significant difference to account-based pension outcomes over say the next 40 years.
Chart 2
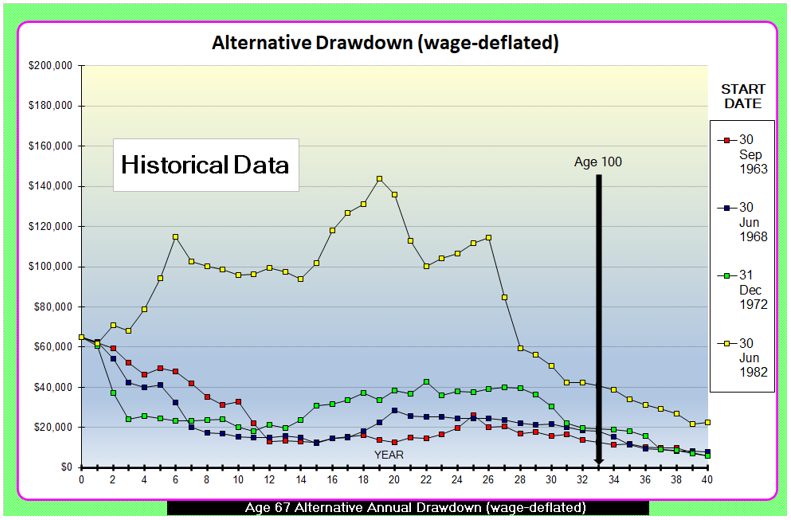
The above chart includes four return paths that comprise the lowest and highest drawdowns:
- the return path starting 30 June 1982 produces the highest drawdowns (out of the 245 possibilities) at all durations apart from a few minor exceptions; and
- another three return paths as shown form the lowest drawdowns at various points in the chart – the 31 December 1972 start date is an example of extreme sequencing risk.
The drawdowns in Chart 2 (and Chart 3 below) are ‘wage-deflated’ based on historical AWOTE annual increases. This approach is intended to reflect both price increases and general community standard of living increases (based on a full-time working standard of living). Hence a straight horizontal line on these charts indicates a drawdown that exactly keeps pace with price increases and standard of living increases. This sets a challenging benchmark that would be appropriate for any retiree, myself included, who wants to continue, until death, with a living standard commensurate with that enjoyed by their children and grandchildren.
Historical investment returns fluctuate
Chart 3 below includes a wider choice of 19 return paths, evenly distributed by start date across the Austmod range, except for four slight adjustments to ensure that the boundary return paths in Chart 2 are again included.
Chart 3
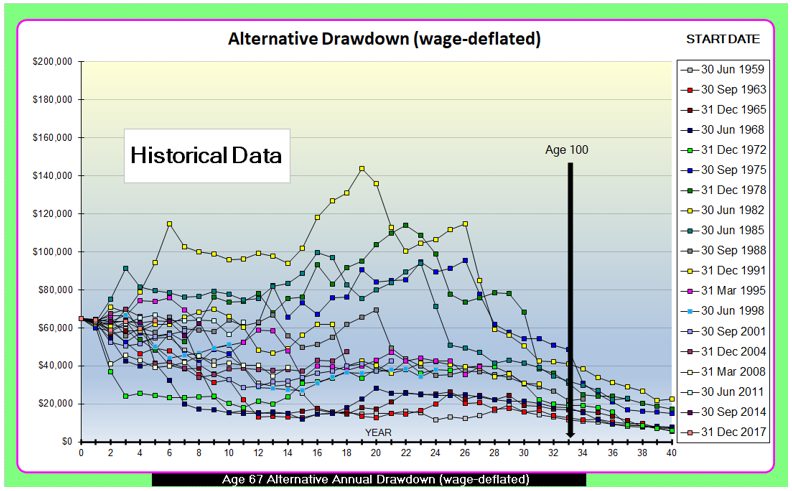
There are eleven return paths in Chart 3 that commence after 1982. For these return paths, there are less than 40 years remaining until 31 December 2021, so results are shown for just the shorter period to 31 December 2021. Probably not surprisingly, the chart illustrates a wide distribution of results.
‘Alternative’ versus ‘minimum’ historical results
In 2019 the Institute wrote to software firms used by financial planners. The worked examples in the Institute letter indicate that:
- ‘Age 100’ (i.e. 65 + 35) might be an appropriate planning horizon if allowance is made for ‘25 year’ improvements, for a married couple to be 80% confident that their income will last until the ‘second death’.
Based on this conclusion, the next table illustrates the distributions of ‘alternative’ and ‘minimum’ drawdowns at a range of ages up to 100. Results are shown for both wage and price-based deflators.
At the higher ages, we expect the alternative drawdowns to be less than minimum drawdowns because of the higher drawdowns at younger ages, in particular prior to age 75. To gauge whether these lower drawdowns will be significant, the important situations will be those with below-median outcomes. If the outcomes are above the median, the lower alternative drawdowns will not be of much concern. For this reason, Table 2 below only includes start dates which result in outcomes BELOW the median drawdowns for the nineteen start dates in Chart 2.
Table 2
Average annual drawdowns – BELOW median outcomes
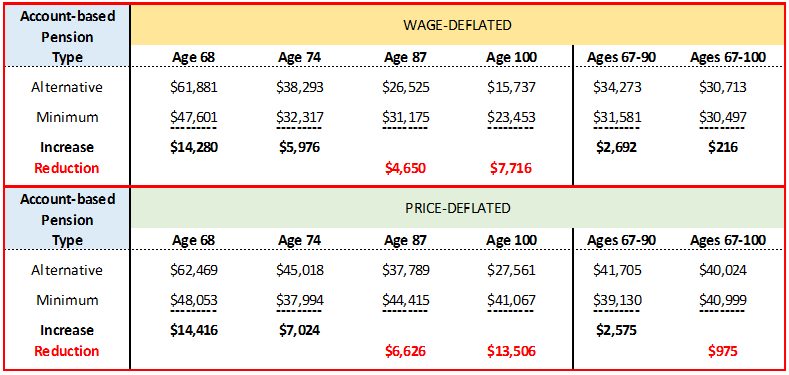
Note the very different historical results between wage and price deflation particularly at age 100. This is primarily due to the fact that over the 62 years from 1959 to 2021, AWOTE increases averaged 6.5% p.a. but CPI increases averaged only 4.6% p.a.
Conclusion
The alternative drawdown design has a number of advantages over minimum drawdowns:
- Importantly, higher drawdowns during the initial ‘active’ early years of retirement
- Smoother drawdowns from year-to-year prior to age 95 because the sudden five-yearly increases in minimum drawdowns are avoided
- Until age 95 the alternative drawdown provides some flexibility to reduce drawdowns at any time, to the minimum level
- The historical analysis shows that while both types of account-based pensions can produce poor outcomes when real returns are below the median, the alternative has provided higher average incomes throughout retirement until age 90, and sometimes until age 100
- If allowance were made for means-tested Age Pension entitlements, the below-median outcome results for alternative drawdowns would appear more favourable because the alternative account balances are lower at older ages.
However, there are ‘no free lunches’ – Chart 1 clearly shows that minimum account-based pension drawdowns are more level over the full period of retirement.
CPD: Actuaries Institute Members can claim two CPD points for every hour of reading articles on Actuaries Digital.


