


Appropriate Indexation of Retirement Income
This article explores how retirement spending may change for individuals as they progress through retirement, and the impact of choosing an appropriate level of indexation on their retirement income could have on their required level of retirement savings.
One of the fundamental elements that is often overlooked when helping individuals plan for their retirement is an appropriate indexation of their retirement income.
In this article, I assume that retirement income is only required to maintain a level of spending in retirement. Therefore, the appropriate level and indexation of income should closely relate to the required level of spending in retirement.
Retirement spending is likely to differ from one individual or couple to another, depending on their lifestyle in the years leading up to retirement and how their spending evolves as they journey through retirement.
The initial level of retirement spending can be predicted using an income replacement ratio or retirement standards, such as those published by ASFA. In my experience, there have been many discussions on an appropriate method to determine an initial level of spending. However, there has been very little discussion about how retirement spending may change as individuals progress through the active, passive and frail stages of retirement. I believe this is an equally important consideration when it comes to retirement planning as it could have a significant impact on the level of savings required at the point of retirement.
Defining retirement spending categories
To understand how spending may change in retirement, let’s first consider categorising spending into different segments, such as:
- Clothing and Appliances
- Eating and Drinking Out
- Grocery and Food
- Health
- Housing Expenses (excluding rent and mortgage)
- Leisure and Entertainment
- Other
- Cash withdrawals
- Transportation
- Travel
- Utilities and Finance
It is essential to acknowledge that the amount a person allocates to each category at the onset of retirement is likely to change as they progress throughout their retirement years.
The evolution in spending may be influenced by the various stages in retirement: active, passive and fragile.
During the active phase, individuals may allocate a larger proportion of their expenses to travel, transportation, and leisure activities, which may decrease as they age. Conversely, certain expenses, such as healthcare, may increase as they grow older.
When assisting individuals to understand how their retirement spending might change during retirement, it’s crucial to comprehend their initial spending and potential adjustments. One approach is to examine how spending patterns correlate with an individual’s socio-economic status, as this may often reflect retirees’ lifestyle choices and spending tendencies.
Identifying retirement spending patterns
This section considers how spending in retirement varies for different age bands by analysing digital banking spending data from Australian individuals aged 60 and over.
This data was extracted from the Compare My Spend tool on the Spirit Super website.
It is important to note that the data looks at the spending of individuals at a single point in time across multiple age bands and it is not a longitudinal study looking at the spending of a single group of individuals as they progress throughout different ages.
The data is categorised by age bands (60-64, 65-69, 70-74, and 75+) and affluence levels (Low, Mid, Mid-High, and High). The affluence levels are defined based on individual spending on different categories and spending behaviour. This categorisation helps identify any distinct spending patterns that might be visible in the data.
Chart 1: Average retirement spending for different age bands
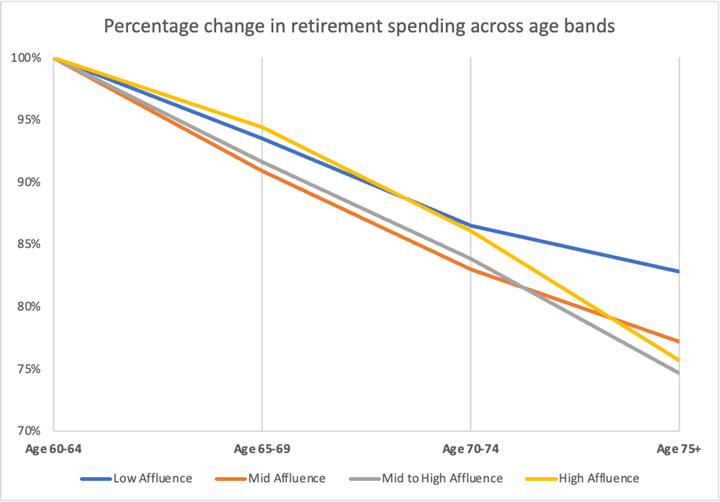
Using the 2022 banking spending data, the above chart looks at the percentage change in retirement spending, using the age 60-64 age band as the base year, and considering the relative decrease in retirement spending for older age bands.
The chart illustrates for all affluence levels there is a consistent reduction in spending across the age bands. In the “low affluence” group, individuals aged 75+ spent approximately 15% less than those aged 60-64. This reduction is even more pronounced for the higher affluent levels, with spending at age 75+ band reducing 20-25% of the spending levels observed at age 60-64.
Chart 2: Average retirement spending by categories for low affluence level across the age bands
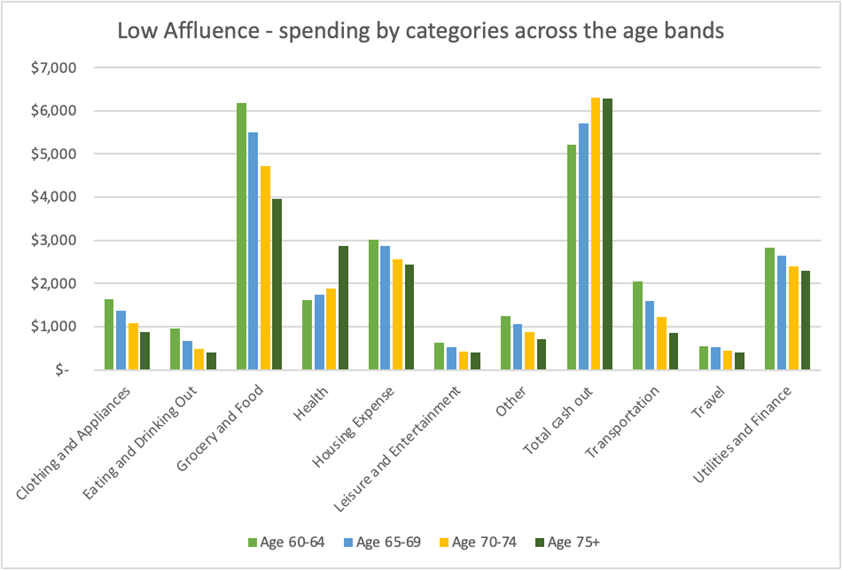
The chart illustrates, for the “low affluence” level, how spending across the categories varies for different age bands.
For the “low affluence” level, spending across most categories gradually decreases across the age bands, with the exception of health-related expenses and cash withdrawals.
Chart 3: Average retirement spending by categories for “high affluence” level across the age bands
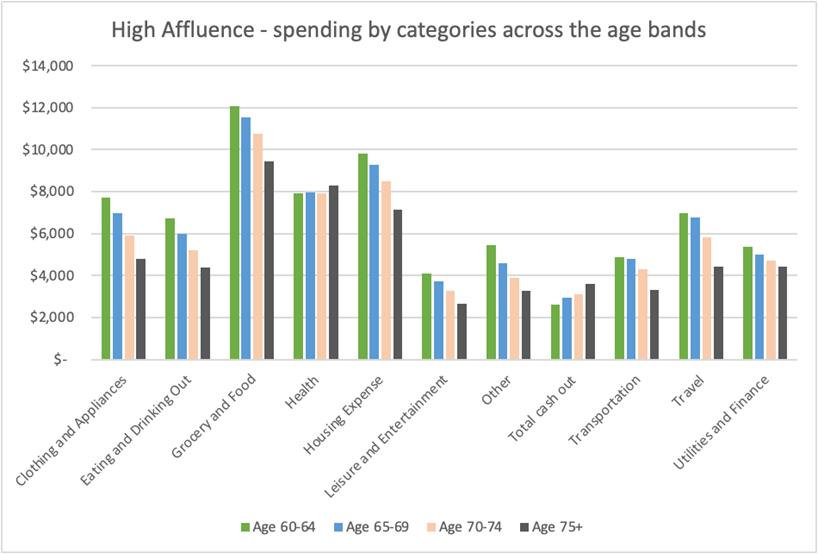
Similarly, for the “high affluence” level, spending across most categories decreases with age, except for health expenses and cash withdrawals, albeit with less significant increases in health expenses compared to the “low affluence” level.
It’s important to note that the banking data comprises all digital transactions and cash withdrawals from bank ATMs, excluding rent and mortgage payments. Therefore, it may not represent a complete picture of retirement spending. Furthermore, this data represents a snapshot in time, not a longitudinal study tracking the spending of the same retirees over time.
Understanding these limitations is crucial when drawing further conclusions. Nevertheless, the data underscores that retirees do not universally experience the same spending patterns in retirement. The income in retirement should reflect the potential spending pattern.
The impact of retirement spending patterns on the adequacy of retirement savings
To highlight the impact of different retirement spending patterns on the adequacy of savings for retirement, I have considered three different scenarios in the chart below by applying a different level of indexation to the initial income to reflect a spending pattern.
Under Scenario 1, the income remains constant in future nominal dollars and under Scenarios 2 and 3, the income is indexed with 2.5% per annum (in line with assumed CPI inflation) and 4% per annum (in line with assumed wage inflation) respectively.
Chart 4: Different retirement spending patterns
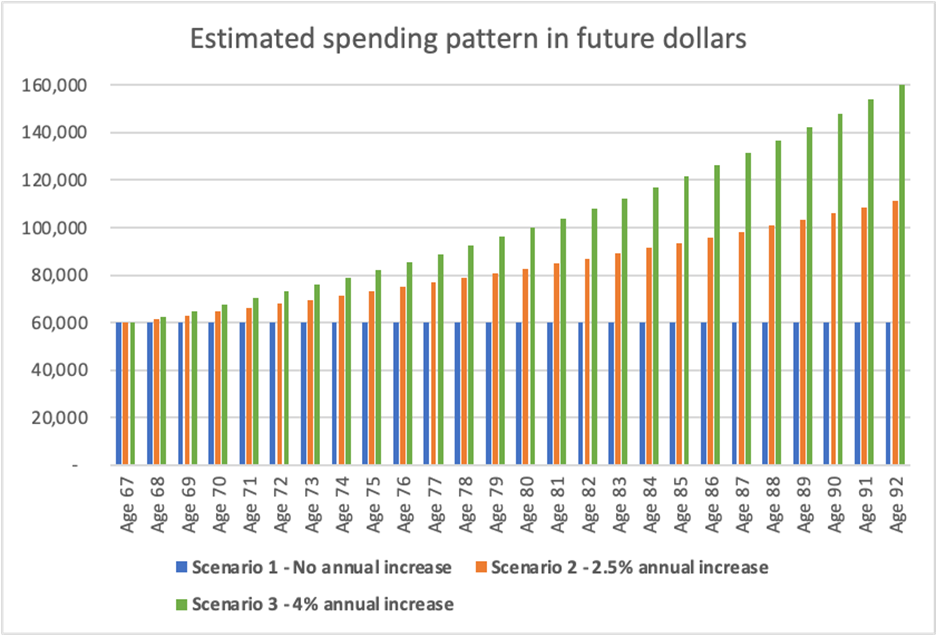
* The chart illustrates the spending pattern in future nominal dollars. In the calculations that follow, the amount of savings required at age 67 to maintain this spending level was calculated by adjusting the deflator in the retirement phase, whilst maintaining wage inflation at 4% per annum in the retirement phase. Age pension is expected to increase with wage inflation in the calculations.
Based on the three different retirement spending patterns, the amount of superannuation savings required at age 67 to maintain the spending pattern from age 67 until age 92 was calculated. The results are shown in the table below.
Chart 5: Savings required by age 67 to fund spending under different retirement spending patterns based on initial $60,000 per annum level
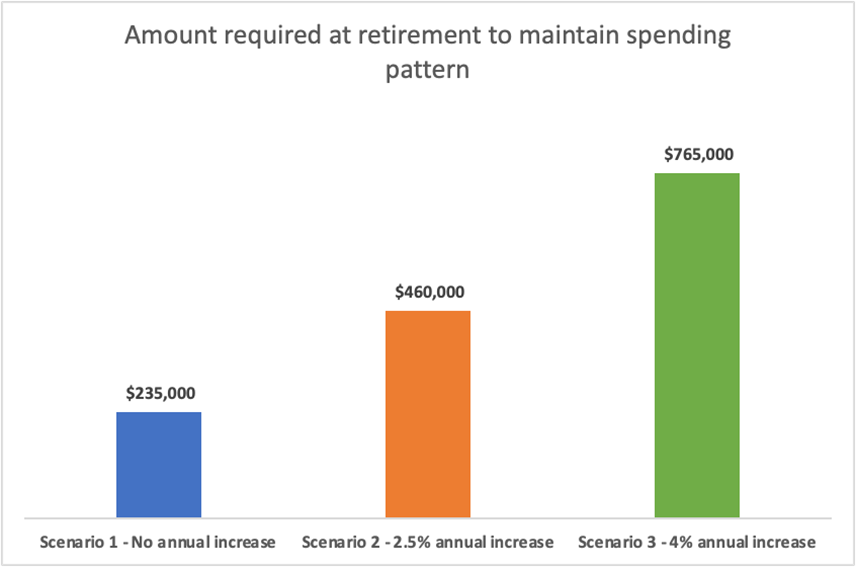
* Investment return in retirement 7% per annum after all fees and taxes. The income stream is expected to continue from age 67 to age 92. Age pension was included in the calculations and is expected to increase with wage inflation (4% per annum) under all scenarios. Age pension calculation is based on a single-person homeowner with financial assets equal to the required balance and pension rates as of 1 March 2023. The deflator in the retirement phase was changed under each scenario to match the chosen indexation rate and convert the balance savings amount required into today’s dollars.
The chart illustrates that, if retirement spending remains constant in nominal terms, $235,000 is needed at age 67 to maintain that spending level until age 92, after allowing for the Age Pension.
Allowing for a 2.5% annual spending increase requires an additional $225,000 in savings at the point of retirement, over a 95% increase in the amount required compared to Scenario 1. Factoring in a 4% annual increase requires a staggering 225% increase in savings at the point of retirement compared to Scenario 1.
This demonstrates how the assumed retirement spending pattern has a significant impact on the amount of savings required at the point of retirement, and practitioners should consider what spending pattern would be more suitable for their clients rather than simply using the default assumptions.
Importance of communication and use of default assumptions
This emphasises the significance of aiding retirees and pre-retirees in planning an appropriate spending pattern in retirement. All calculators and tools must use the default deflator in the retirement phase laid out in the ASIC Regulatory Guide RG276 to qualify for an advice exemption. Therefore, most superannuation calculators assume a 2.5% per annum deflator rate for the retirement phase, equivalent to Scenario 2 in the previous example.
The impact of the deflator and how it should be changed to allow for different spending patterns in retirement may not be a concept readily understood by retirees and pre-retirees or even some professionals.
Therefore, developers of superannuation calculators and tools, and other practitioners assisting retirees should explore effective ways to communicate the impact of different spending patterns and assist users in selecting an appropriate spending pattern tailored to their circumstances.
The path forward
The path to a comfortable and secure retirement is not a one-size-fits-all journey.
As I’ve explored in this article, helping retirees determine an appropriate retirement spending pattern is a complex endeavour that hinges on various factors, including individual spending habits and evolving needs through different stages of retirement.
Understanding how spending at the point of retirement might change in the future is pivotal. The data gleaned from analysing spending patterns among retirees sheds some light on the diverse trajectories one can expect during their retirement years. From the vibrant and active phase to the more subdued stages, expenses ebb and flow, and retirement income estimates should consider these nuances.
Furthermore, the impact of indexation of retirement income when determining the required retirement savings cannot be overstated. Whether one seeks a steady spending pattern or wishes to increase or decrease their spending over time, the assumptions about their spending can significantly influence the nest egg required for a secure retirement.
The sensitivity of the default assumptions used in retirement tools and calculators such as investment earnings and life expectancy are usually communicated to users with the indexation of retirement income, which assumes a particular spending pattern, usually held constant at default rates.
Future investment earnings and longevity are something that retirees have little to no control over, whereas retirees are likely to change their spending as they progress through retirement.
Therefore, considering the potential spending patterns in retirement when selecting an appropriate indexation for retirement income is something that requires further research and should be more carefully considered in retirement planning.
CPD: Actuaries Institute Members can claim two CPD points for every hour of reading articles on Actuaries Digital.


