


Pulling at the threads of causation
Hugh Miller previews his Concurrent presentation at the 2021 Injury & Disability Schemes Virtual Seminar, titled ‘Lost cause: Getting at causation in our datasets’.
A topic that has fascinated me for the past couple of years is that of causation. In the past there have been many times where I’ve modelled an effect and had to add the (correct) disclaimer that ‘correlation is not causation, so we don’t really know what is driving the observed effect’. However, this is often an unsatisfying conclusion for clients who are keenly interested in cause and what to do to change outcomes.
Further, other professions are increasing focusing on causal explanations. In fact, the recently announced 2021 Nobel Prize in Economic Sciences is dedicated to researchers who have pioneered new methods in causal explanations. This means that actuaries can be more actively contributing to these sorts of questions too.
The most rigorous way to estimate cause is through randomised controlled trials (RCTs). These are very effective at removing the impact of extraneous factors and remain the gold standard in many areas of research. However, in many cases RCTs are not practical. Implementation might be a challenge, or there might be insurmountable ethical or fairness issues. In such cases ‘quasi-experimental methods’ can be used to leverage characteristics of the data to derive a plausible causal effect.
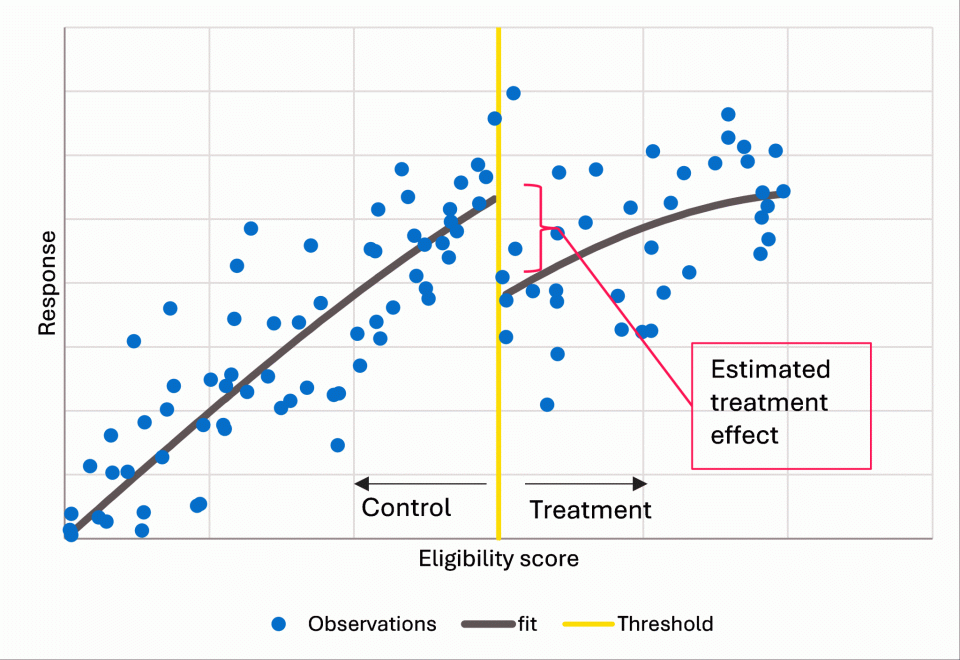
An example of such a technique is regression discontinuity. This is suitable when a threshold exists for a person qualifying for a treatment (for example, an eligibility score for enrolling in a new program). Directly comparing those who do and don’t receive the treatment is inappropriate; selection effects will mean that those qualifying for the program will have different outcomes to those who do not. But we can look at the trend by eligibility score, with a focus on what happens near the threshold. If there is a clear step up for similar people either side of the threshold, this can be regarded as evidence of impact.
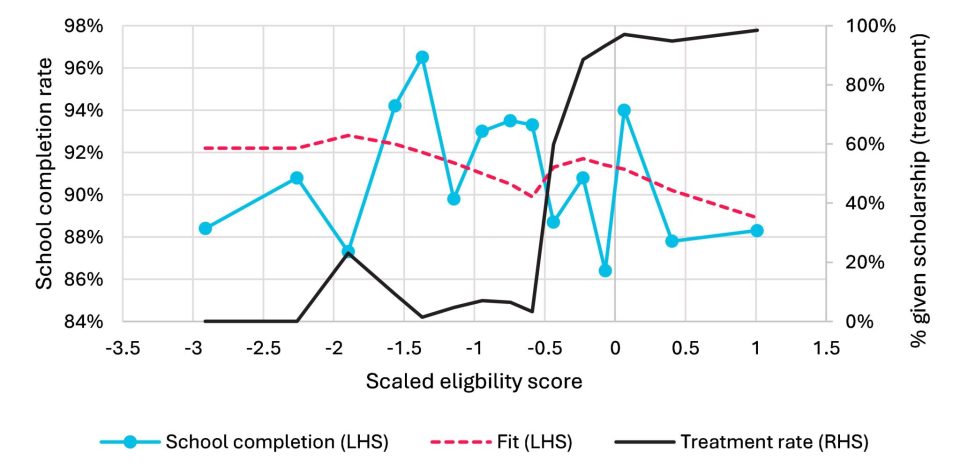
As an example, the NSW Department of Communities and Justice (DCJ) run a scholarships program for disadvantaged youth, primarily for those form social housing or in out-of-home care. This comprises $1,000, typically spent on education equipment such as laptops. A scoring rule using a range of variables is used to assign priority to those applying for the program. This is not a pure threshold; the cut-off points have changed over the years depending on demand and can also vary by region. The analysis of this type of threshold is often term a ‘fuzzy’ regression discontinuity, since a hard threshold effect is replaced by a graduated term.
Using a dataset of about 1,800 student-years receiving the scholarship, we can test for whether there’s an improvement in school completion by examining these threshold effects. The results are illustrated in the figure below. There remains volatility in school completion rates which makes conclusive findings difficult. However, there is good evidence of a downward trend in completion with eligibility score, and weak evidence of an upwards bump in completions associated with receiving a scholarship.
The presentation and related paper covers a range of quasi-experimental techniques with relevant examples drawn from recent work. It also includes a more general discussion of principles around causation and points to some useful references for interested readers.
Hugh’s presentation at the Virtual IDSS will occur from 11:30am-12:10pm AEDT on Monday 18 October. View the full Virtual IDSS program here.
Register for the 2021 Injury & Disability Schemes Virtual Seminar. |
Gold Sponsor:
![]()
CPD: Actuaries Institute Members can claim two CPD points for every hour of reading articles on Actuaries Digital.


