


The 2023 Intergenerational Report – The Best One Yet?
Each edition of the Intergenerational Report is an important public policy checkpoint. Hugh Miller explores some of its findings and offers key insights for actuaries.
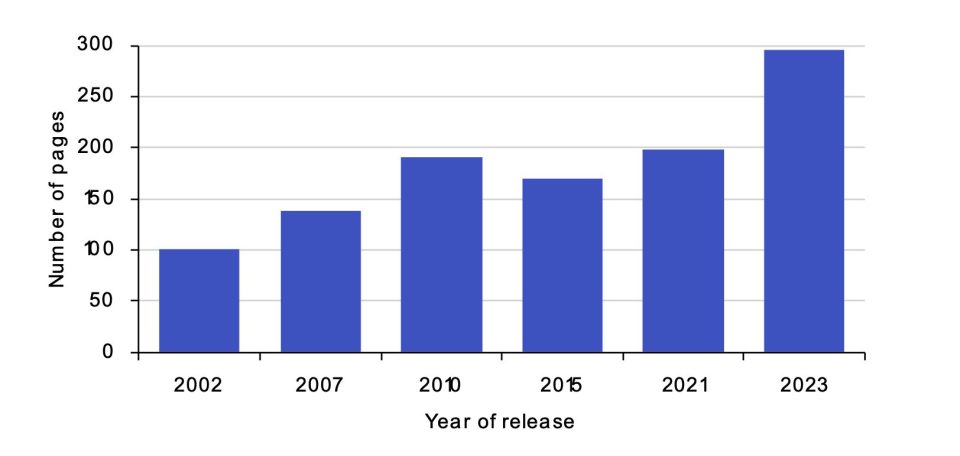
The Commonwealth Government released the 2023 Intergenerational Report (IGR) last week, its sixth since 2002. Each IGR is a good opportunity to look at the bigger picture and see how current policy settings play out in the long-term. And ‘long’ is the operative word – the 2023 report is by far the longest IGR, reflecting a large amount of supplementary discussion.
Figure 1 – Page length of IGRs
There’s been lots of good reporting already. This article gives an overview of the 2023 IGR (particularly concerning changes since previous reports) and some actuarial perspectives.
Understanding the core model
At its heart, the core IGR model is a mechanical projection of the economy’s response to a range of input assumptions, including trends attached to the ‘3 Ps’ of population, participation and productivity. This includes a detailed look at Commonwealth Government spending. As with previous years, the story is increased long-term pressure on the budget due to relatively higher spending and a lower income tax base.
For the macroeconomic nerds, tracking the changes over time can be rewarding. Net migration is assumed to sit at 235,000 people per year, two and a half times larger than the 90,000 assumed in 2002. This reflects the relatively high migration policy settings all governments have maintained over the past decade (COVID-19 interruptions notwithstanding).
Migration is a large lever in the context of the IGR. If the ‘big’ story in every IGR is that Australia is getting older, and this creates sustainability challenges, then migration is the key tool to moderate the trend. In the original IGR nearly 25% of the population was projected to be over 65 by 2042, but now it is projected to only get to 23% by 2063. Migration is the biggest driver in this change – in crude terms, changes to our migration settings have slowed down our demographic ageing process by a generation, which is a significant change.
Productivity growth is a little more pessimistic. A rate that started at 1.75 per cent has now dropped to 1.2 per cent. When converted to real GDP growth per capita, this means that instead of average living standards (assuming productivity flows into wages) growing by 90% over 40 years, it will be 57%. Falling productivity is a worldwide phenomenon, but it is important when thinking through the wellbeing of future generations.
Participation rate forecasts are a good reminder that it’s easy to be consistently wrong when you try to predict a moving target. Forecasts are higher again after strong gains for females and people over 60 (those baby boomers choosing not to retire quietly).
Figure 2 – Changes to participation rate assumptions
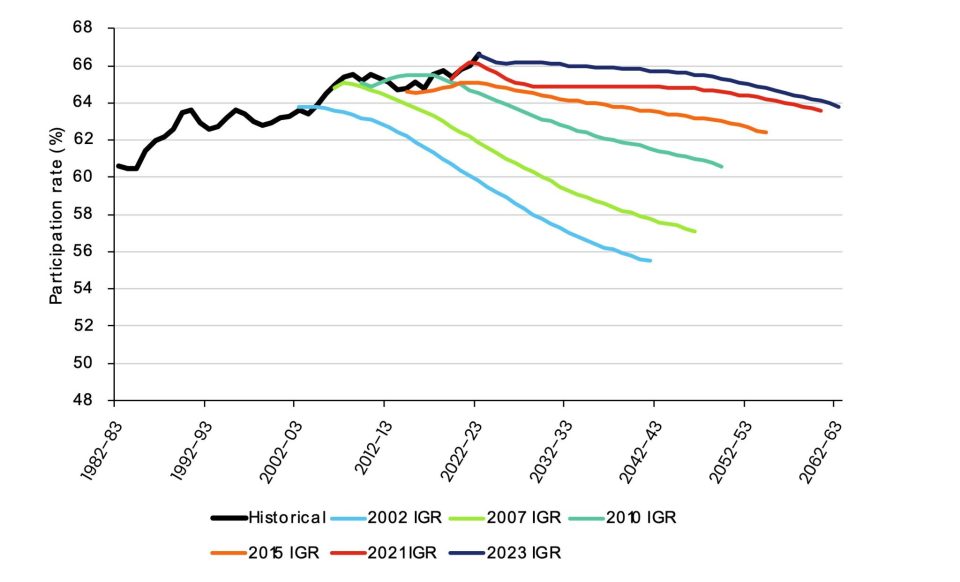
Source: 2023 IGR
One area notable for its change over time is future spending on the National Disability Insurance Scheme (NDIS) – an issue familiar to regular readers. The 2015 IGR assumed NDIS spending would stabilise at 1.1% of GDP, whereas it is now projected to peak at more than twice that at 2.4%, even after assuming the effectiveness of the government’s sustainability framework and the Scheme reaching maturity at 2042-43. In an IGR scenario of an uncapped NDIS, in the absence of the framework, the Scheme is projected to grow to 6.3% of GDP.
What sits around the projection is important
Over time, the IGR has broadened its discussion to recognise that much of what affects Australia’s long-term trajectory lies outside the mechanical projection. This is a sensible approach – not everything can be built into a model, and it would be hard to do so in a way that did justice to the large amount of existing research that the IGR draws from. The discussion is also revealing, as it more directly reflects the current thinking of government and departments.
The report calls out five big trends up front:
- Ageing – the consistent story that an ageing population causes a range of budgetary pressures.
- Technological transformation – the ongoing impact of technological change across a wide range of industries.
- Climate change, including the risks (such as more disasters and threats to industries such as agriculture and tourism) as well as opportunities (such as precious metal mining and energy generation). Climate change is mentioned ten times as often compared to the 2015 report.
- The rise of the care sector – A large growth sector is the care economy, spanning aged care, disability support and health.
- Geopolitical risk and fragmentation – Recognition that geopolitics and global supply chains have emerged as increasingly important factors in economic planning.
The report could not resist making one reference to generative AI (‘may improve the productivity of knowledge-based tasks’) but (perhaps sensibly) focuses on other aspects of technological change throughout. Technological change will be seen in the types of occupations that grow and the skills required, particularly in digital and data domains. Acting on climate change requires both the development of new technologies and the continued adoption of established ones.
Additionally, many vignettes throughout the report point to intersections with other interesting work and research. For example, the IGR points to the ‘Measuring what matters’ Framework that the Treasury has published to drive a more holistic look at well-being.
Overall, the increased breadth is a welcome way of tying together what is ultimately a huge topic.
Some perspectives
Surprisingly quiet on intergenerational issues
While the IGR contains the word ‘intergenerational’, it does not address all these issues head-on. It is largely silent on intergenerational income and wealth transfers and the growing challenges these place on younger generations of Australians. Rather, the report’s main punchline is around the impact on the Commonwealth Budget balance – this has some intergenerational aspects (more debt for future generations to pay for), but is obviously only part of the intergenerational story.
The Actuaries Institute has made some significant contributions in thinking about intergenerational issues. The Australian Actuaries Intergenerational Equity Index (AAIEI) looks at a suite of indicators from an intergenerational lens and, when last updated in 2021, found a widening gap between generations, falling home-ownership rates for younger people, growing environmental challenges and skews in government spending towards older Australians all contribute to a deteriorating index. The IGR acknowledges the falling rates of home ownership, particularly for younger people, but does not attempt to extrapolate the trend or calculate implications.
Figure 3 – Historical changes to home ownership
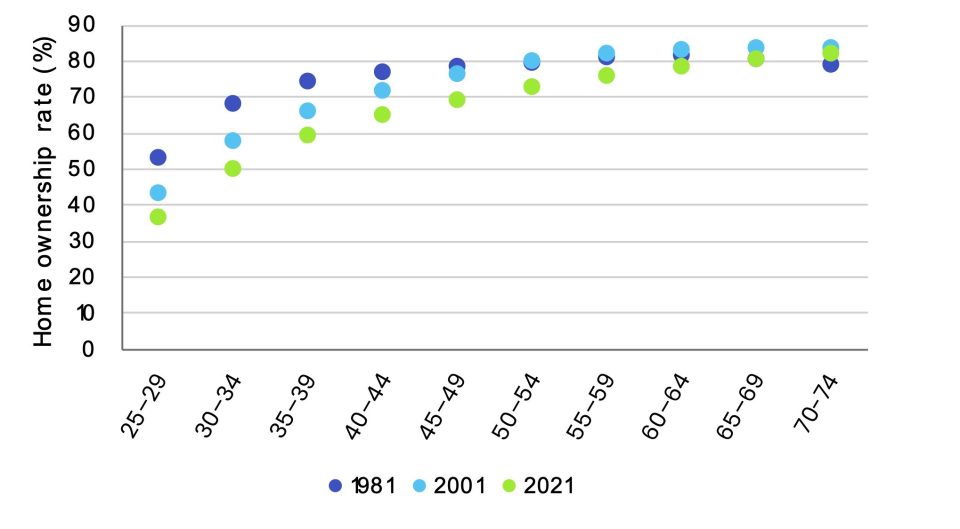
Source: 2023 IGR
Retirement incomes
Actuaries have also been active in thought leadership on retirement income policy. The IGR now shows relative stability in the cost of the retirement income system as a proportion of GDP, at just over 4%. There is still an ongoing shift from age pension to superannuation over time.
This stability is encouraging and suggests reasonable sustainability of the system – in large part due to superannuation savings offering a good foil for age pension costs, which would otherwise grow faster than GDP.
Figure 4 – Fiscal impacts of the retirement incomes system
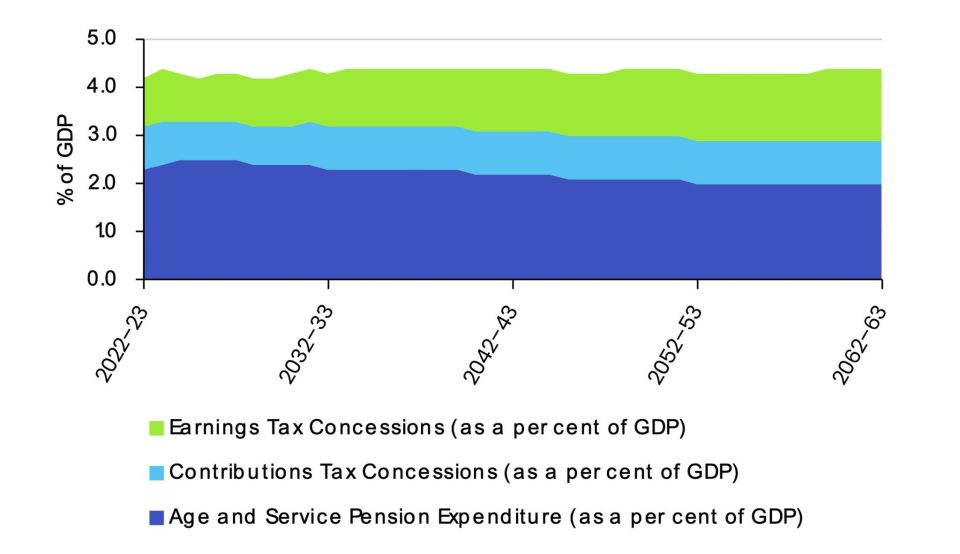
Source: 2023 IGR
Inequality and disadvantage
There has been increasing attention on inequality among both Australian and overseas researchers – evidence shows that aside from direct equity issues, high inequality can be a drag on total growth and make monetary policy less efficient.
The Institute has been active here too – the recent report Not a level playing field looked deeply at drivers and consequences of inequality.
The IGR does not delve deeply into the topic aside from acknowledging disadvantage in workforce participation. Increased attention would be a natural complement to Treasury’s work on wellbeing.
Figure 5 – Comparison of employment rates for First Nations people, people with disability and broader population
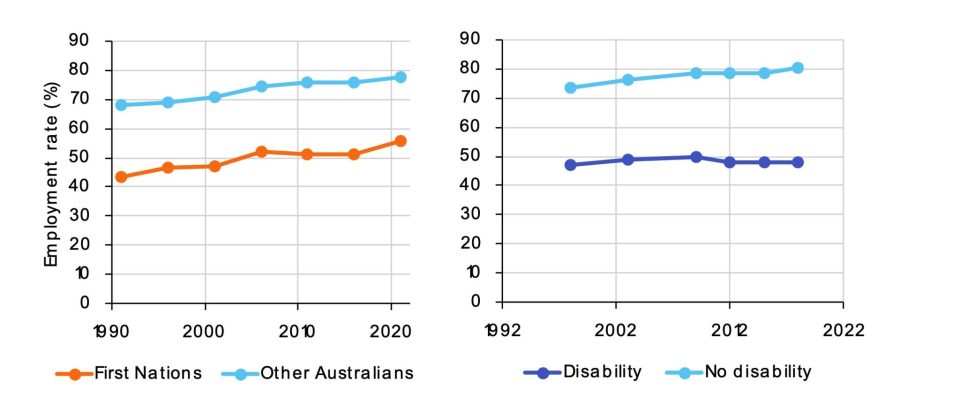
Source: 2023 IGR
Some limitations remain
Many of the usual comments on the IGR remain true for the 2023 iteration:
- Not a whole-of-governments view – State and Territory government budgets are not in scope – these will face related issues over the long term. NSW does do its own, which can be an interesting companion read. The disconnect is obvious in some places. For example, the 2023 IGR benefits a lot from high migration rates, but the associated challenges of housing and infrastructure are largely borne by States and Territories.
- No automatic policy response – The IGR is generally a standalone document for taking stock. It contributes to overall thought but does not attempt to apply a control cycle to manage and monitor issues raised. Instead, it sets the scene, framed by the government of the day, for upcoming debates.
- Predictions are hard – The mechanical projections are useful to highlight slow-burn emerging issues. But in reality, many things change the landscape very quickly, and assumptions change significantly across reports – even COVID-related fertility impacts are striking. So a suitable sized grain of salt is required.
Final comments
The IGR remains an important feature of our policy landscape and points to big challenges. I think the 2023 report is a good one – it’s starting to look more and more like a comprehensive stocktake of our past, present and future.
CPD: Actuaries Institute Members can claim two CPD points for every hour of reading articles on Actuaries Digital.


