


Skewness and kurtosis of Australian investment performance
In this article, Colin Grenfell suggests how skewness and kurtosis can be incorporated into stochastic models of Australian investment performance and related financial indicators such as inflation and the 10-year bond rate.
Understanding the range of investment returns for an asset class is a fundamental task. Does an asset class have a higher expected rate of return? How much additional variability, or risk, does it admit? But sophisticated investors have long understood the value in estimating more than just mean and variance. Higher-order moments, like skewness and kurtosis, can fundamentally affect the profile of an asset class. If an asset class like International Shares has large negative skewness, then occasional large losses can be anticipated and, hopefully, managed.
Estimating higher moments can be a challenge – it is not possible to find one formula that will satisfactorily produce the skewness and kurtosis likely to be experienced for all asset classes. Perhaps this explains why so many modellers and actuaries persist with normal or log-normal formulae?
Happily, with a suitably flexible approach the challenge is tractable. The formulae that I have used for many years, are described:
- In Appendix A of Australian Investment Performance 1959 to 2021 (and Investment Assumptions for Stochastic Models) presented to the 2021 Actuaries Institute Summit and updated in August 2021, and
- In the forthcoming 2022 update to be presented to the 2023 International Congress of Actuaries in Sydney – in the form of a short video with a link to the 88-page supporting paper.
The method uses two formulae. The first is based on the Normal Power Approximation and it produces satisfactory results for all share and property sectors. The second is based on a gamma exponential formula and it produces satisfactory results for all other asset classes and for the four financial indicators. Interestingly, the two formulae overlap – the 2023 ICA paper explains that for inflation-linked government bonds both formulae produce almost identical results. Interested readers are encouraged to read the papers above for further implementation details.
Do skewness and kurtosis matter?
The short answer is yes – when we estimate skewness and kurtosis for different asset classes we see a huge variety in shapes. The table below summarises these findings for the 15 sectors analysed in the above papers, plus for typical capital stable and balanced portfolios. The results are taken from Section 12 of the ICA 2023 paper.
The methodology used for determining these assumptions is based on a best estimate of 46-year third and fourth moments ending two years after the end of the data period. The choice of 46 years is explained in section 5.18 of the 2021 paper. The idea is to ensure a reasonable sample of observations across economic cycles. The same methodology is used, with only slight variations, for calculating assumptions for risk margins, coefficients of variation, and cross and auto correlations.
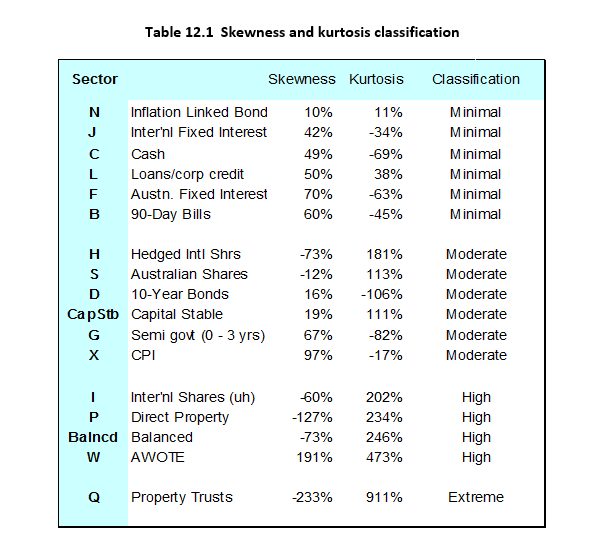
The table also shows a proposed classification into different severities of distributions. Inflation-linked bonds have low skewness and kurtosis, so risks attached to extreme or asymmetric returns seem small. Conversely, Property Trusts are designated “extreme” and show massive negative skewness and positive kurtosis. In this case consistent positive returns will be accompanied by occasional very large losses. Although this classification is only illustrative, the number of assumptions that fall outside the minimal classification sounds a warning for those who use normal or lognormal models in relation to investment performance.
While these estimates carry uncertainty and higher estimates are generally harder to estimate, having plausible estimates seems far preferable to putting your head in the sand and ignoring the effects.
We can visualise how these higher moments affect the pattern of returns. Using the estimates above, the following two charts illustrate how distributions for Direct Property (which has assumed negative skewness, shaded red) and AWOTE (which has assumed positive skewness, shaded green) compare with normal distributions over 60 discrete observations. The effect of skewness and kurtosis in producing distributions very different from normal is clear.
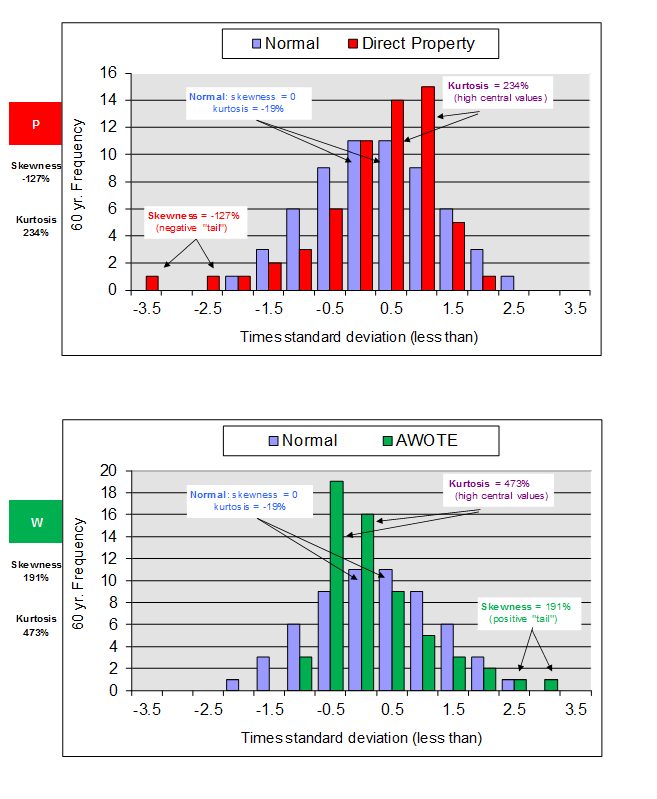
So skewness and kurtosis do matter. When allowed for, the results can often be significantly different from assuming a normal or log normal distribution and this should be appropriately recognised in any stochastic simulation of investment performance.
CPD: Actuaries Institute Members can claim two CPD points for every hour of reading articles on Actuaries Digital.


