What do chess results say about day-to-day variability in my mental performance?
In this Normal Deviance column, to celebrate the current World Chess Championship, Hugh Miller hunts through his recent online chess performance for evidence of performance rising and falling from day to day. Full data and code are available for those interested.
I occasionally stay up late – sometimes this is for a crunch deadline at work, other times forced by a child that refuses to have a full night’s sleep. However, one thing that’s never been clear to me is how this affects my performance the next day.
Happily, I now have a way of testing this (albeit under a very narrow definition of mental performance). Throughout the most recent Sydney COVID-19 lockdown, I’ve played a lot of (probably too much) blitz chess online. As I’ve played, it’s certainly felt like my performance has varied day-to-day; sometimes I’ll have a run of wins and other times a series of losses that suggest maybe I should get some rest. Looking at this data gives the opportunity to test some of this formally.
Datasets were downloaded from chess.com using their API. I also have a timesheet tracker that tells me if I was using my computer late – and have derived an indicator variable for this. For interested readers, the full (suitably rough) R code is available here.
Figure 1: One of my less terrible games of chess
Figure 2: Examples of daily results. Do they indicate daily ups and downs?
|
Date |
Results |
|
16 Sep 2021 |
WLWWLWLWWLLLL |
|
17 Sep 2021 |
LLLLWLLWLLWLLWLLLLL |
|
18 Sep 2021 |
WWLLWLWWLLWLWWWWLWLWWWWWWLWLWLLL |
|
19 Sep 2021 |
LWLLWWWWLLLLWWWWWWWWLWLW |
Analysis
The dataset is about 600 games (almost all 3-minute-a-side blitz chess) over a two-month period. After discarding draws (there aren’t many in blitz chess) we are modelling a 0-1 response, with a positive response indicating a win for me. I’ve done a few things to unpack the data and look for evidence of day-to-day variability:
- Generalised linear model (GLM). An initial multivariate fit of key factors predicting win rate reveals that:
- Working late does not appear to affect performance; the indicator variable for being up late the night before has no impact on win rates the next day.
- By far the most important factor is the difference between my rating (at the time) and my opponent; a 50-point advantage takes my win rate from 50% to about 85%, and conversely, a win rate of 15% corresponds to a 50-rating point disadvantage.
- The piece colour is, unsurprisingly, significant. Playing white adds about 9 percentage points to my win rate.
- I win more in the morning and early evening. There’s some evidence (moderately significant) that my performance drops after 10pm, which is probably a good reason to put the phone away!
- Random effects model. After the disappointment of the GLM not detecting an effect, I extended the model to a random effects model, with the day of the game the random effect. If we see evidence of performance peaks and troughs day to day, this will be detected as an explanatory factor. However, we again see a null result. The AIC for the model fit is worse, indicating the random effects are not adding much, and the variability attributed to the random effect term is small. Again, no evidence of day-to-day variability.
- Runs test. Not content with two null results, I applied a runs test to see if I have more ‘streaks’ of wins and losses than expected. Again, no significant effect was detected.
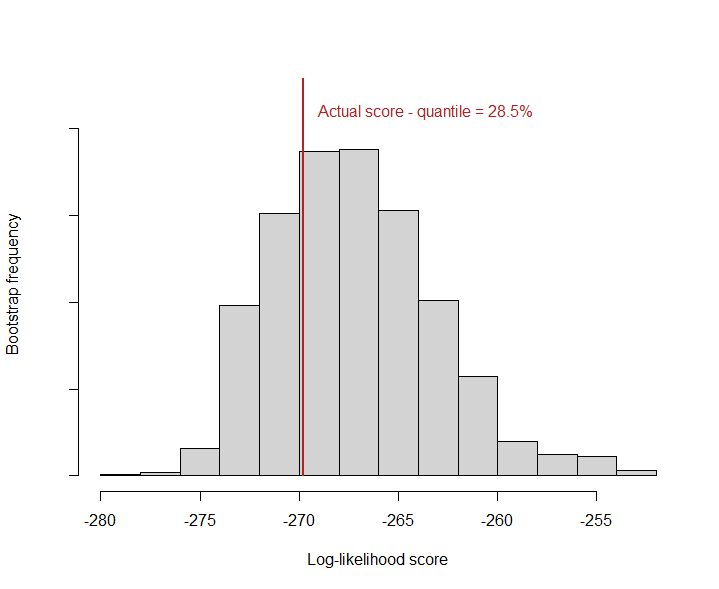
- Bootstrapping daily win rates. As a final test, I ran a bootstrap simulation where my results were randomly allocated to days and a log-likelihood score calculated using the implied daily win rate as an (overfit) prediction. This was then compared to the ‘actual’ log-likelihood as another test of whether I tend to win more on some days and less on others. As the figure below shows, the actual score lies well within the range of random variation, suggesting no significant clustering effect.
Figure 2: Actual log-likelihood score against bootstrap random replications. A strong clustering pattern would see the actual lie to the far left of the distribution.
Conclusions
Despite looking hard, it looks like overall performance does not show evidence of day-to-day variability. This genuinely surprised me; I may have been the victim of confirmation bias, believe that those odd days or streaks where I see poor performance when tired incorrectly indicate a deeper truth. And it is a reminder that streaks of wins and losses are expected to happen by chance (an effect that led to Apple deciding to make its shuffle feature less random).
Hopefully, the analysis description also demonstrates there are a few ways of looking at the same idea through different forms of statistical analysis. The fact that they’re pretty consistent is an encouraging sign.
There are some caveats, as ever. My rating does rise and fall with results and the chess server attempts to find good matches for that; so even if my performance was truly worse on a given day, a lower rating would then lead to easier games and a better chance of winning.
I don’t think the findings mean I can get away without enough sleep. But at least it suggests it won’t kill my Chess.com rating.
CPD: Actuaries Institute Members can claim two CPD points for every hour of reading articles on Actuaries Digital.