


Why you should care about the Intergenerational Report
Hugh Miller takes a closer look at the 2021 Intergenerational Report, an important plank in long-term planning in many sectors.
The 2021 Intergenerational Report was released by the Federal Government at the end of June. Its great strength is that it provides a long-term lens to think about the economic challenges facing the country. Actuaries have an interest in many topics covered, and indeed we maintain our own Intergenerational Equity Index. This article explores the report and offers some thoughts on what it means, and what’s missing.
What the report tells us
I think of the report as a story in three layers.
The first layer comprises of the big long-term trends that have consistently highlighted in all iterations of the Intergenerational Report. In short:
- We’re heading towards being a much bigger country, driven largely by immigration. The population is expected to grow somewhere around 1%p.a. over the next 40 years, to 38.8 million people in 2060/61.
- The aging population presents a fiscal challenge as support needs grow. This is particularly the case if we decide tax as a proportion of GDP should be capped (as is done in the report). Long-term growth areas in government spending, such as health, will need to be reconciled with the fiscal realities.
- Per capita real GDP growth will sit below GDP growth, but is still assumed to be steady. While real GDP growth is pegged at 2.6% p.a., this is only growth of 1.5% on a per capita basis.
The second layer of results are about understanding what has changed since the last intergenerational report (which was met with mixed reviews at the time).
- We see a slowdown in population growth and GDP due to the pandemic. While the paper assumes a reversion to trend, this process takes time and there’s an overall level shift as a result.
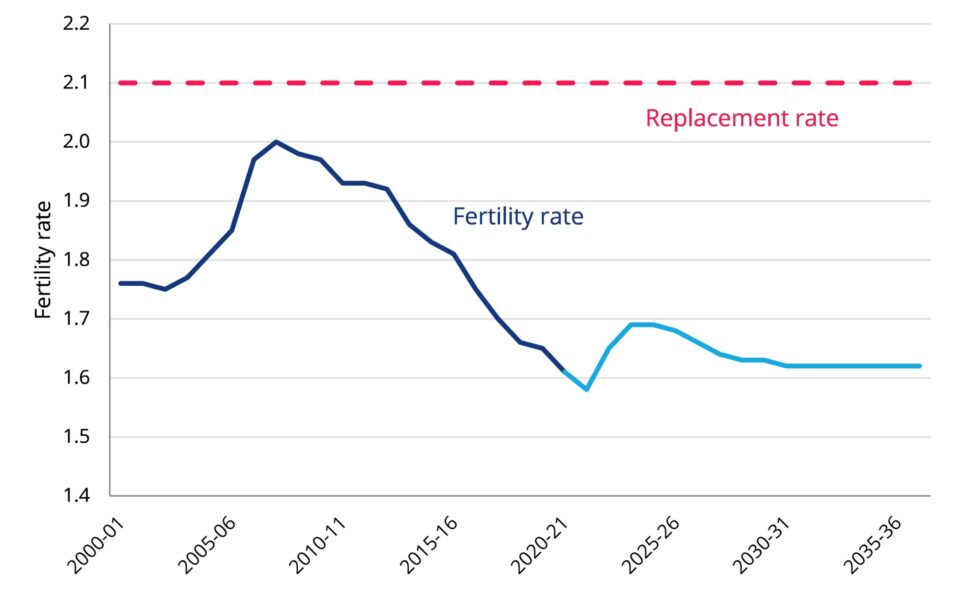
- Fertility rates have continued to fall. Fast. While it’s hard to pick trends, there’s clearly some risk that rates go lower. This may accentuate some of the flagged demographic challenges.
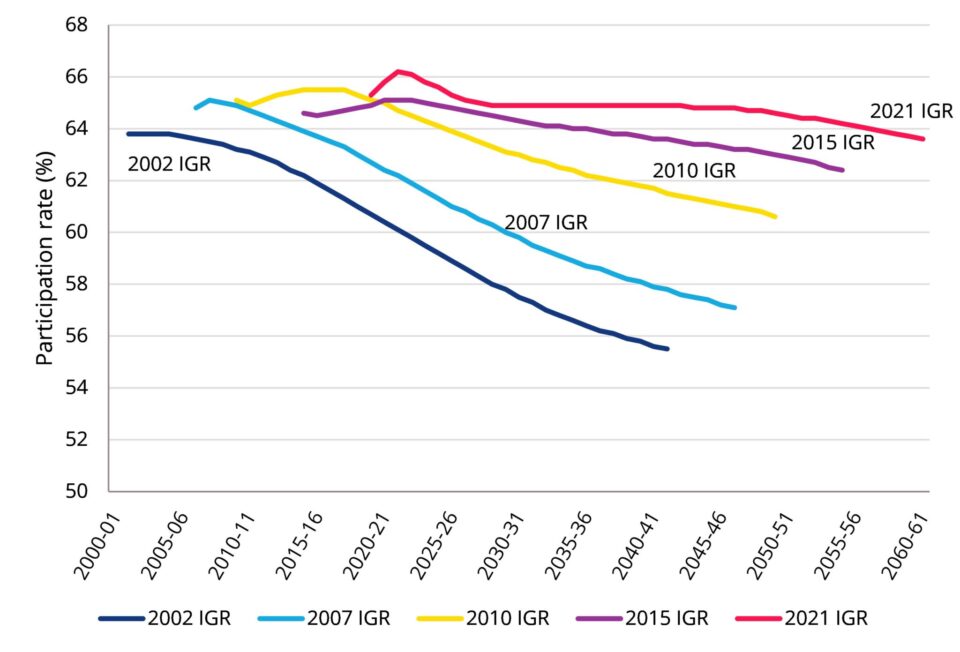
- Participation rates have consistently been higher than expected, particularly for female workers and those nearing or just past retirement age.
The third layer of the report is the tone of commentary in the report. While much of this is separate from the technical assumption setting, it gives some insight into how Treasury is thinking about the future and reflects the breadth of thought required in modern macroeconomics. Here are a few that I particularly appreciated:
- Discussion on female participation rates and the importance of reducing the gender pay gap. While the gender pay gap is rightly flagged as a fairness issue, it also has economic ramifications. Specifically, the report highlights that lower female pay may act as a dampener to female participation following parenthood, as well as reducing retirement savings.
- Discussion on changing our skills mix. There is a recognition that in a world where industries are changing and evolving, not investing in ongoing skills development risks people being left behind. Further, it may also accentuate skills shortages if occupations and skills in increasing demand are not supported. This has implications for how with think about vocational and higher education.
- Discussion of natural capital and the environment. The natural environment receives significant attention, recognising that a strong economy cannot exist without a sustainable land and ocean. This is consistent with previous iterations of the report, but the increased attention paid to climate change prevention and adaptation is pleasing. The section also explores biodiversity, water, oceans and waste.
Some items hiding in the detail
Any projection over decades requires assumptions and long-term historical averages are a reasonable place to start. I’ve no real issues with the specific choices. and the report does a commendable job exploring the sensitivities around assumptions. Some of the key ones are:
- Productivity growth is assumed to match its long-term rate of 1.5%. This is larger than recent levels and compares to a 1.2% assumption adopted in NSW’s equivalent intergenerational report.
- The 10-year bond yields are assumed to transition to a rate of 5% by 2040-41. This is a reduction from 6%, which recognises that not only has been a fall in interest rates, but also in the underlying ‘neutral’ interest rate (consistent with work presented at the recent Summit).
- The Australian Government tax cap is assumed to be 23.9% and the projection assumes we hit that cap in 2035-36. There’s nothing special about that number, apart from it representing the peak reached under the Howard government around the turn of the century. This cap implies an ongoing structural deficit of 1% to 2% of GDP. However, to actually impose the cap this implies ongoing changes such as adjustment for bracket creep.
What I would have loved to see more of
- While the discussion of broader social, environmental and economic issues is welcome, there is no direct connection between this discussion and the mechanics of the projection itself. Bringing the thinking together remains one of the key challenges in macroeconomic work.
- The report understandably takes a view most directly relevant to the Federal Government. This means there is an opportunity to combine this view with considerations managed by States (such as parts of education, housing and human services) or important to society more broadly. This is the approach we took with the Actuaries Institute Intergenerational Equity Index, which looked across topics that spanned jurisdictions. The interaction between state and federal budgets on areas of shared interest such as education, disability and health will be increasingly important.
- There are some implicit assumptions that could be better highlighted. For instance:
- Growth in productivity is assumed to flow into wages and in turn income tax. However, the past decade has seen a shift away from wages and towards corporate profits, so this link is not always direct.
- Many working-age income support benefits are tied to CPI rather than wages. Poverty lines are often drawn relative to median or average wages. Under such a definition, benefits will fall as a fraction of wages and so increase poverty rates for people on benefit. Similarly Rent Assistance will likely continue to fall as a fraction average private market rental costs.
- Population projections assume that this can be managed without undue impact on other economic trends. This means solving significant questions around housing, development and infrastructure.
- Inequality is mentioned twice in the 2021 report (in footnotes), compared to zero times in the previous report. Internationally there is increasing focus on income and wealth inequality as drags on growth. Australia has a growing wealth inequality gap, much of it driven by housing wealth accruing to existing property owners. The report does not attempt to model the role of inequality on productivity growth or interest rates.
- Growth in productivity is assumed to flow into wages and in turn income tax. However, the past decade has seen a shift away from wages and towards corporate profits, so this link is not always direct.
Final thoughts
Actuaries know that serious long-term strategic thinking is incredibly valuable. There is no excuse for not planning around the demographic trends for which we can anticipate with certainty. The challenge is continuing the conversation so that long-term thinking can be better reflected in short-term decisions.
CPD: Actuaries Institute Members can claim two CPD points for every hour of reading articles on Actuaries Digital.


