
62 years of Australian investment performance to 30 June 2021
Colin Grenfell provides an update on the Australian Investment Performance paper he presented at the 2021 All-Actuaries Virtual Summit.
Every two to four years since 2005, the Actuaries Institute has published my papers on Australian investment performance. These papers have been discussed at Institute conferences, Insights events and at the 2010, 2014 and 2018 International Congress of Actuaries.
Each of these papers tabulates and summarises annual average investment performance results for:
- Risk margins
- Coefficients of variation
- Skewness and kurtosis
- Cross and auto-correlations.
The analysis span 15 ‘sectors’, covering 11 investment classes and four key financial indicators. The latest paper, Australian Investment Performance 1959 to 2021 (and Investment Assumptions for Stochastic Models), was presented on 10 May at the Investment and Wealth Management plenary at the Virtual Summit.
|
In view of the timing of the Virtual Summit, the final 248th quarter of the 62-year period covered in the latest paper was based on 31 March 2021 market values, and 31 March 2021 annual rates for financial indicators. The investment performance and financial indicator rates are now available for the 30 June 2021 quarter, so the paper has been updated. |
The updated paper is available here and on the Institute’s website.
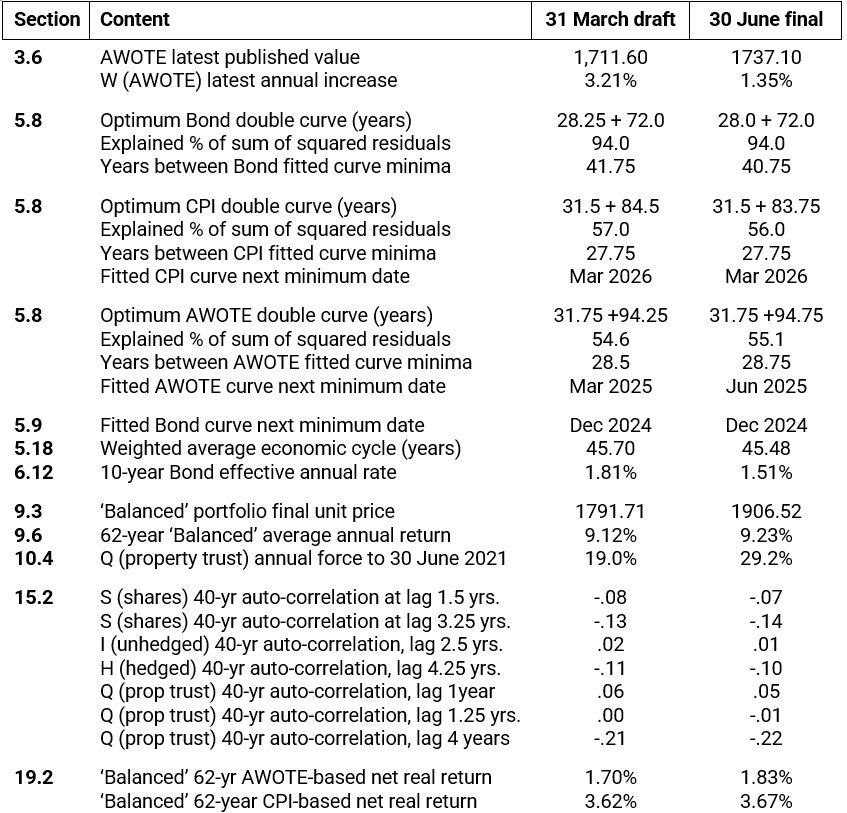
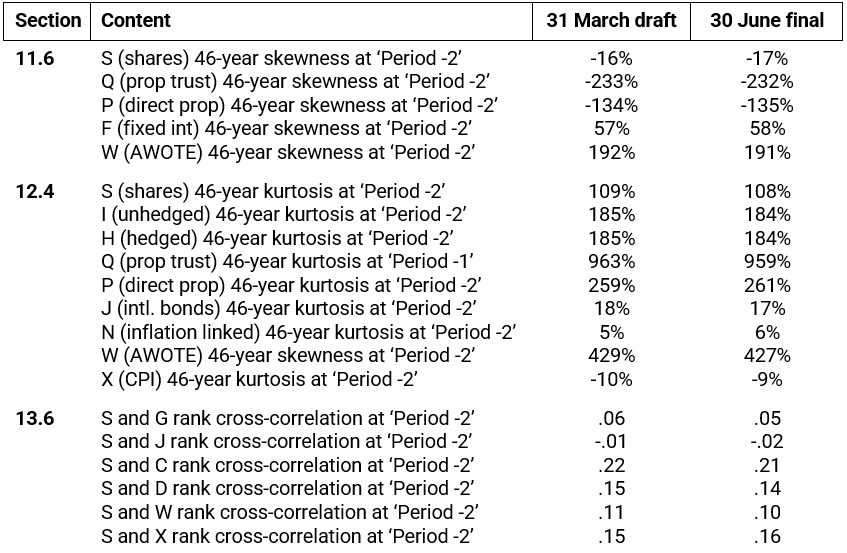
Updating the paper impacts the 30 Tables and 23 Figures in the paper, as well as the corresponding text. The following two tables summarise most of the changes for both past investment performance and for the derived stochastic investment assumptions. No changes were required for the risk margin and coefficient of variation assumptions – where all updated results were within the sections 6.12 and 7.5 ranges, or were absorbed within the rounding.
We should all be aware of warnings such as ‘past performance is no indicator of future performance’. But sometimes past and future investment performance can align, and remarkable coincidences can occur. The previous version of this paper was presented in 2018; it was based on data up to 30 June 2017. When updating section 9.6 of the paper, based on the final 30 June 2021 data, it was noticed that for the ‘typical’ balanced portfolio specified at the end of section 8.3, the time-weighted compound average annual return, rounded to four decimal places, was:
- 9.2298% for the 58 years to 30 June 2017, and
- 9.2298% for the 62 years to 30 June 2021.
(When rounding was increased to five decimal places the results were 9.22981% and 9.22979% respectively.)
Of course, sometimes errors can also occur. While completing the updating it was discovered that Table 8.3 was incorrect. It was intended to show (for historical interest only) past standard deviations over 46-year periods, but it in fact included a repeat of the compound means from Table 8.2. This has been corrected in the updated paper.
1. Past Investment Performance
2. Stochastic Investment Assumptions
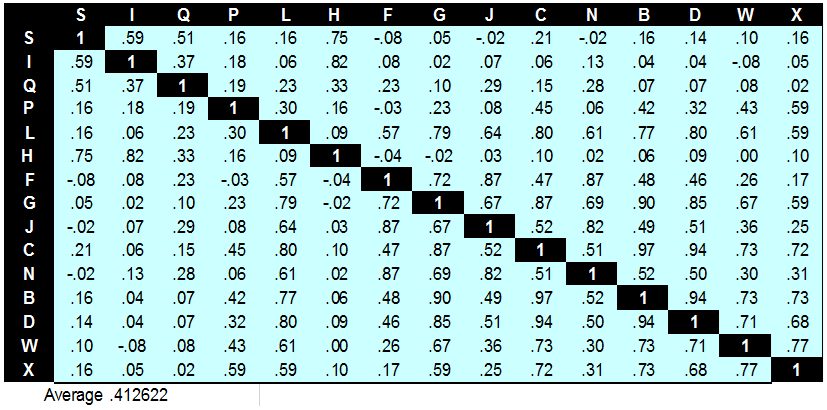
Updated versions of Figure 14.1, Table 16.1 and Table 16.3 are shown below:
Figure 14.1: Bond, CPI and AWOTE – double cycles
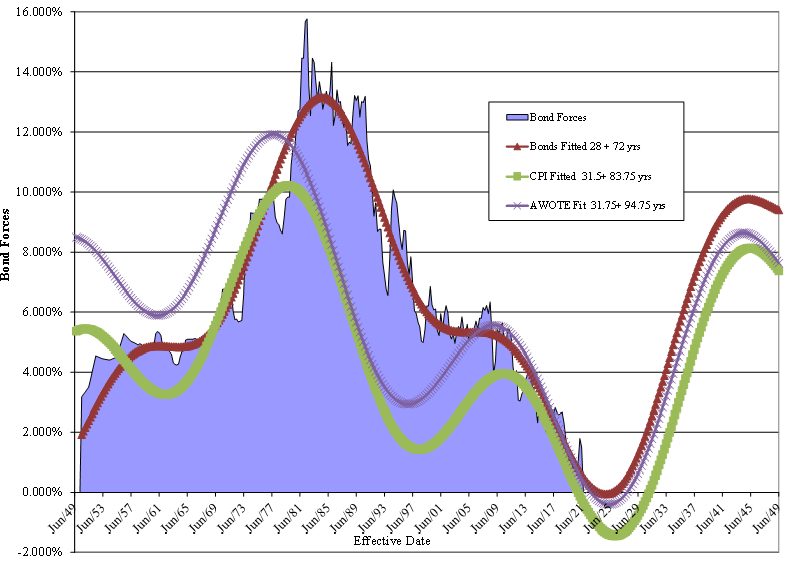
Table 16.1: Investment Assumptions (before tax and fees)
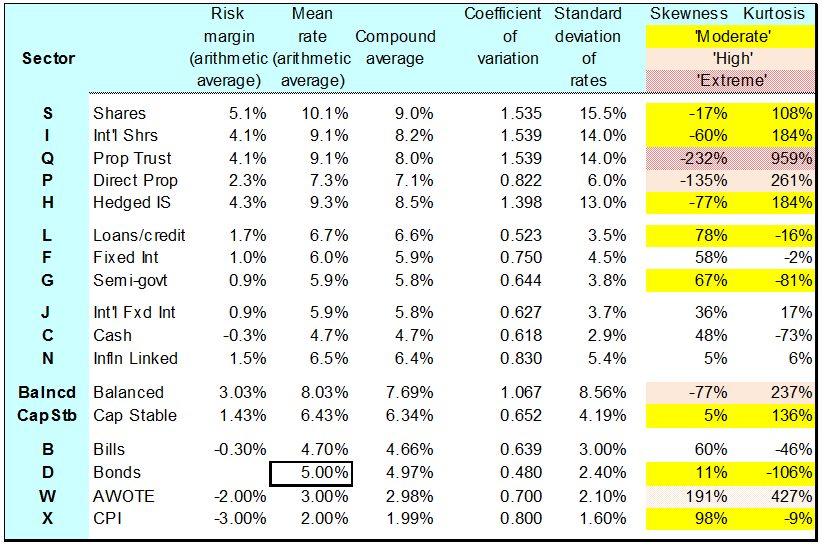
Table 16.3: Cross-correlation assumptions
Rank cross-correlations @ two years (five point average, rounded)
CPD: Actuaries Institute Members can claim two CPD points for every hour of reading articles on Actuaries Digital.


