


Update on Mortality in Australia
The ABS has just released the mortality statistics for the month of June in Australia (for doctor-certified deaths only, excluding coroner-referred deaths). We’ve analysed this to update our previous detailed analysis up to May.[i]
Deaths continue to be statistically significantly lower than predicted throughout June. And while the cause of the reduction in deaths seems likely to be lower levels of respiratory illness in the community, this emerges not just as a reduction in influenza and pneumonia deaths, but also as a reduction in deaths from chronic lower respiratory illness, dementia and ‘other’ deaths (being those not specifically reported on in the ABS data).
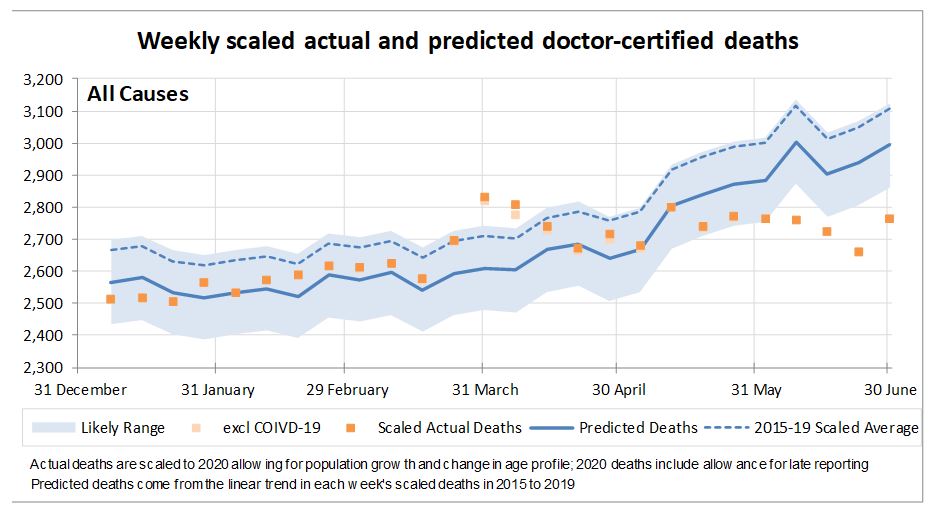
Overall the various non pharmaceutical measures to reduce the spread of COVID-19 in the period up to the end of June across Australia (lockdowns, social distancing measures, wearing of facemasks, etc) have almost certainly reduced mortality from other causes across Australia, with deaths during June being 400 lower than the bottom of the likely range.
Respiratory Diseases
Why could this be? The shape of the graph gives the clue. In previous years, deaths have increased in May and June as the flu season starts, but in 2020 actual deaths have stayed consistent with previous months. The graph below shows influenza, pneumonia and chronic lower respiratory disease deaths for 2020. (We note that the public focus is often on flu, but pneumonia causes more deaths than the flu and chronic lower respiratory disease kills more than the other two combined.)
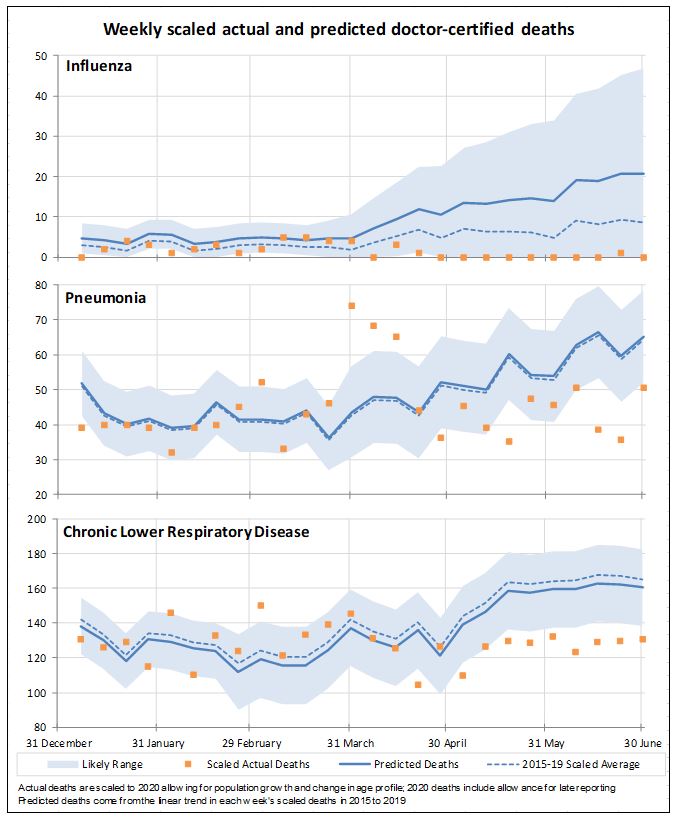
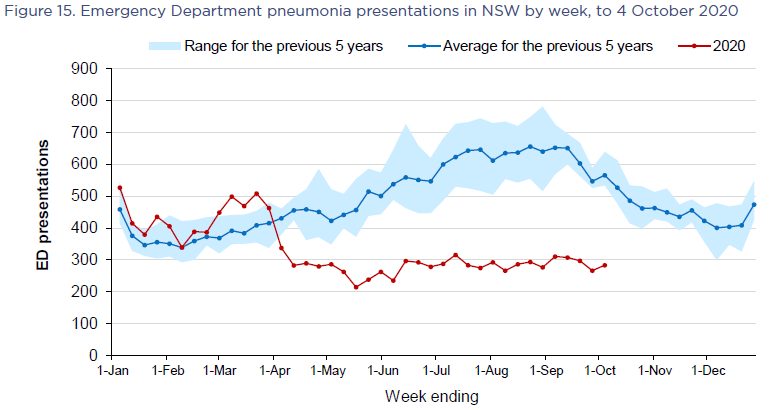
As the ABS has now separated out influenza and pneumonia deaths in this latest data release, we can clearly see that the March/April spike in these deaths was all related to pneumonia. NSW Health data (found here) shows that presentations for pneumonia were relatively high in March, which supports our view that these deaths probably include undiagnosed COVID-19 deaths:
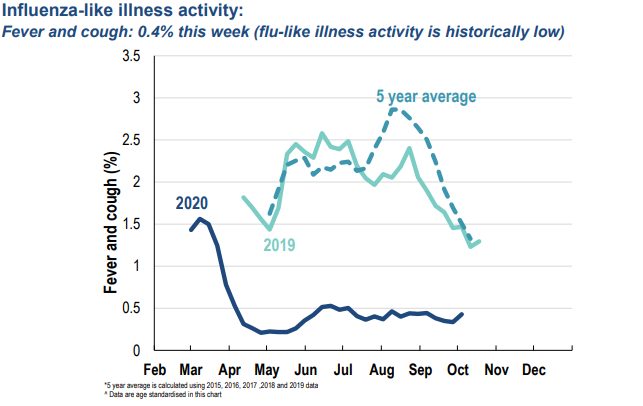
Since mid-April, deaths from all three of these respiratory diseases have been very low in Australia. For example, there has been only one doctor-certified influenza death in this time. We would expect a reduction in deaths from all of these causes because social distancing, even without lockdown, has dramatically reduced the incidence of flu in Australia this year, as this graph from Flutracking shows:
Other causes with low incidence in June
But it isn’t just flu, pneumonia and chronic lower respiratory disease. The deaths from dementia and ‘other’ were also significantly lower than expected in June:
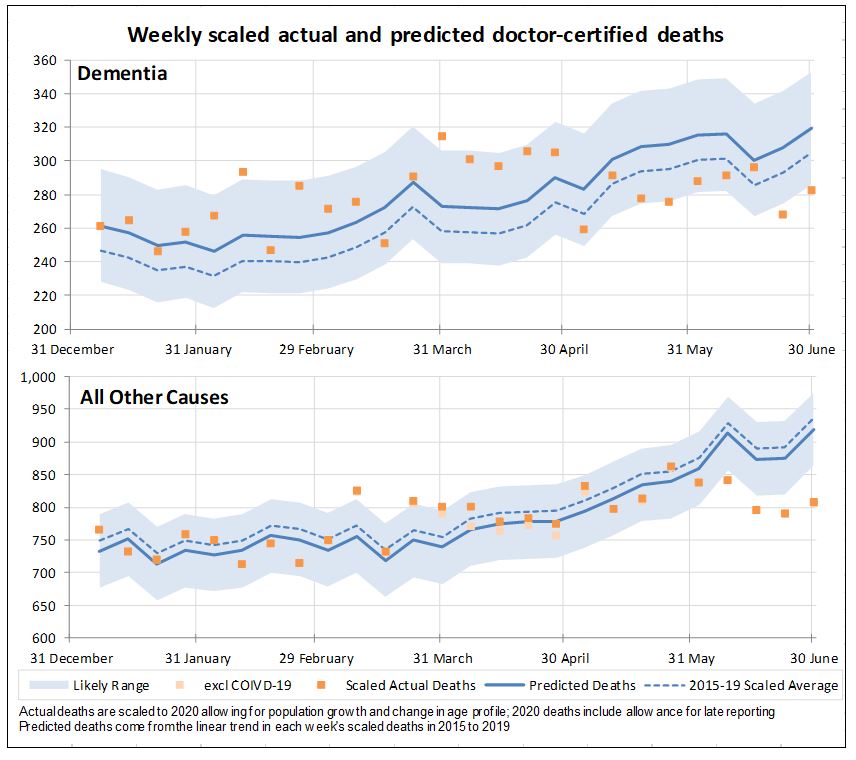
Dementia deaths were low or very low in May and June, while deaths from all other causes were significantly lower than expected in June. It is plausible that the reduction in common respiratory illnesses in the community led to lower deaths from dementia and other causes, as any illness is likely to increase the mortality of the very frail or otherwise unwell in our community. It is also worth noting that about a quarter of expected respiratory disease deaths would fall under ‘other causes’ in this analysis.
Other specified causes of death
For completeness, below are the graphs for the four other specified causes of death in the ABS data.
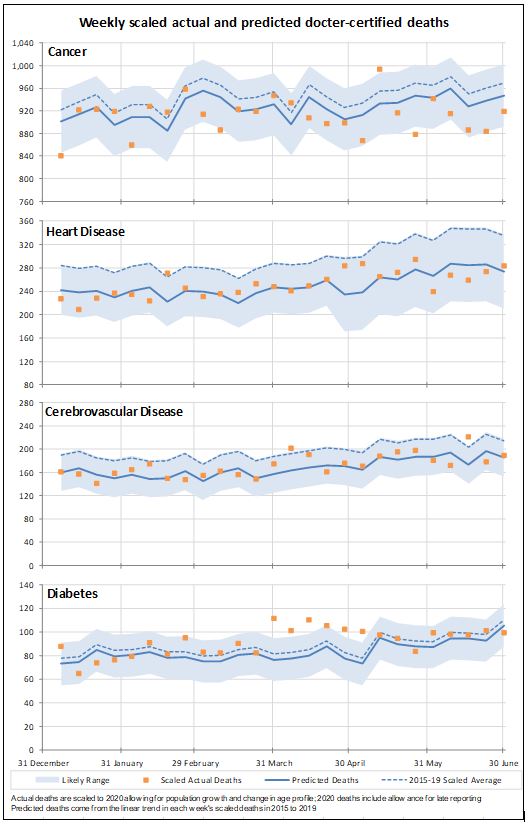
These charts suggest that deaths have generally been broadly in line with expected levels for heart disease, stroke (cerebrovascular) and diabetes, other than the late March spike for stroke and the six weeks of elevated diabetes deaths in April/May. Provided that medical treatment is sought when urgently required, there is no obvious reason why distancing measures would have a huge impact on deaths from these causes – with the possible exception of the potentially deleterious effect of lock-down on eating, drinking and exercise.
There is evidence (found here) that skin, breast and colorectal cancer screening and therapeutic procedures dropped significantly during March, April and May and had not yet recovered to pre-pandemic levels by June for some procedures. It is likely that any consequential adverse impact on mortality will take some time to emerge. Meanwhile, cancer deaths since the end of March have generally been lower than expected; it is possible this is also connected to the low levels of respiratory disease, since the cause of death in the ABS data is the primary cause of death.
What if…?
What if there had been no restrictions on movement and social interaction across Australia?
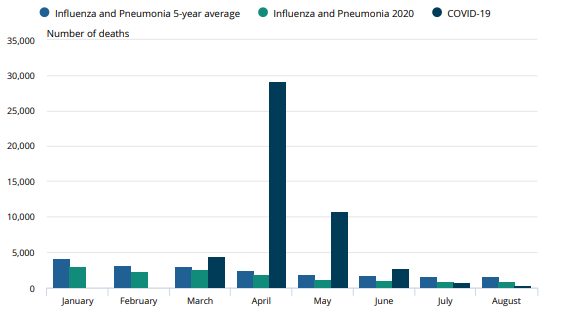
This graph from the UK’s Office of National Statistics (here) shows monthly COVID-19 deaths in England and Wales this year, compared with those from flu and pneumonia. There were 33,626 deaths caused by COVID-19 in March and April combined, dwarfing the flu and pneumonia deaths in the same period. We have not tried to model what might have happened with Covid19 deaths in the absence of Australia’s strict public health measures, including quarantining of overseas arrivals, lockdowns, school closures and other restrictions. However, it seems highly likely that the deaths in Australia would have been substantially higher than previous years, rather than, as did happen, deaths in June being around 400 lower than the likely range for a normal 2020.
It is clear that lock-downs and other COVID-19 control measures have created great hardship for many in Australia. And there will surely be medium- and long-term consequences for physical and mental health and for the economy. However, these measures have not only saved very many Australians from COVID-19 disease and death, they have also reduced deaths from a number of other causes.
[i] As with our previous analysis, we built a model predicting weekly deaths in 2020, based on the information provided by the ABS about weekly deaths during 2015-2019. Some key points:
- The model starts with the average weekly deaths from 2015-2019.
- It then scales those deaths for population (an 8% increase over five years) and age distribution (a 4% increase over five years)
- It then scales those predicted deaths to allow for average mortality improvement over the last five years (a 3.5% decrease).
CPD: Actuaries Institute Members can claim two CPD points for every hour of reading articles on Actuaries Digital.


