


Budget 2020 – Afterpay to the max
Economists love Budget night. We get to stay up late and eat junk food! And this Budget has provided plenty for us to digest beyond the standard pizza. 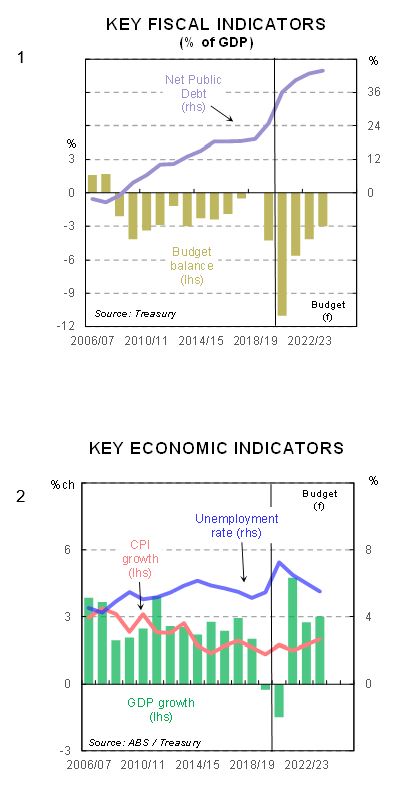
To get the breathless superlatives out of the way up front, this Budget shows:
- the fastest deterioration in Budget figuring ever seen;
- the worst expected outcomes for government debt and deficits in the post-war period; and
- the most disappointing set of economic forecasts since projections for the Australian economy were first published in 1968.
Budget figuring foresees the budget deficit spiking to 11% of GDP in 2020/21. Smaller deficits follow but are still running around 3% of GDP in four year’s time (Chart 1). And net public debt is expected to amount to $966bn (near 44% of GDP) by mid 2024.
The economy is projected to contract by 1½% in the current year. A decent bounce is (optimistically) expected in 2021/22 but Australia’s growth potential has been damaged. It takes five years for the economy to get back to where it would have been without COVID-19. The unemployment rate peaks at 8% in late 2020 and holds above 6% until 2023/24. Inflation remains dead in the water. (Chart 2).
Far from the ‘beautiful set of numbers’ that Treasurers like to present on Budget night. But in the end this Budget should be seen for what it is – a creditable attempt to deal with and respond to the hand dealt by COVID-19.
The Government deserves some praise for what is essentially a whatever-it-takes moment for fiscal policy. And for providing an exit strategy even though the exit remains a long way off.
The ability of Budget night to surprise is quite limited these days. The carefully orchestrated series of leaks and announcements that precede the Budget has seen to that. The surprising word that comes to mind this time is ‘honesty’. There is no attempt to make a silk purse out of a sow’s ear.
The main disappointment relates to the lack of triggers that will turn fiscal stimulus on paper into fiscal stimulus in the real world. To be fair, there is some of this. The front-end loading of business tax concessions is smart. As is the plan to direct infrastructure spending to those States that can get the money out the door the quickest. But most of the stimulus is being directed at households. And households have shown thus far a preference to save rather than spend.
Much will depend on whether the Budget and the Budget sell can shift the dial back from saving to spending. There are some encouraging signs. But sentiment is fragile.
The focus on Budget night is inevitably on the bottom-line aggregates. But Budgets are more than that. They are accounting exercises, economic policy plans and political documents. Judging a Budget requires consideration of all three.
The Budget as an accounting exercise. 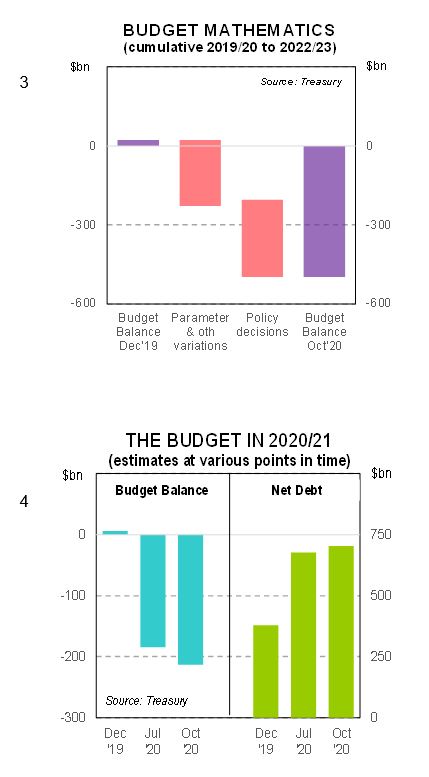
The Budget figuring reveals the damage done to the government’s accounts by COVID-19 and the policy response to it. The virus put the wrecking ball through the revenue side of the equation. The policy response has further damaged revenues and lit a rocket under government spending.
The mid-year budget review in December 2019 – pre COVID – projected cumulative budget surpluses of $23.5bn over the four years to 2022/23.
The Budget mathematics (Chart 3) now show that parameter & other variations – or ‘the economy’ – will cost the budget bottom line $228bn over the period. The policy response comes with a price tag of $294bn. The cumulative budget deficits over the four years to 2022/23 now stands at $499bn.
Treasurer Frydenberg’s Budget speech took 42 minutes. That speech covered new policy since the July 2020 Economic & Fiscal Update worth $111bn, or $2.6bn per minute. This amount far exceeds the much-derided Howard ‘spendathon’ during the 2007 election campaign. But the difference just underscores the magnitude of the task faced by policy makers.
The Budget figuring also reveals the speed with which fiscal parameters can change. The Budget balance for 2020/21 was put as a surplus of $6bn in December 2019. That had morphed into a deficit of $185bn by July 2020 and an even larger deficit of $214bn in the October Budget. (Chart 4).
These sorts of variations are why economists routinely warn that Budget figuring is work in progress. And why the word ‘rubbery’ routinely gets trotted out in Budget analyses.
Whatever the ‘true’ deficits, they need to be financed.
The rapid growth in government debt of recent years will continue. The jobs of the bond sellers at the AOFM are secure!
Commonwealth government gross debt is expected to stabilise at around 55% of GDP by the late 2020’s. This outcome would be the highest recorded since WW2 (Graph 5). Net debt trends are more favourable, courtesy of the financial assets held by organisations such as the Future Fund. The peak in net debt is put at $966bn (43.8% of GDP) by mid 2024. The ratio slowly declines thereafter.
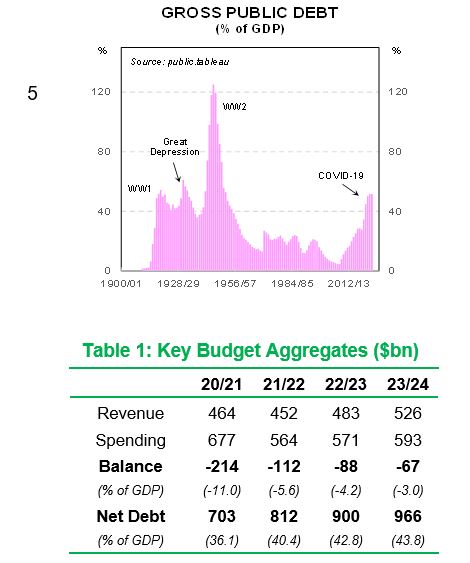
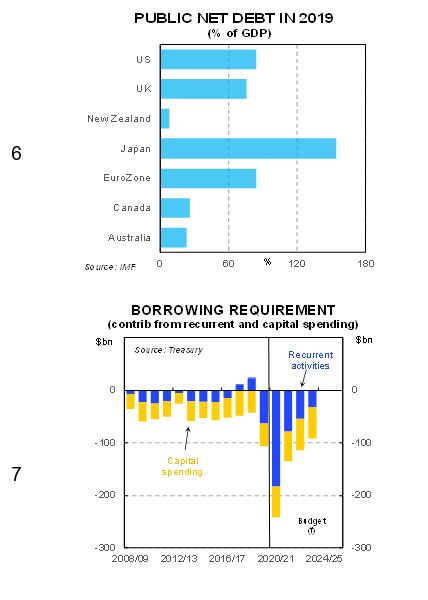
The absolute numbers look quite alarming. But there is a relative story that is much more favourable to Australia. The starting point looks quite favourable relative to many other countries. (Chart 6).
There is another truth that needs to be acknowledged about Australia’s fiscal position. Former Treasurer Peter Costello nailed it when he noted this mountain of government debt will never be repaid. Budget surpluses would be required. And even with hefty surpluses around the $10bn mark it would take nearly a century to level the debt mountain. This outcome is simply unachievable when benchmarked against the economic cycle and the political cycle.
And in the end the debt is desirable and sustainable.
PM Morrison triggered a debate about ‘good’ debt and ‘bad’ debt when he was Treasurer a few years ago. Good debt is used to invest in assets that generate a return and help the economy over the medium term – like infrastructure. Bad debt is used to finance recurrent spending.
The drivers of the lift in the government borrowing requirement provides one way of judging government debt. The contribution from recurrent activities has slipped back into deficit (Chart 7). But this requirement is wound back quite quickly while borrowing for capital spending remains well above normal levels.
The shift to more government investment spending is a positive move. It confirms that the ‘debt is evil’ mantra of recent years has finally been dispatched. The economy will benefit. Borrowing money to invest in long-life assets and paying interest is a fair way of sharing the costs of those assets with future users.
The consensus is that fiscal stimulus is probably more effective at low interest rates because the risk of ‘crowding out’ private sector activity is quite low.
The rise in public debt: GDP ratios looks sustainable over the longer run. For the mathematicians, sustainability requires the interest rate on government debt to remain below the growth rate in nominal GDP. This outcome looks all but certain (Chart 8).
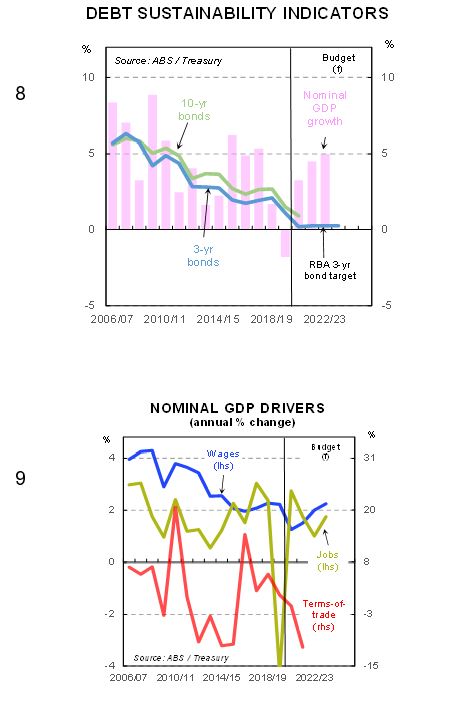
The RBA currently has a target of keeping 3-year bond rates around the cash rate (of 0.25%). The Bank is effectively guaranteeing that rates at the shorter end of the yield curve will remain at 0.25% over the next three years. More recently, RBA Deputy Governor Debelle raised the idea of extending the RBA’s target rate further out along the yield curve. Budget figuring assumes nominal GDP growth after the COVID-19 slump will run at 4 – 5% p.a. So, the sustainability condition is met.
The Budget as a policy plan.
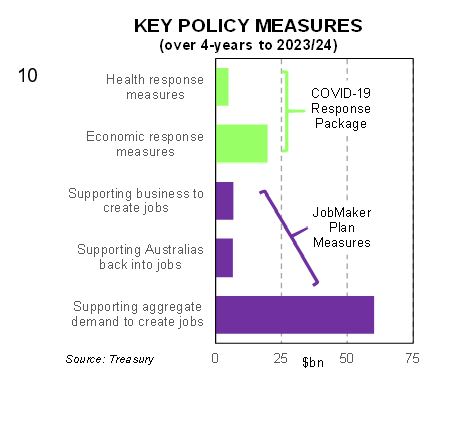
In the end it is all about nominal GDP growth. Nominal GDP is effectively the tax base. The key drivers are jobs, wages, profits and the terms-of-trade (or commodity prices). (Chart 9). These drivers have effectively shaped the Budget as a policy plan.
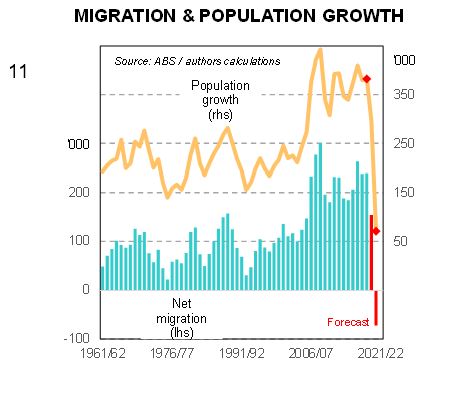
The ability to influence wages and profits directly is limited. And commodity prices are determined in global markets. The focus is on jobs (Chart 10). And if that point needs any further emphasis Treasurer Frydenberg managed to mention jobs 50 times in his Budget speech!
Fiscal policy is aiming to preserve current jobs and create new jobs to replace those lost. And the new and existing measures will help. Indeed, the Government and Treasury economists deserve credit for going against their natural inclinations and turning on the fiscal taps.
The decision to allow the automatic stabilisers free rein is the correct one against an uncertain economic backdrop. Part of this package, however, should include the flexibility to extend JobKeeper beyond the current end March 2021 termination date if needed.
The desire to transition from JobKeeper/Seeker to JobMaker is understandable. And a ‘job’ should always be financially more attractive than ‘welfare’. So, the proposed wage subsidy for younger workers is a solid option. Nevertheless, the opportunity should have been taken to fix up the long-running issues with support for the longer-term unemployed. Lifting JobSeeker payments to a more realistic level is necessary and desirable.
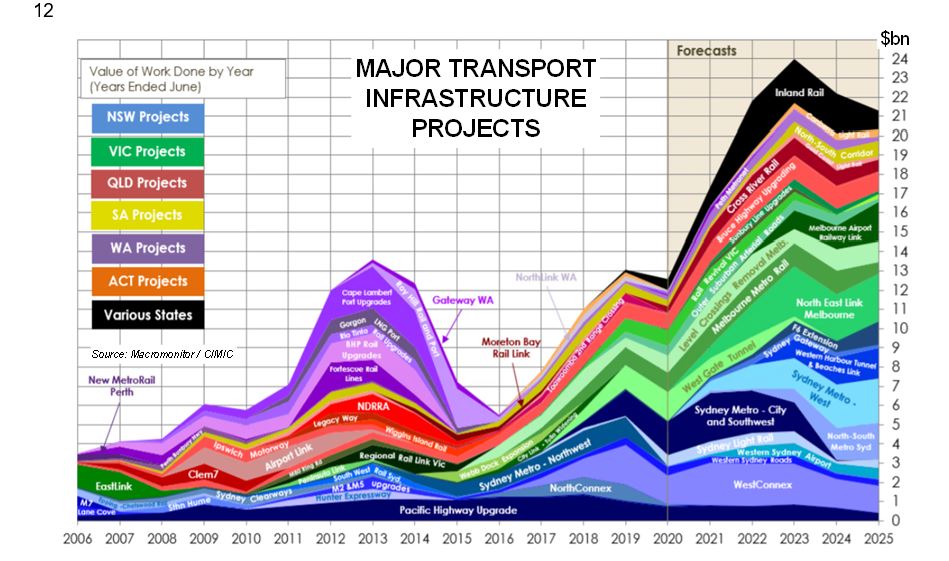
The start-up tax incentives and insolvency changes for small business are smart policy given their critical role in creating jobs. The expansion of the first-home owner scheme, lending reforms and the HomeBuilder program fit into the same category. They will help preserve jobs in a sector hard hit by the sharp slowing in population growth. A lack of spending on social housing, however, looks like a missed opportunity.
Net migration accounted for 60% of population growth over the past five years. The resultant population growth of 1.5 – 1.7% p.a. put Australia at the top end of growth among the advanced economies. That growth rate will now plunge to more like 0.2% in 2020/21 (Chart 11), the slowest rate of increase since 1916!
What is also pleasing is that some Budget measures will help the economy over the medium term as well as the short term. Infrastructure is a case in point.
Economist love infrastructure because it does generate activity and jobs. But it also lifts productivity. And that lift in productivity is necessary to boost incomes and set the economy up for the longer-term challenges facing the economy such as the aging population and climate change.
The problem with infrastructure spending is the lags. Big projects take time to get underway. And the benefit typically arrives too late. So, the plan to direct infrastructure funding to those States that can get the money out the door the quickest is quite clever. But it still butts up against the mountain of work-yet-to-be-done on existing infrastructure projects (Chart 12).
One alternative would be to go ‘small’ rather than ‘large’. The latest State of the Assets report for the Australian Local Government Association shows some $30bn of local government assets are in poor condition or no longer fit for purpose. (Chart 13). Directing funds to maintaining and refurbishing the existing stock of infrastructure could deliver big gains to local communities. Many of these projects would be in rural and regional areas that would clearly benefit from the spending. Some infrastructure projects funded in the Budget fit in with this approach. 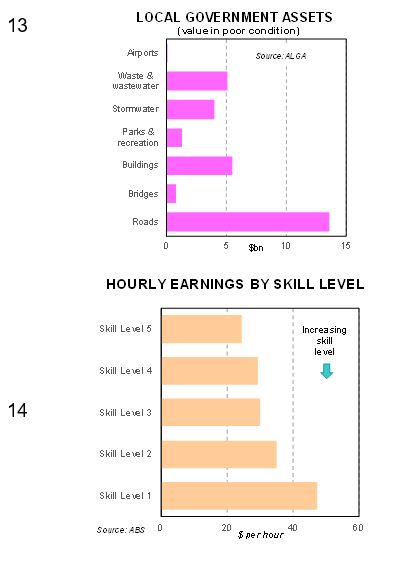
The capital stock that drives output and productivity is more than just the hard-edged stuff that politicians like to open. Investment in human capital is also important. So, the Budget plans to boost apprenticeship training, CSIRO funding and R&D incentives is welcome. It’s a truism that earnings rise with skill levels (Chart 14).
The capital stock also needs to be used efficiently. Growth in output per unit of capital stock in recent years has run below the pre-mining boom average. One way to lift efficiency would be to use the capital stock more intensively by lifting labour force participation. There are many studies showing Childcare is a major stumbling block. ABS surveys, for example, report that access to and financial assistance for childcare are major incentives for labour force participation. From that perspective there is some growth in childcare funding that will help at the margin.
Part of the jobs focus involves the new Modern Manufacturing Strategy. Economists are generally against Government’s trying to pick winners. But some of the chosen sectors – such as food & beverage manufacturing and pharmaceutical products – already have some momentum so look like safe choices. Exports in the targeted areas, for example, are already growing rapidly (Chart 15).
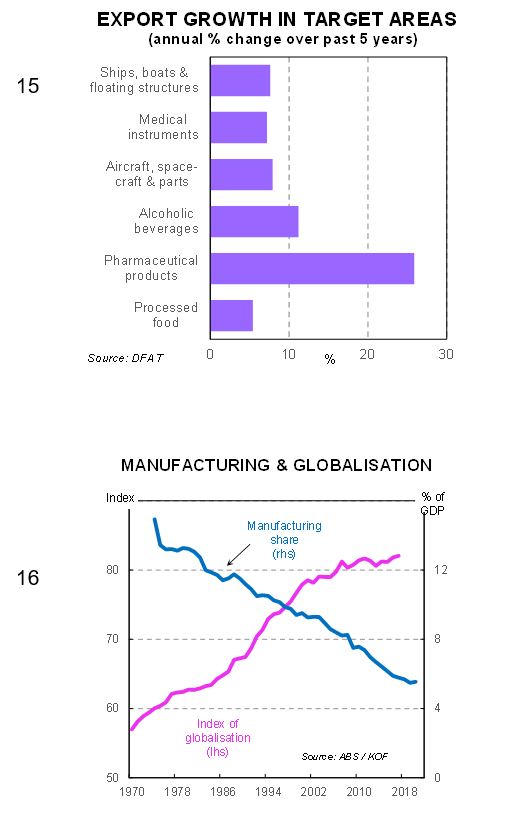
A focus on manufacturing should play out well politically given the rising concerns about globalisation. And the disruption to global supply chains triggered by the virus. Many companies, for example, discovered that ‘just-in-time’ inventory management was in fact ‘just-too-late’!
It is certainly true that the manufacturing sector has declined as Australia’s participation in globalisation increased (Chart 16). But we need to be careful not to throw the baby out with the bathwater. That same increase in globalisation played a major role in boosting living standards.
Households are also expected to help with job creation. And the decision to bring forward some of the already scheduled tax cuts is something economists have proposed for a while now. The provision of a one-off additional benefit via the low-and-middle-income-tax offset will mean the boost to disposable income will be even greater. Additional support payments to pensioners will help as well.
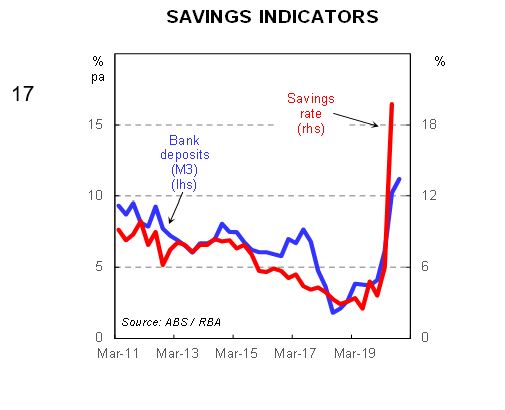
Tax cuts boost the ability to spend. But will the appetite to spend follow suit? In uncertain times the risk is that households choose savings over consumption. And there are indications that was the fate of earlier stimulus payments. The household saving rate spiked higher in mid 2020 and is at the highest level since 1974 (Chart 17). Growth in bank deposits suggests savings has increased further in the second half of the year.
The main Budget disappointment, therefore, relates to the lack of triggers that will turn fiscal stimulus on paper into fiscal stimulus in the real world. Easy to say. But the critics also need to suggest a solution. I’ve suggested previously that one approach would be to provide stimulus to households via pre-loaded credit cards or vouchers with a use-by date.
Some of the business-related measures are structured more favourably from a stimulus perspective. Examples include the explicit labelling of the capex tax incentive and the loss-carry back as ‘temporary’. The ‘use it or lose it’ warning for State infrastructure spending is in a similar mould.
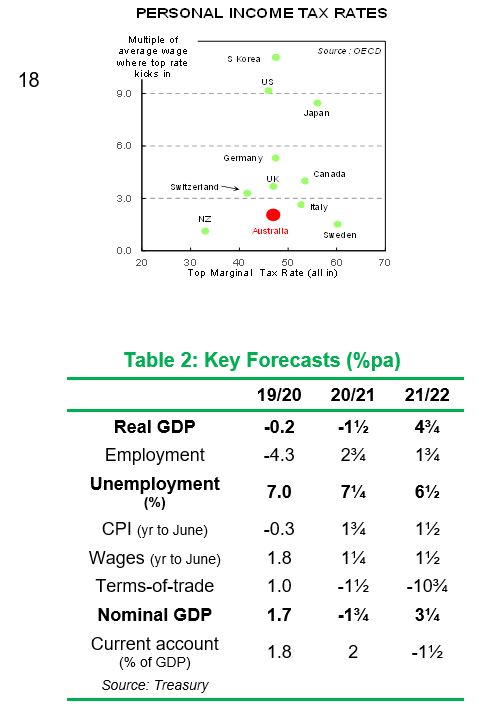
Stimulus issues aside, the tax cuts should be welcomed for other reasons. Tax reform is critical to productivity growth more generally. The current personal tax system where the top marginal rate (of 47% all in) cuts in at a very low multiple of average earnings (2.0 times) relative to other countries is a case in point (Chart 18).
The need for tax reform extends beyond personal tax. But the Budget remains silent on the question of company tax. The debate about lowering the rate remains mired in the politics. There is a case again for a more creative solution. I’ve noted before an earlier Japanese proposal to cut company taxes – but only for those companies paying higher wages and lifting capex. This mix is an interesting example of how the log jam could be busted.
The Budget economic parameters are summarised in Table 2. The economy is projected to contract by 1½% in the current year. A decent bounce is (optimistically) expected in 2021/22 but Australia’s growth potential has been damaged. It takes five years for the economy to get back to where it would have been without COVID-19. The unemployment rate peaks at 8% in late 2020 and remains above 6% until 2023/24. Inflation remains dead in the water.
This economic backdrop reflects the assumptions employed. Assumptions are a necessary evil in the forecasting process. But note that the current set of numbers is based on an assumption that a vaccine will be available next year. Fingers crossed.
Economists like to warn that the future is more than usually uncertain. And this means policy makers will need to remain fleet of foot. One positive is that Treasurer Frydenberg’s new fiscal strategy involves keeping the fiscal taps open until the unemployment rate is comfortably back below 6%. On the Treasury forecasts, that is unlikely before mid 2024.
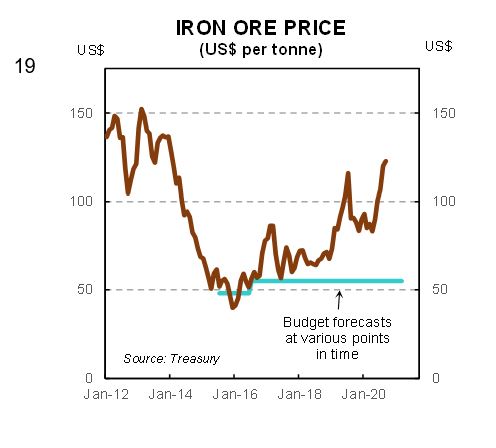
The other assumption to note relates to the iron ore price. The Budget assumes that prices will subside to US$55 per tonne by mid 2021. This subsidence has been a pretty standard assumption in recent Budgets. And it has always proved too pessimistic (Chart 19). The point is that a higher iron ore price can have a big impact on the bottom line (in normal times). Budget sensitivity analysis shows that a six-month delay in prices dropping to the US$55 assumption would boost nominal GDP by $25bn and tax receipts by $6bn.
The Budget as a political document.
The economic success or otherwise of the Budget will depend heavily on the politics. A positive reaction will make it more likely that the stimulus measures will prove effective.
Community concerns have shifted significantly during the COVID period (Chart 20). The regular IPSOS survey shows: 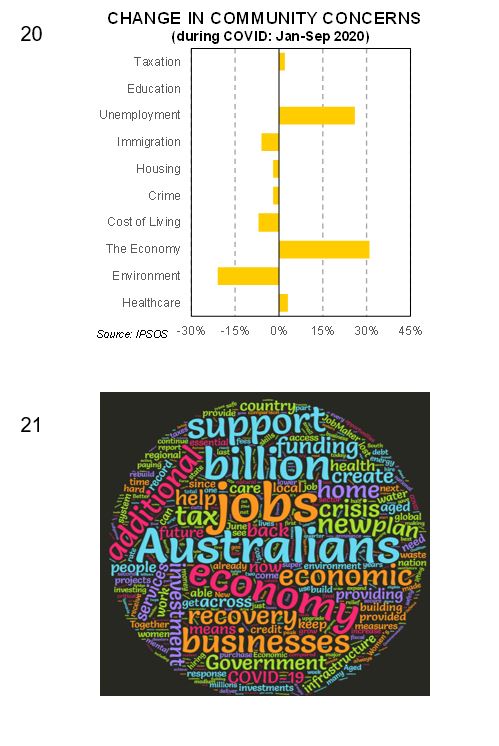
- concerns about the economy and unemployment have increased significantly;
- somewhat surprisingly, healthcare concerns are little changed and taxes are not seen as much of an issue; and
- as an indication of the fickleness of sentiment, concerns about the environment have been jettisoned.
The Budget should play well against this backdrop. It ticks a lot of the boxes.
A word cloud based on the Treasurer’s speech also underscores the point (Chart 21). Word clouds highlight key words and the frequency of their use. The larger the word, the more it has been used. The cloud shows:
- the central focus on ‘jobs’ very clearly;
- the usual patriotic appeal to ‘Australians’;
- the emphasis on power through the frequent use of ‘billion’;
- policy strength trough the focus on the ‘economy’ and ‘business’; and
- some words of reassurance like ‘recovery’, ‘support’ and ‘help’.
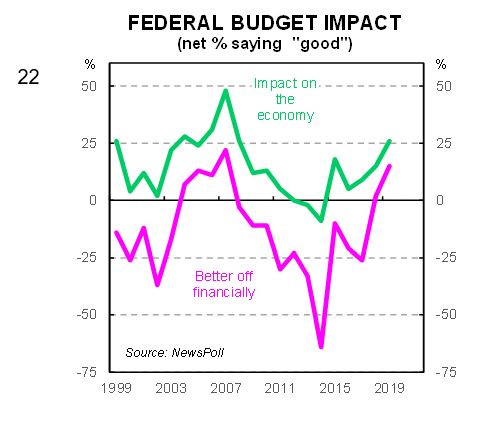
So, what to watch? A long-running survey by NewsPoll will give some guide to whether fiscal policy will work. Shortly after the Budget they survey households on whether they think the policy package will be good for the economy. And whether they will be better off financially. (Chart 22).
Recent Budgets have generally been seen in a favourable light. Let’s hope this one is too!
Meanwhile, I’m off to spend my tax cut!
CPD: Actuaries Institute Members can claim two CPD points for every hour of reading articles on Actuaries Digital.


