


Climate Change Scenario Analysis
The climate conditions we might encounter by the end of this century are wide and varied, according to various climate change models.
They vary from models predicting greener-than-green optimism in climate change mitigation trends for the remainder of this century, all the way through to pessimistic scenarios such as droughts doubling in length, or increases of more than seven degrees in temperature in Australia by 2100.
With modelling uncertainty inevitable, and the likelihood of outcomes widely variable, it would be prudent to consider a range of modelling results when assessing possible future conditions. Like the 120 or so climate scenarios developed collaboratively by expert climate and integrated assessment modellers, a subset of which is to be included in the 2021-22 Sixth Assessment Report (AR6) by the Intergovernmental Panel on Climate Change (IPCC).
A database complete with all model results is freely available here.
Some of these projections are more or less plausible than others. There are many middle-of-the-road scenarios mapping out a feasible mix of climate mitigation strategies and socio-economic futures. While less likely pathways include an idyllic existence at one extreme with rapid technology development and highly sustainable environmental policies, and a perilous fossil-fuelled regime at the other end, with high energy demand and no climate mitigation policies.
Consider therefore, the broad range of outcomes projected by these scenarios, in terms of greenhouse gas emissions levels, and temperature increases, through to 2100. Where 1870 is the baseline year for measuring increases in temperature.
Chart 1 focuses on CO2 emissions, which make up about three quarters of total greenhouse gas emissions. It plots projected global annual CO2 emissions for all 120 plus scenarios, from 2010 through to 2100.
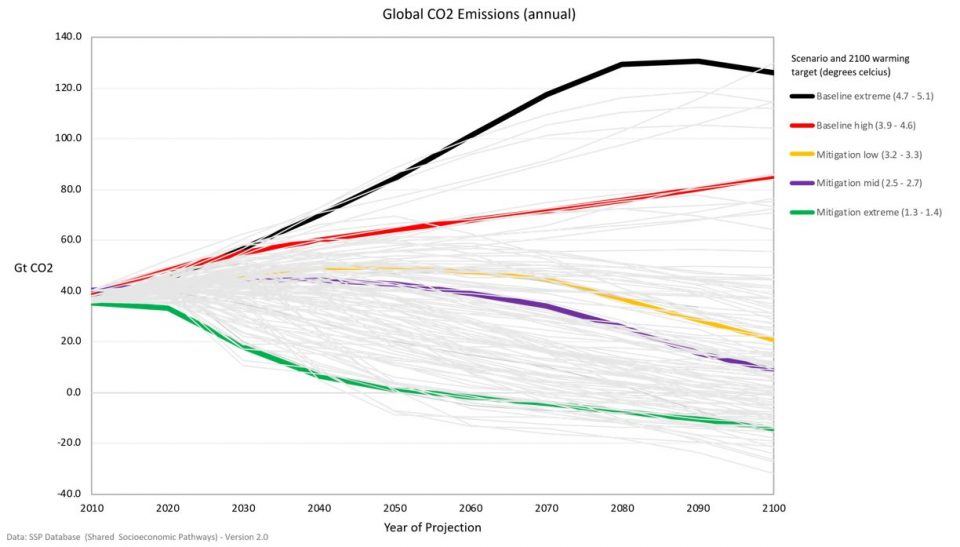
Five of these scenarios have been highlighted, being the thicker, coloured lines. All five represent different future socio-economic scenarios.1 The black and red lines reflect no climate change mitigation policy and are termed ‘baseline’. While the other three coloured lines reflect unique socio-economic scenarios, meshed with various climate change mitigation goals defined by climate forcing measures targeted by 2100.2 The chart shows that CO2 emissions vary considerably across different scenarios.
The extreme case black line depicts a high economic growth, fossil-fuelled, energy intensive scenario, resulting in a massive jump from about 37 gigatonnes (Gt) of CO2 annually in 2010 to 126 Gt by 2100, with global warming of 4.7 to 5.1 degrees. This worst-case scenario is an example of a future that is in fact, highly implausible. It exists merely as an extreme point, as a reference point for how bad things could improbably get.
At the other extreme is the green line where net CO2 emissions actually turn negative by the end of the century. This is a scenario that estimates warming of just 1.3 to 1.4 degrees by 2100. It is very much an aspirational mitigation target that envisions global equality in a renewable energy based economy, with low population growth. It would appear to be over optimistic given that we are on track to hit 1.5 degrees of warming or more, by as early as 2030.
In between these two extreme cases exists a multitude of scenarios that would seem more plausible and indeed, likely. Consider for example, the orange line scenario. This sees a temperature increase of between 3.2 and 3.3 degrees by 2100, and a modest 20.5 GtCO2 per annum. That is, a reduction in annual CO2 emissions from 2010 levels. This scenario factors in rapid progress on low carbon energy sources, despite increasing inequalities in global economic opportunities. It is a world primed for climate mitigation, hence warming is kept to less severe levels.
The purple line scenario forces a temperature increase capped at between 2.5 and 2.7 degrees. It is a low CO2 emissions outcome by 2100, depicting a world where socio-economic, and technology trends continue along much the same lines as those historically, with energy use and intensity declining over the century. Overall, it would be a reasonable climate change mitigation result, and together with the orange line scenario, would be considered a more likely possibility given current day policies. Noting these two results still fall well short of the 2015 Paris Agreement’s long-term goal to keep global warming well below a global average 2.0 degrees Celsius above pre-industrial levels, with efforts to pursue a limit of a 1.5 degree increase.
Finally, there is the red line possible outcome. It foresees a warming range of 3.9 to 4.6 degrees by century’s end, and annual CO2 emissions of up around 85 Gt per annum. This is a scenario assuming strong nationalism with resistance to global climate change mitigation, and a low priority for addressing environmental concerns internationally. This pathway is less likely, as it would imply a reversal to some extent, of some key current policies.
Another important measure is the timeframe by which certain temperature increase thresholds will be reached.
Chart 2 shows a scatter of the points in time at which each modelled scenario is projected to first reach temperature increase levels of 1.5, 2.0, 2.5 and 3.0 degrees, represented by four different lines on the chart.
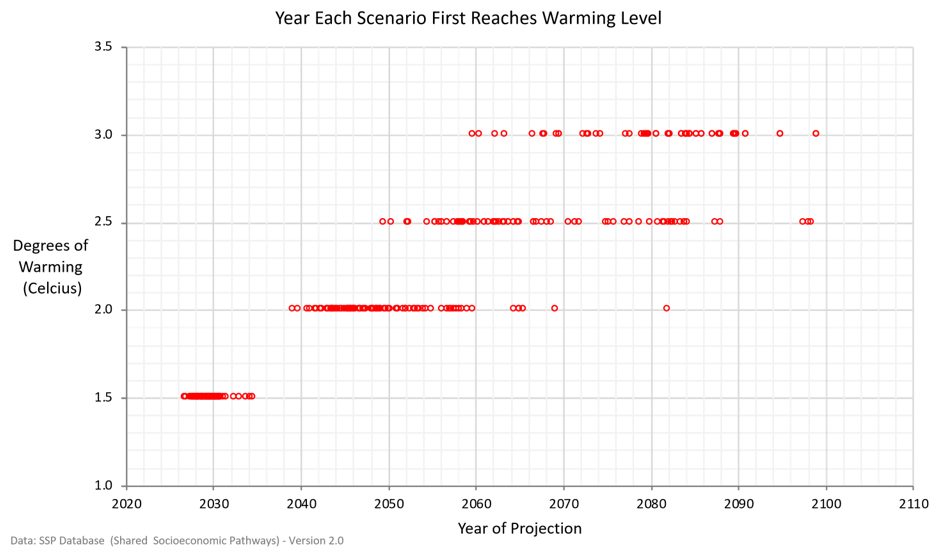
Measuring across all the modelled scenarios, the median year at which an increase of 1.5 degrees is projected to be reached is 2029. The earliest projected year it hits that level is 2027, and the latest is 2034. This is a narrow timeframe as shown by the tight scatter points on the 1.5 degree line, suggesting that a breach of 1.5 degrees is virtually independent of future socio-economic paths taken and climate change mitigation.
Independent in this context, meaning there is little room to move in terms of emissions targets to keep temperature increases less than 1.5 degrees, because it is cumulative historical emissions that dictate future temperature rises, and the 1.5 degree cumulative level is imminent. So it matters little whether models project increasing or decreasing emissions over the next ten years as far as hitting the 1.5 degree threshold is concerned, which should occur at or near 2030.
The 2.0 degree threshold sees a wide spread of results with temperatures crossing this level for the first time no earlier than 2039, and as late as 2069, if you exclude one outlier at 2082. The median point is 2048. As would be expected, there is a wider spread at this level of warming, with more room to move in cumulative emissions to date. So that the timing of hitting 2.0 degrees is quite dependent on future paths. The lower the challenges to mitigation, the later that temperature rise is reached.
The 2.5 degree line shows results wider still, with the threshold crossed earliest in 2049, up to as late as 2087, excluding three outliers. The median year is 2065. The degrees of freedom around this level of warming are greater again, with expected results even more dependent on future socio-economic pathways and mitigation strategies.
Finally, we have projected points in time at which 3.0 degrees of warming is first crossed. Note there are fewer points on this line, as many projected scenarios don’t get to 3.0 degrees before 2100. Nevertheless, of those cases that do, the spread is wide. The level is breached no earlier than 2059, and then as late as 2099, with a median expectation of 2080. The time taken to reach this level of warming is very dependent on future pathways. The more favourable socio-economically, and the greater the mitigation, the longer it takes to reach this threshold.
While there is a lot to absorb with these two charts, the important point to note is that there are a broad range of climate change scenarios that could unfold over the 21st century. That broad range reflecting not only uncertainties in the modelling itself, but also the uncertainty around collective global political action. Some scenarios are more likely than others, and some less likely. And in particular, it would be prudent not to give too much weight as to what could unfold at the extremes of those scenarios, focusing instead on the myriad of more likely scenarios in between.
Footnotes:
2. The various climate climate change mitigation levels meshed with the SSPs, are defined by so-called “radiative forcing” targets, which measures solar radiation absorbed by the Earth versus that radiated into space, measured in Watts per square metre. A positive net gain implies warming.
CPD: Actuaries Institute Members can claim two CPD points for every hour of reading articles on Actuaries Digital.


