


COVID-19 Mortality Working Group – Excess Mortality Rose in April 2023
Catch up on the Actuaries Institute’s COVID-19 Mortality Working Group’s latest analysis of excess deaths.
In summary:
|
Excess Deaths to 30 April 2023
Figure 1 shows the results of our analysis, comparing actual deaths each week to our predicted values and the 95% prediction interval.
Figure 1 – Weekly actual and predicted deaths – all causes
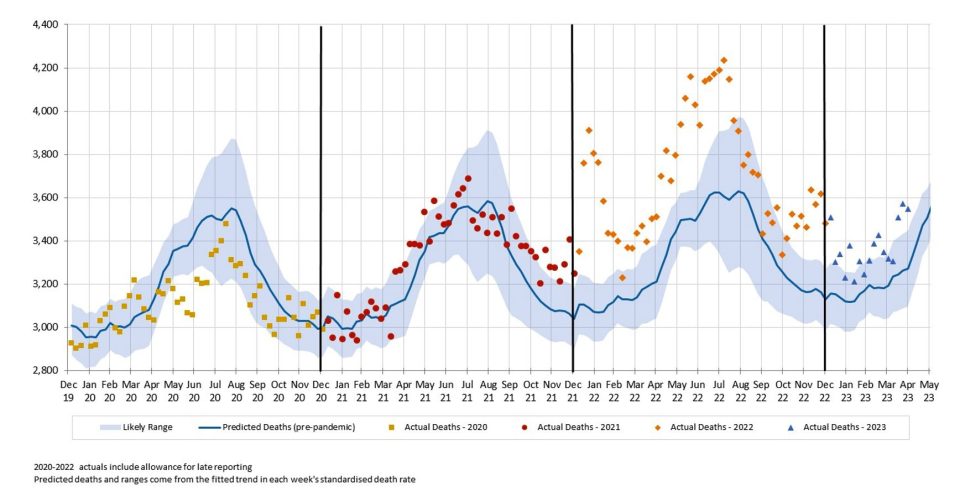
While the first two weeks of April are within the 95% prediction interval, the last three weeks were well above the upper end of the 95% prediction interval.
Figure 2 shows deaths from COVID-19 and COVID-19 related deaths, noting that, given small numbers, weekly data for COVID-19 related deaths is not available for 2020 or 2021.
Figure 2 – Weekly deaths from COVID-19 and COVID-19 related*
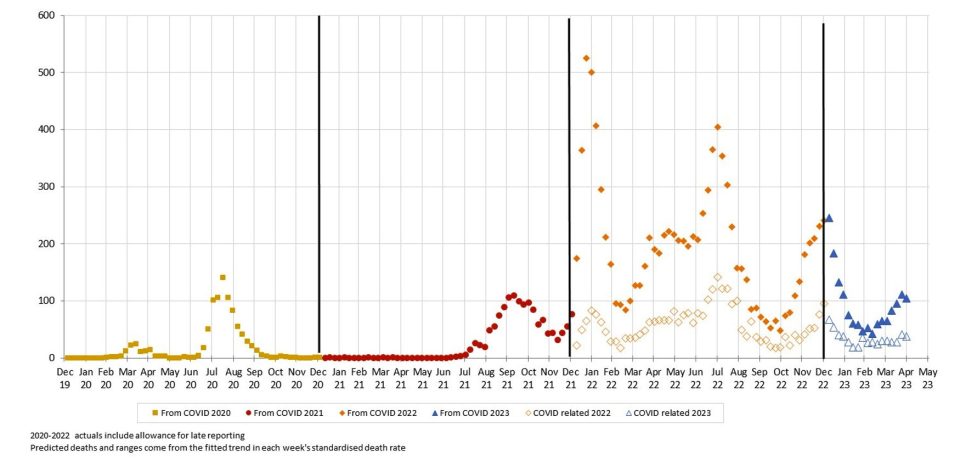
* COVID-19 data from ABS customised report 2023. Predicted COVID-19 deaths are zero as our baseline is intended to represent predicted deaths in the absence of the pandemic
Deaths from COVID-19 reached a low point in the first half of March 2023 before increasing again.
COVID-19 related deaths have broadly followed the same pattern as from COVID-19 deaths, however COVID-19 related deaths in the last 6-8 weeks have not increased to the same extent as from COVID-19 deaths.
Figure 3 compares actual and predicted deaths, after removing deaths from COVID-19 and COVID-19 related deaths.
Figure 3 – Weekly actual and predicted deaths – All causes excluding deaths from COVID-19 and COVID-19 related deaths
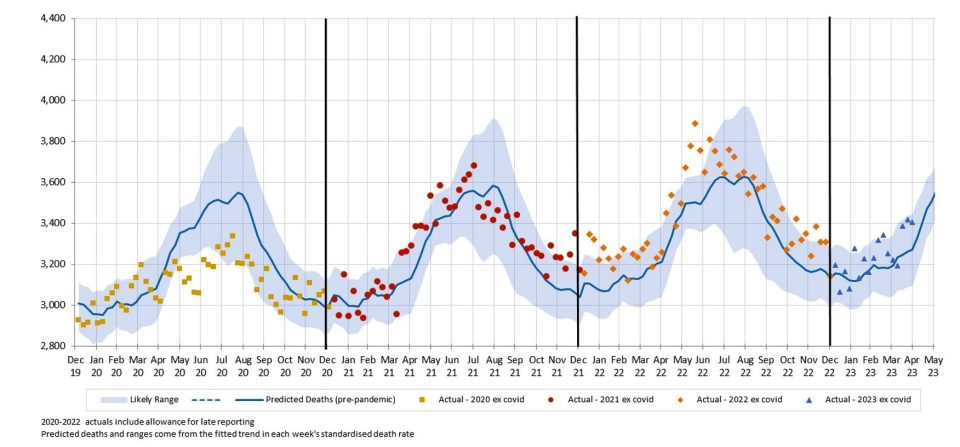
Non-COVID-19 deaths were close to the predicted level for the first two weeks of April 2023, and at the upper end of the 95% prediction interval for the last three weeks.
Excess deaths to 30 April 2023 by cause of death
Table 1 shows our estimate of excess deaths broken down by cause. We have shown the figures for the first four months of 2023 plus the full year 2022. We have shown actual deaths broken down onto those that are either from COVID-19 or COVID-19 related, and those without COVID-19 on the death certificate (“non-COVID”)[1].
Figure 4 shows the 95% confidence interval around the estimates for the 2023 year-to-date. We have shown the all cause excess for all deaths and also excluding deaths from COVID-19.
Table 1- Excess deaths in Australia – by cause of death for 2023 year-to-date and for 2022
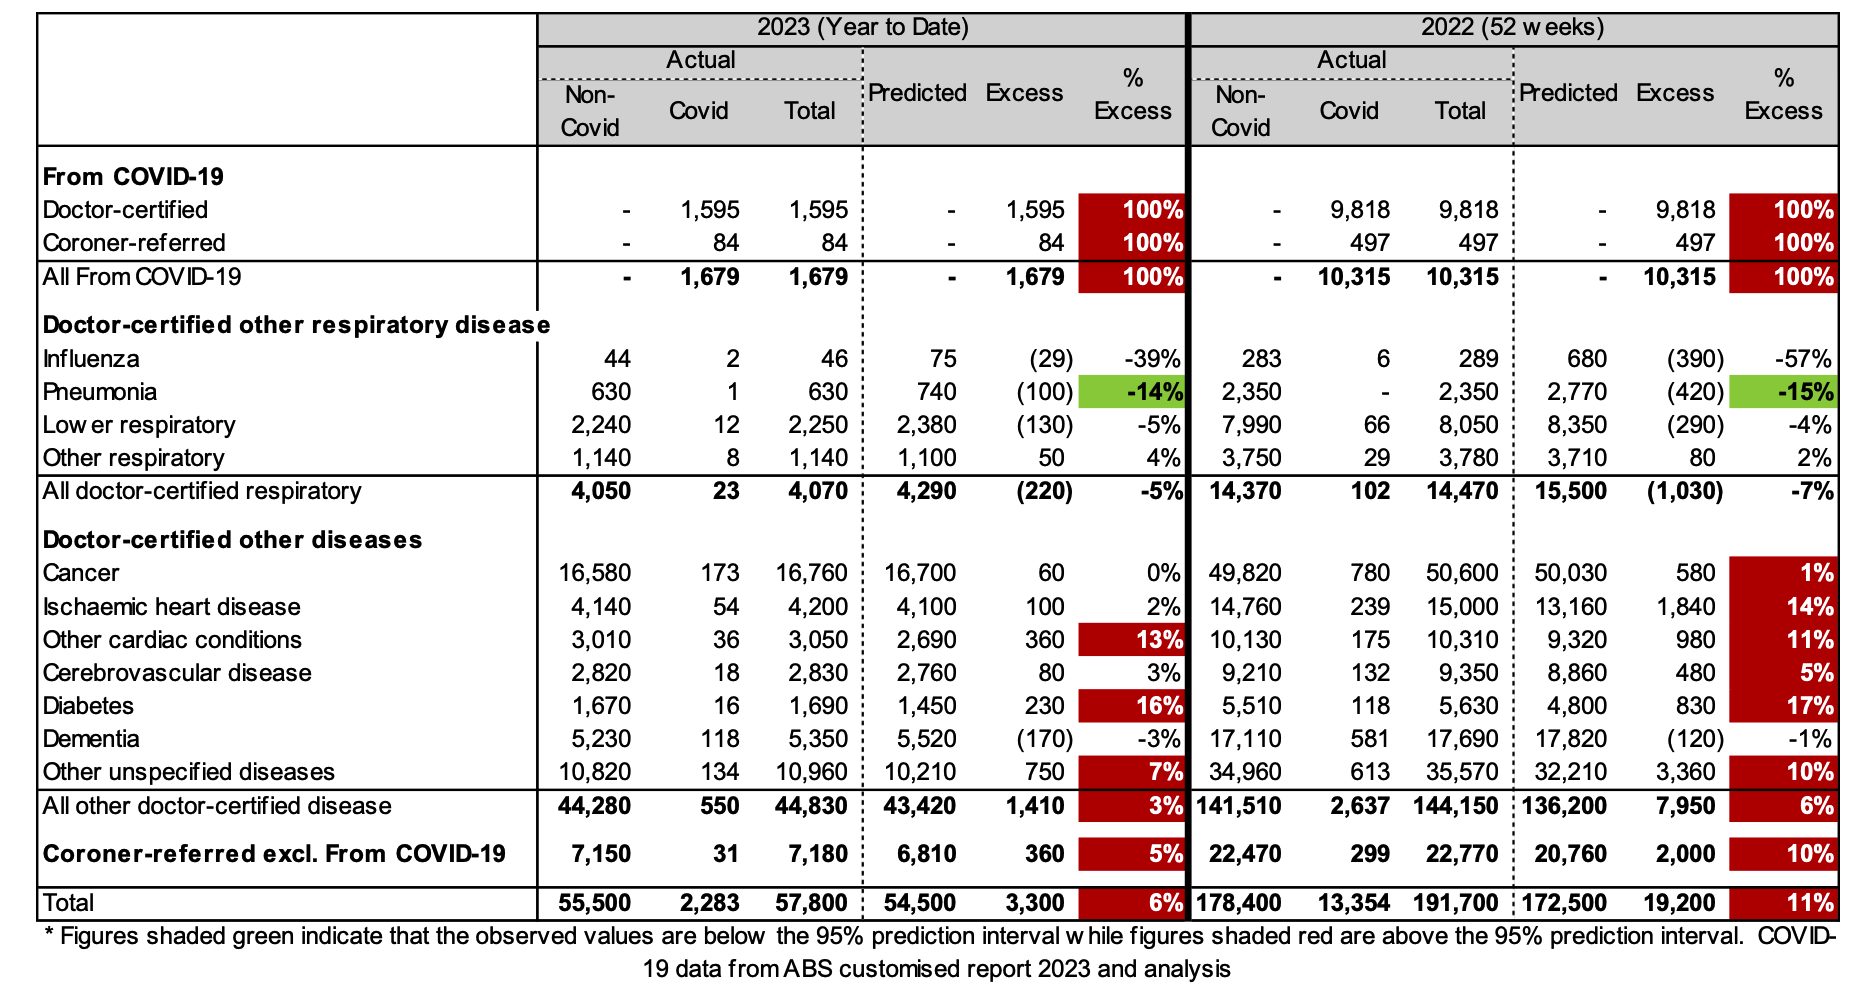
Figure 4 – Excess deaths by cause of death in 2023 year-to-date – 95% prediction intervals
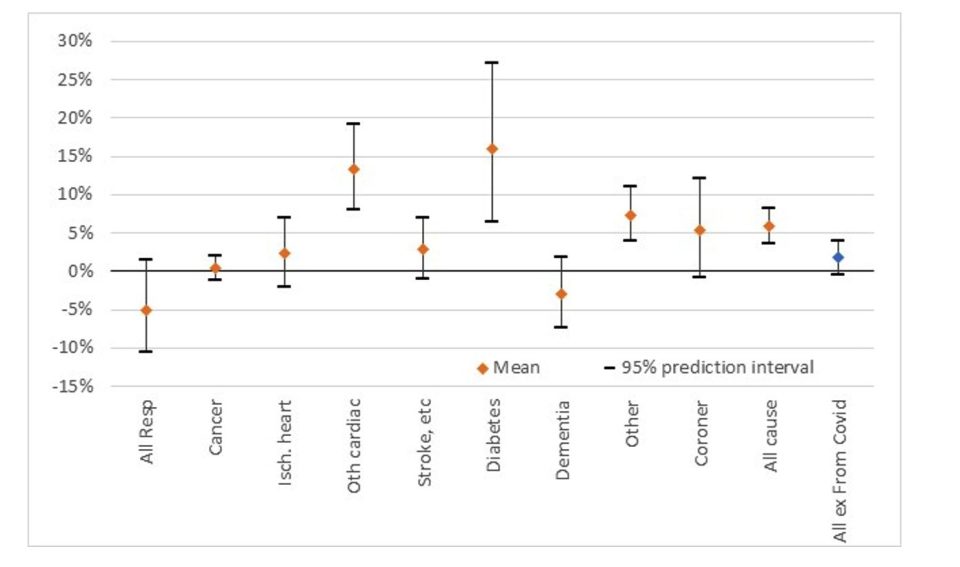
In the first four months of 2023:
- total deaths were 6% (95% CI: 4% to 8%) or +3,300 higher than predicted. 1,000 of these excess deaths occurred in January (7% excess), 500 in February (4% excess), 800 in March (6% excess) and 1,000 in April (7% excess);
- there were 1,679 deaths from COVID-19, representing 52% of the excess deaths;
- there were 604 COVID-19 related deaths included among the other causes of death (2,283 less 1,679), representing a further 19% of the excess deaths. The remaining 29% of excess deaths (c. 1,000) have no mention of COVID-19 on the death certificate; and
- doctor-certified deaths from other cardiac conditions, diabetes other unspecified diseases and coroner referred deaths were all significantly higher than predicted (by between 5% and 16%). Deaths from pneumonia were significantly lower than predicted (by 14%).
Figure 5 shows excess deaths (as a % of predicted) for each month of 2022 and 2023. The dotted lines indicate preliminary estimates of COVID-19 deaths and total excess deaths for May and June 2023 (based on the information contained in the ABS COVID-19 Mortality in Australia article). We have shown the total excess (blue) and the contributions of:
- deaths from COVID-19 and COVID-19 related deaths (orange), noting that Figure 2 showed that deaths from these two sources broadly move in the same pattern;
- deaths from respiratory disease (yellow); and
- deaths from all other causes (grey).
Figure 5 – Excess deaths (% of predicted) by month in 2022 and 2023
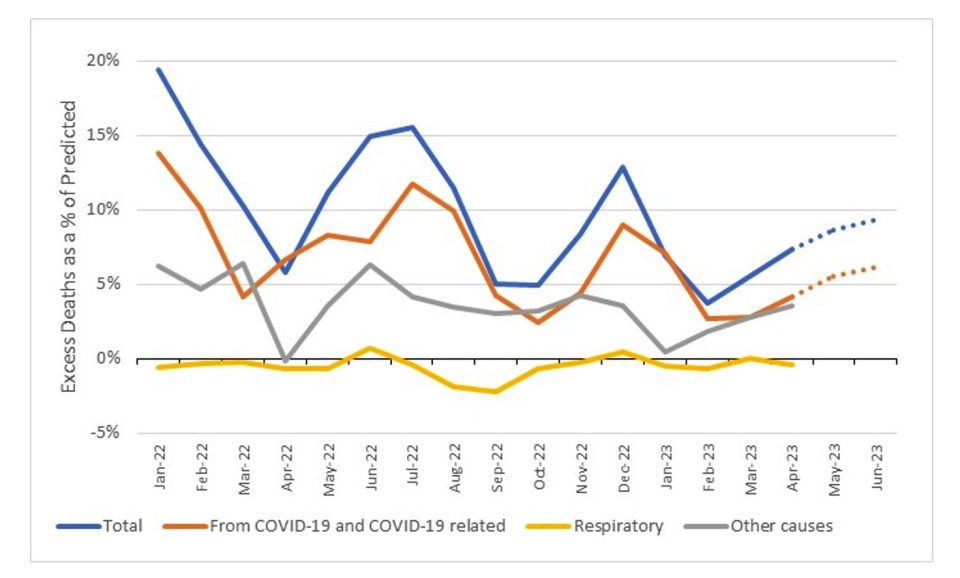
Deaths from COVID-19 and COVID-19 related deaths account for most of the excess mortality. Based on the preliminary COVID-19 figures for May and June 2023 and the persistence of non-COVID-19 excess mortality, we expect that total excess mortality for these months is likely to be around 8-9% (May) and 9-10% (June).
Deaths from respiratory disease have mostly been a negative contributor to excess mortality. We can see the impact of the early, lighter than average, influenza season in 2022 with a small contribution to excess mortality in June 2022, more than offset by high negative contributions in August and September 2022 (the months where influenza deaths usually peaked before the pandemic).
Excess deaths from other causes (i.e., non-COVID-19, non-respiratory), somewhat follows the pattern of COVID-19 mortality; it tends to be higher when COVID-19 (and respiratory) deaths are high and lower when COVID-19 deaths are low. However, the relationship is not 100% correlated – e.g., there was substantial non-COVID-19, non-respiratory excess mortality in September and October 2022 when both COVID-19 and respiratory deaths were relatively low.
Excess deaths to 30 April 2023 by age-band and gender
Table 2 shows our estimate of excess deaths broken down by age band and gender. We have shown the figures for the first four months of 2023 plus the full year 2022, with the contribution of COVID-19 deaths shown separately.
As discussed in our Research Note, we have to use a more approximate method to estimate excess deaths by age band/gender due to the data available. There are therefore small differences in the totals shown in Table 1 and Table 2. Our cause of death models represents our best estimate of the total excess mortality.
Figure 6 shows the 95% confidence interval around the estimates for the 2023 year-to-date, both including and excluding deaths from COVID-19 and COVID-19 related deaths.
Table 2 – Excess deaths in Australia – by age-band/gender for 2023 year-to-date and for 2022
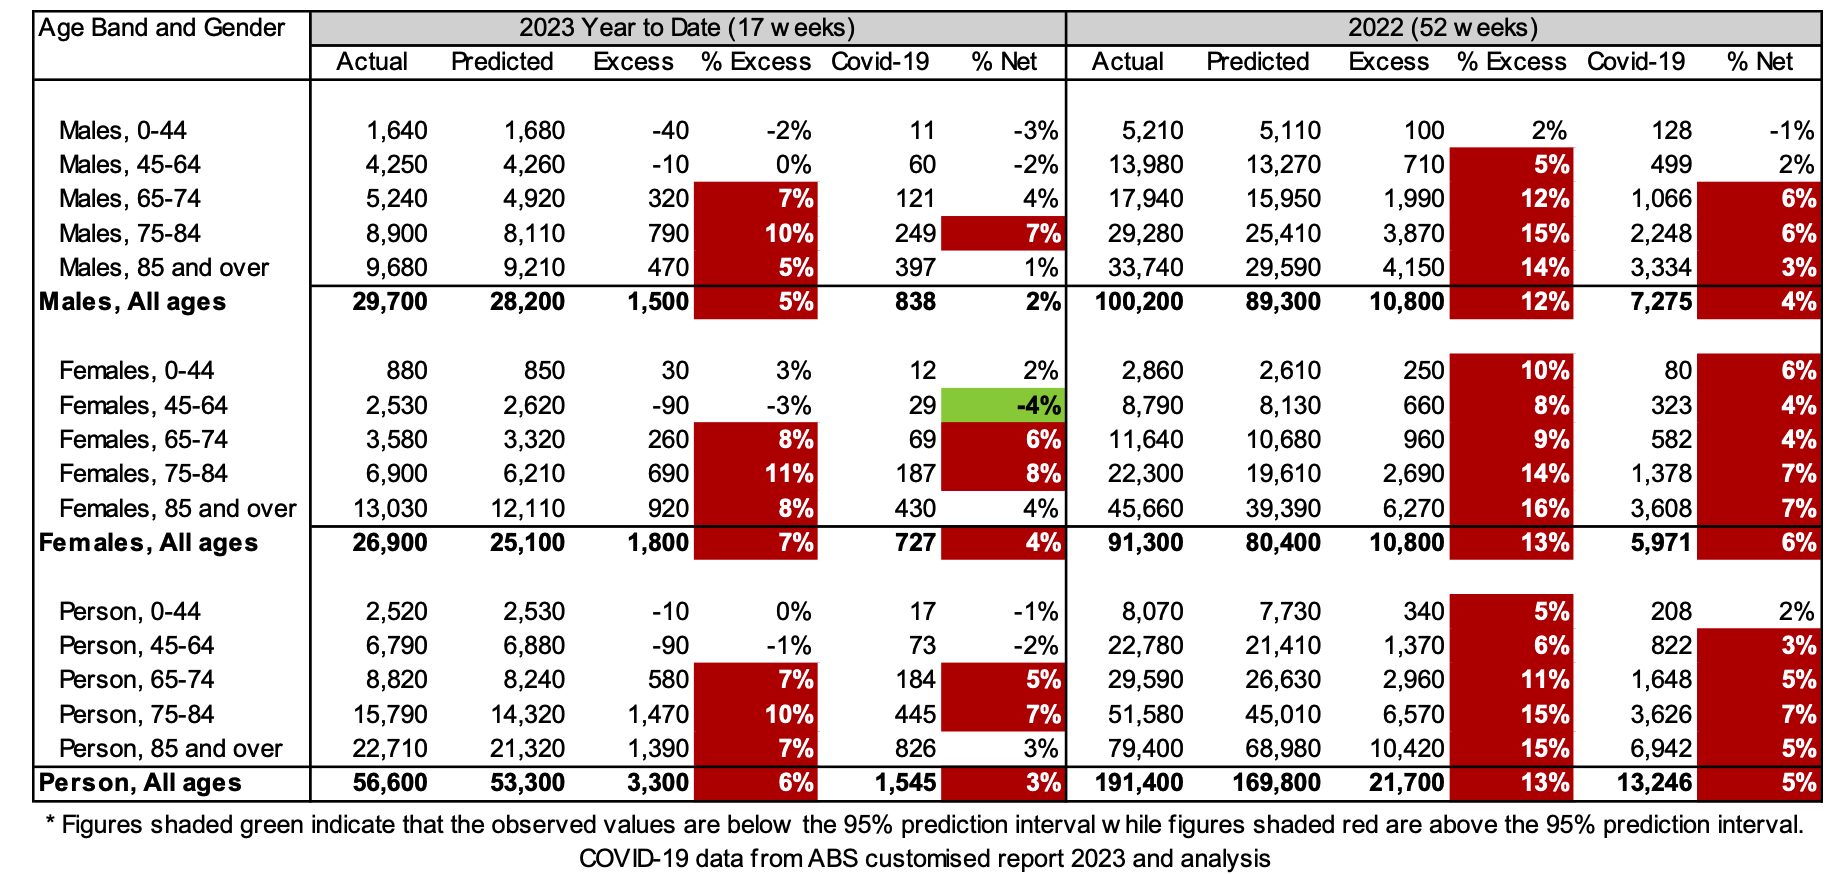
Figure 6 – Excess deaths by age-band/gender in 2023 Year-to-Date – 95% prediction intervals
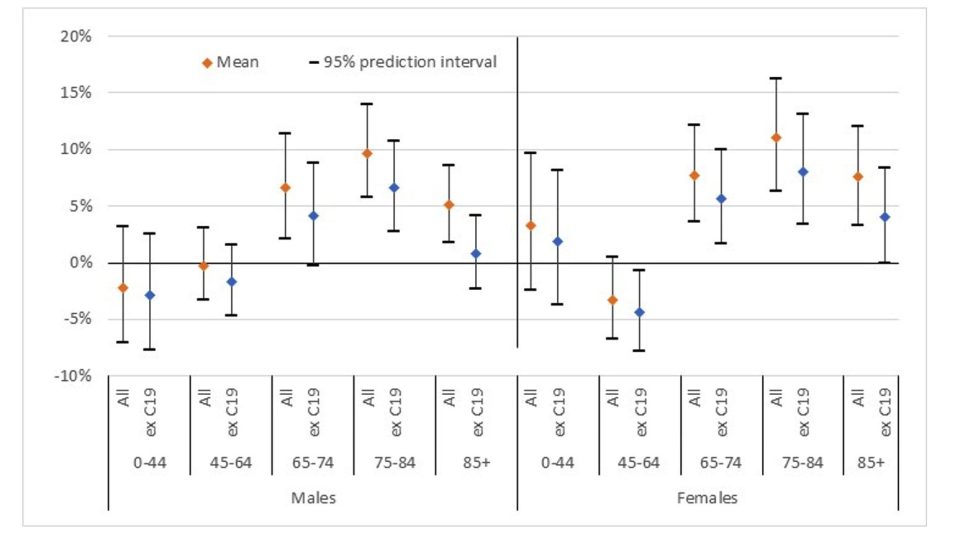
In the first four months of 2023:
- there is no significant excess mortality in the 0-44 or 45-64 age bands for either males or females;
- in the 85+ age band for both males and females, the excess mortality is wholly attributable to COVID-19; and
- for the 65-74 and 75-84 age bands, around one quarter to one third of the excess mortality is attributable to COVID-19. It is these two age bands where significant non-COVID-19 mortality is apparent in 2023, with a higher excess in females compared with males.
Data and terminology
The COVID-19 Mortality Working Group has examined the latest Provisional Mortality Statistics, covering deaths occurring prior to 30 April 2023 and registered by 30 June 2023, released by the Australian Bureau of Statistics (ABS) on 28 July. This release also includes the article COVID-19 Mortality in Australia, with details on all COVID-19 deaths occurring and registered by 30 June 2023.
We have used additional data supplied by the ABS in a customised report in relation to COVID-19 deaths registered by 31 May 2023, namely the total number of deaths each week (doctor-certified and coroner-referred) both from COVID-19 and COVID-19 related, defined as:
- deaths from COVID-19 are deaths where COVID-19 is listed as the primary/underlying cause of death; and
- deaths that are COVID-19 related are deaths where the underlying cause of death has been determined as something other than COVID-19, but COVID-19 was a contributing factor mentioned on the death certificate.[2]
Baseline predictions
We calculate excess deaths by comparing observed deaths to our “baseline” predicted number of deaths for doctor-certified deaths (by cause) and coroner-referred deaths (for all causes combined). As always, our intent is for the baseline to reflect the expected number of deaths “in the absence of the pandemic”.
The derivation of our baselines and a fuller description of our methodology is documented in our recently released Research Paper. In short, our baselines by cause of death are set by extrapolating linear regression models fitted to Standardised Death Rates (SDRs), which are then re-expressed as numbers of deaths. That means that our baselines allow for changes in the size and age composition of the population, plus the continuation of pre-pandemic mortality trends.
Disclaimer
This monthly COVID-19 mortality analysis is intended for discussion purposes only and does not constitute consulting advice on which to base decisions. We are not medical professionals, public health specialists or epidemiologists.
To the extent permitted by law, all users of the monthly analysis hereby release and indemnify The Institute of Actuaries of Australia and associated parties from all present and future liabilities that may arise in connection with this monthly analysis, its publication or any communication, discussion or work relating to or derived from the contents of this monthly analysis.
COVID-19 Mortality Working Group
The members of the Working Group are:
- Karen Cutter
- Jennifer Lang
- Han Li
- Richard Lyon
- Zhan Wang
- Mengyi Xu
References
[1] As in our previous work, we have estimated the number of coroner-referred COVID-19 deaths based on the experience of late 2021 and the emerging experience in 2022. If our estimate of coroner-referred COVID-19 deaths is too high (or low), this will not affect the total level of excess deaths measured; it will just mean that our estimate of non-COVID-19 coroner-referred deaths will be too low (or high) by the same amount.
[2] The COVID-19 deaths covered in this article are distinct from “incidental COVID-19” deaths, namely deaths where the person was COVID-19 positive at the time of death, but COVID-19 was not recorded on the death certificate. These deaths are generally included in surveillance reporting where identified (other than where there is a clear alternative cause of death, such as trauma) but are not separately identified in the ABS statistics.
CPD: Actuaries Institute Members can claim two CPD points for every hour of reading articles on Actuaries Digital.


