


Can superior investment performance beat lifetime annuity/pension income?
Many investment professionals hold the view that annuities are poor value. When they talk about longevity protection, they think of traditional annuities – which shield customers from both investment risk and longevity risk. Guaranteeing both is indeed costly and risky to provide but does not have to be the case.
Annuities can be unbundled. This article shows an example of a product where investment performance flows through to the member, but longevity risk is insured. It is important that superannuation professionals, financial planners etc. know about alternative retirement products that are available to maximise member outcomes.
Some products can help members address specific risks, such as longevity, while still letting them take on the investment risk.
A Worked Example
Let us consider a 70-year-old single male who has $300,000 in superannuation. Chart 1 below shows a year-by-year projection of his income from superannuation at each age in today’s dollars. The projection assumes a 6.5% per annum gross return and 2.5% per annum inflation. To highlight longevity risk, note that 25% of these 70-year-old Australians are expected to die somewhere within the range shown by the red arrow.[1]
The black lines show the projected income from a typical account-based pension (ABP) product in retirement. The member is assumed to draw income based on the minimum account-based pension rules – to try and avoid the risk of outliving their savings. An assumption of 0.6% per annum of assets was made for administration, trustee, and investment etc fees.
If he put all his superannuation balance into a traditional annuity, then based on market rates[2], he could purchase an inflation-linked lifetime income of $17,664 per annum. This is shown by the orange line on the chart. But if investment performance is greater (or lower) than 6.5% per annum, the member would not benefit from any upside (or suffer from any downside).
We can unbundle the lifetime income product to only provide longevity protection but still pass on investment performance to the member. The blue lines in Chart 1 show projected income from an investment-linked lifetime income design[3] that superannuation funds can white label as part of retirement income strategies. The member is assumed to keep the same investment mix as the ABP – and enjoys the same gross investment return and fees of 0.6% per annum of assets. An additional fee of 0.5% per annum of assets was made for longevity protection.
A lump sum is payable if the retired member dies earlier in retirement, which helps to ensure they receive at least their initial investment back (including total income paid to date). The cost of this death benefit reduces the income slightly.
Chart 1: Retirement Income Projections based on 6.5% gross return
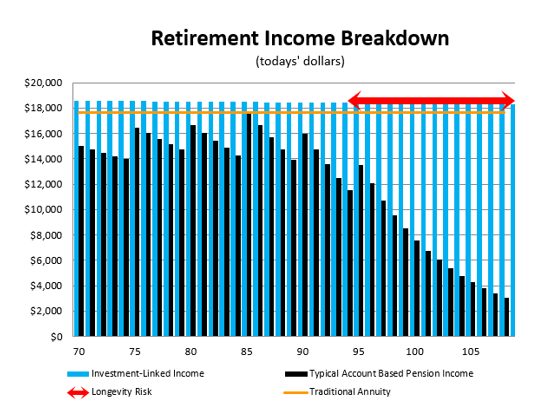
You can see that both the lifetime annuity and lifetime investment-linked design deliver a higher year 1 income than the ABP. Based on a 6.5% p.a. gross investment return they also both deliver higher income for life that will not run out.
The way these products outperform the ABP is by re-purposing the death benefits that would otherwise be paid out to beneficiaries, particularly in respect to members in their 80s and 90s[4]. This money is instead used to maximise retirement income for the survivors.
ABP drawdown with ‘run out’ age 92
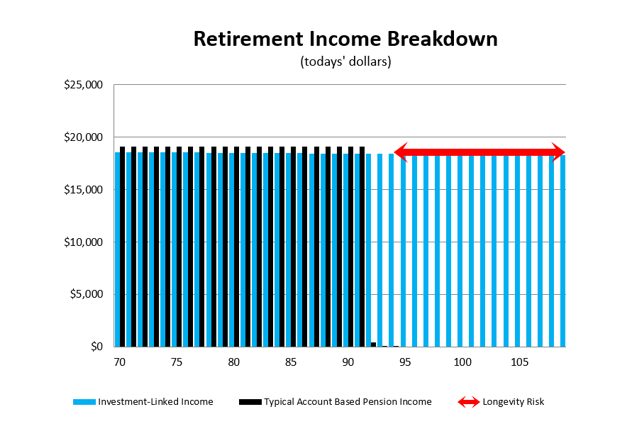
Some retirees may decide to draw down the balance at a faster rate than the minimum rules to get a higher income. For our 70-year-old this delivers more income up to, and slightly past, average life expectancy as per Chart 2 below. But if he is in the large and increasing number of retirees who live longer than this then he would run out of income.
It is important to know that over half of couples who retire today will see one spouse live to age 95[5] and data shows that those with higher balances are more likely to be in the longer living groups. Research that was highlighted in the Retirement Income Review indicates that retirees are uncomfortable drawing down their account balance quickly[6]. This makes sense in order to minimise longevity risk i.e. outliving your savings. Retirees know that some people live to the ages shown by the red arrow in these charts, and it could be them!
In Chart 2, the ABP drawing level was set in order to consume the person’s entire balance by age 92 (based on a 6.5% gross return). The investment-linked design in Chart 2 is the same as Chart 1. Here the investment-linked product pays a similar but slightly lower level of annual income to this modified ABP. But once the ABP is exhausted, the investment-linked product continues paying income for life.
Fewer people are still alive at these higher ages, but trustees should be catering for the Best Interests of all members and thus all potential lengths of life – as less than 3% of retirees die at their life expectation – NOT 100%.
Chart 2: ABP drawdown with ‘run out’ age 92
The impact of high investment performance
Where investment managers use a strategy to achieve relatively high investment performance this should improve the benefits for both the ABP and the investment-linked design. Chart 4 shows how each product would perform if the gross return were 8.5% per annum instead of 6.5% per annum.
Chart 3: Retirement Income Projections based on 8.5% gross return
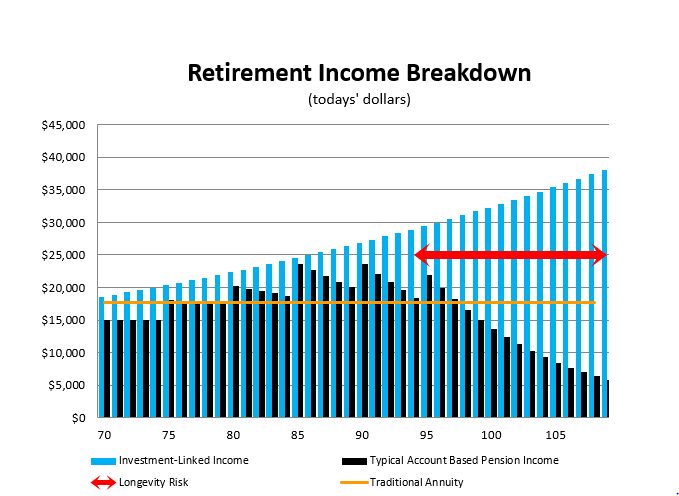
Such relatively high investment returns are difficult if not impossible to achieve over such a long term of many decades. The effect is to develop an increasing amount of income.
Death benefits
It is important to note that product design can be used to increase the total retirement income delivered by any level of ABP investment performance. The Retirement Income Review noted that ABPs ultimately pay some 38%[7] of their assets as death benefits to people who are not members. But is this the purpose of superannuation or an Unintended Consequence of ABP design (rather than income to retired members)?
Products that can capture this ‘leakage’ can deliver even higher retirement incomes to those that need them. Each of us has only one life – so each retiree might as well enjoy what is left of their life (their children should insist on this). Regular income helps maintain health and increase lifestyle and thus happiness.[8]
Table 1 shows a comparison of an ABP product and an investment-linked income product for 1,000 retirees like our male above. It shows the total projected balances over time, total income payments made, and total lump sum death benefits paid from each product in each future year.
Table 1: Comparison of outcomes at Product Level[9] [10] [11]
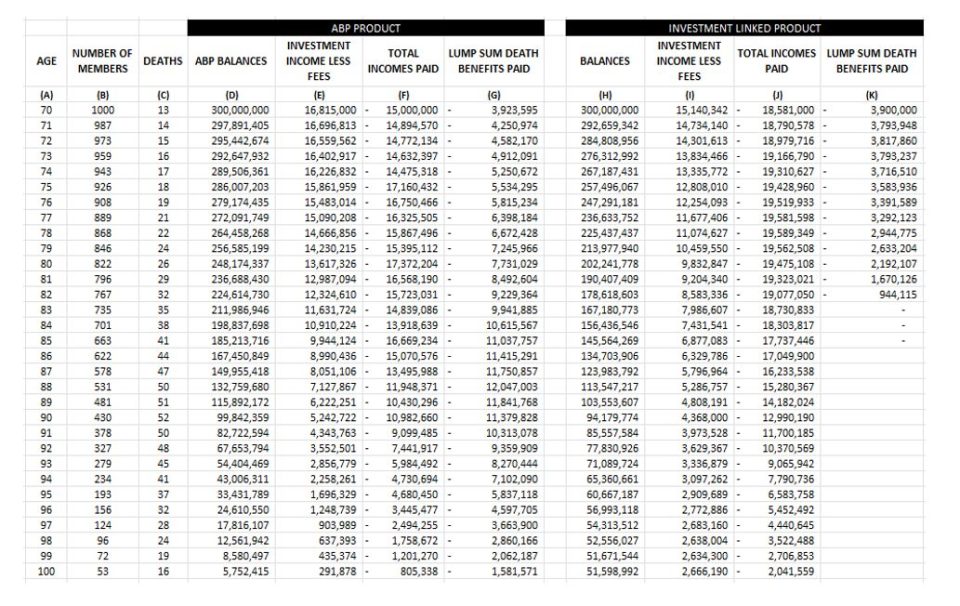
You can see from Table 1 that:
- The Investment-linked product pays higher total incomes (column J) at all ages than the total income from this ABP (column F).
- The ABP product pays out more total death benefits at each age (column G) than the investment-linked product (column K). However, the present value at inception of both products is the same i.e. they provide the same value of benefits but in different ways.
- Whilst the investment-linked product does pay a lump sum benefit (to protect against an untimely death until total annuity payments exceed the purchase price), the total assets used for this is lower
- In this example, the investment-linked product still has a significant reserve remaining at age 100 (column H). This is because the starting income level of this product allowed for healthier lives than average – i.e. it allows for people living longer than assumed in column C which was based on Australian Life Table mortality rates. If healthier people are the ones who tend to choose ‘lifetime’ retirement products – then this reserve would be needed to fund their incomes as their lifespans are likely to be more than average.
There seems to be a growing consensus in Australia about not paying death benefits from superannuation in old age (e.g. after age 80). Often retirees have other assets to leave as an inheritance, including the home and other personal assets. Therefore, the member outcomes in column G of the table may not appear to be in the retired members’ best interests.
Conclusion
Expert investing can add a lot of value for retirement products. But those who believe longevity risk can be managed via good investment performance using an ABP on its own, need to consider these issues very carefully – to ensure they act in the best interests of all retired members.
From 1 July 2022, trustees are required to maximise retirement income for their members. Paying significant death benefits (to non-members), when the retired member is over the age of 80 may not be in their best interests – unless it can be justified that death benefits to non-members are indeed a higher priority than income to retired members and their spouses. This does not seem to be the purpose of superannuation.
Research has shown that the 3 major things that retirees value are[12]:-
- Health –where you do not have good health, life is not as easy,
- Amount of income – so that a reasonable standard of living can be enjoyed in each future year of life, and
- An income that is regular and is payable for life6.
References
[1] Based on the Australian Life Tables 2015-17 with 25-year mortality improvement assumptions
[2] Based on Challenger Liquid Lifetime rates on 12 September 2022. https://www.challenger.com.au/personal/products/lifetime-annuities/lifetime-annuity-payment-rates
[3] Based on Generation Life’s LifeIncome rates with a 2.5% LifeBooster feature.
[4] Both products still pay a death benefit in the earlier years of retirement – to protect the member’s investment if they experience an untimely early death. However, most retirees die in their 80s and 90s and the benefit design at these ages is what matters most. https://www.actuaries.digital/2020/08/12/standard-deviation-around-life-expectancy-is-eight-years-what-this-means-for-retirees/
[5] https://actuaries.asn.au/Library/Miscellaneous/2020/RNLifeExpectancy.pdf
[6] Retirement Incomes Review Final Report. Pages 19, 56, 159, 415, 432, 440, 472, 486
[7] Around 30% if a discount rate is applied
[8] Annuities and Retirement Happiness – Towers Watson’s Insider, September 2012,
Launched in 1992 by the University of Michigan, the Health, and Retirement Study (HRS) is a longitudinal panel study of retirement. The study, upon which the Towers Watson analysis is based, surveys approximately 26,000 Americans over age 50 every other year on retirement issues, such as wealth, income, job history, health, and cognition.
[9] Assumptions for the ABP: 1000 males aged 65 with $300,000 in an ABP drawing income in line with the minimum percentages at each age. 6.5% gross return less 0.6% fees. They die in line with the Australian Life Tables (with 25 year improvement rates). Incomes are paid at the start of the year, death bens paid at the end of the year.
[10] Assumptions for the investment-linked product. Benefit design and rates are based on Generation Life’s LifeIncome product with 2.5% LifeBooster. 6.5% gross return less 1.1% fees. The projection shows 1000 males who die in line with the Australian Life Tables (with 25 year improvement rates). Incomes are paid at the start of the year, death benefits are assumed to be paid at the end of the year.
[11] Note that the present value of: incomes and death benefits paid, less fees, plus any reserves left over is the same for each product.
[12] Annuities and Retirement Happiness – Towers Watson’s Insider, September 2012
CPD: Actuaries Institute Members can claim two CPD points for every hour of reading articles on Actuaries Digital.


