


Home and away: Where do homeless people go?
At the 2022 All-Actuaries Summit, Laura Dixie and Hugh Miller presented their recent work on homelessness pathways, completed for the NSW Department of Communities and Justice in a publicly released report. This article introduces the topic and explores some of their findings, with significantly more detail in the full report for interested readers.
Introduction
Homelessness is a significant and growing problem. People with experiences of homelessness often have complex needs and challenges including low incomes, mental health issues and/or being victims of family and domestic violence. Understanding complex needs and life events that increase the chance of experiencing homelessness gives an opportunity to better design services and ultimately prevent people becoming homeless.
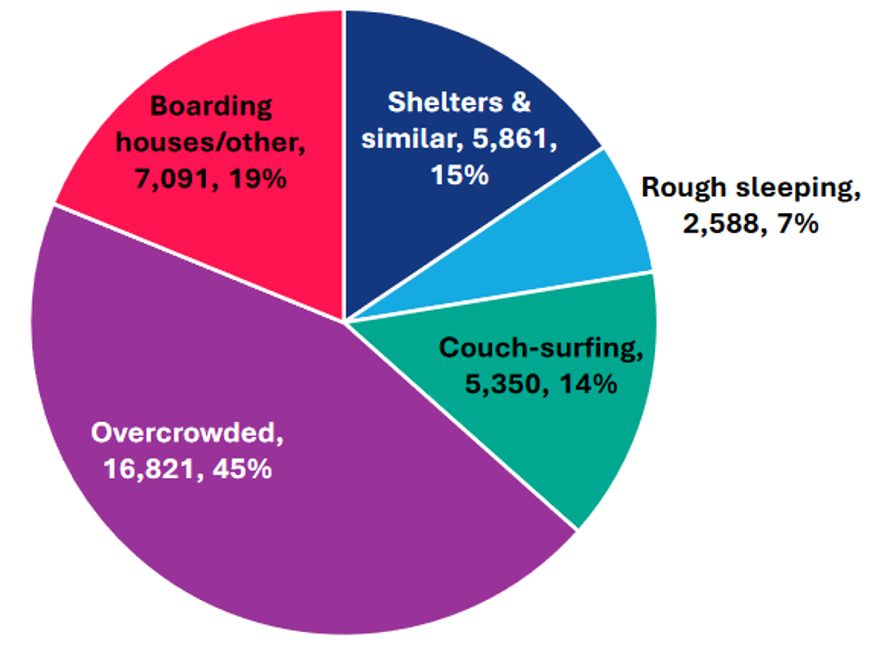
Homelessness is an important topic of research, but one that is hard to measure and where definitions are important. The Census attempts to estimate homelessness as a point of time snapshot. In the 2016 Census about 38,000 people were homelessness in NSW, about 0.5% of the population, were identified as homeless, which included people sleeping rough, couch-surfing, residing in shelters or boarding houses, and people in severely overcrowded dwellings.
Figure 1 – Census 2016 estimates of homelessness in NSW
 Outside of the census, many of these types of homelessness are invisible to government, making monitoring and policy development a challenge. One important proxy that we are able to use is presentations to services designed to support those that are homeless (or at risk of homelessness). Specialist Homelessness Services (SHS) are the network of government-funded providers (homeless shelters etc) that now has good centrally collected administrative data. Additionally, Temporary Accommodation (TA) support is provided by the NSW government for those in need of short-term accommodation. People interacting with these two services represents a proxy homelessness cohort that is useful for understanding homelessness.
The Pathways to Homelessness Project
Our research project aimed to improve the evidence base for early intervention. It was structured around four key research questions
- For people requiring homelessness support, which other government services have they used before?
- For people using other government services, how likely are they to require homelessness support?
- Among the people identified, what other risk factors affect their likelihood of using homelessness services?
- How do government service use costs differ for people requiring homelessness services?
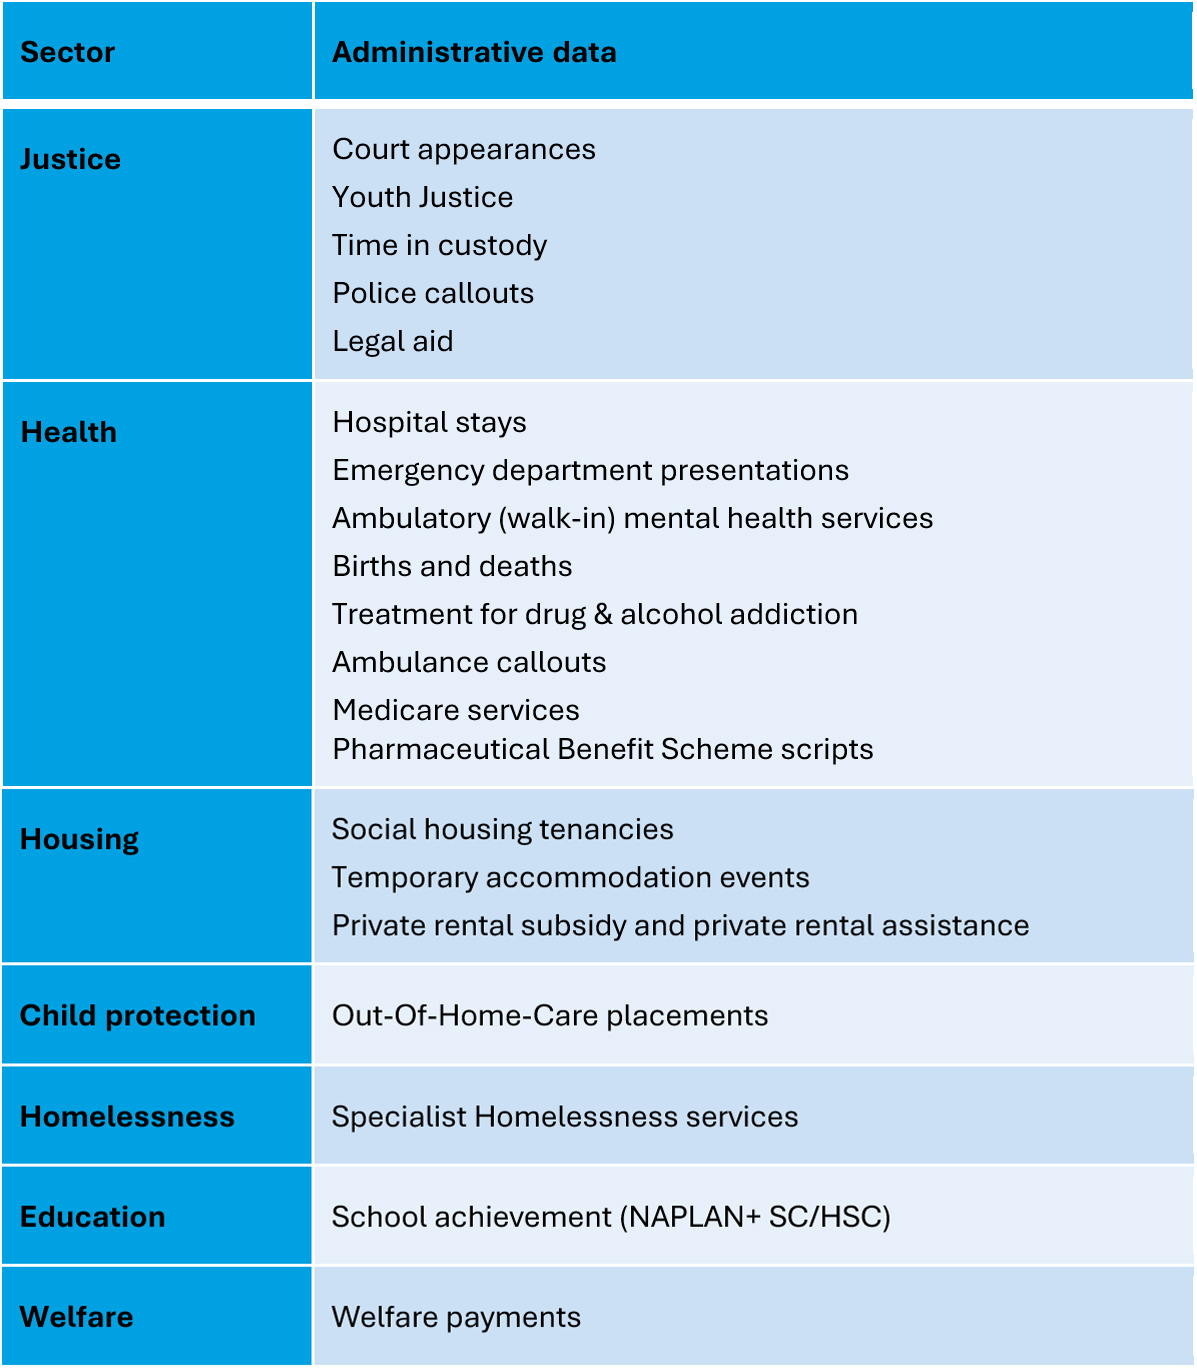
To answer these questions, we assembled one of the most comprehensive linked datasets in the country. It covered deidentified information on 600,000 people (a third of whom had interacted with homelessness services and the remainder included as a broader comparison group). Linked services are included in the table below, spanning justice, health, housing, welfare, education and child protection. It included six years of homelessness services to 30 June 2017, so gives a reasonable longitudinal picture. Notably, the linkage included both state and Commonwealth data – such linkages can be difficult to establish due to governance complexities.
Table 1 – Datasets linked together for the Pathways to Homelessness Project
Exploring the data
The analysis of the data spanned a range of approaches including descriptive statistics, targeted comparisons and predictive modelling. At a descriptive level we see that:
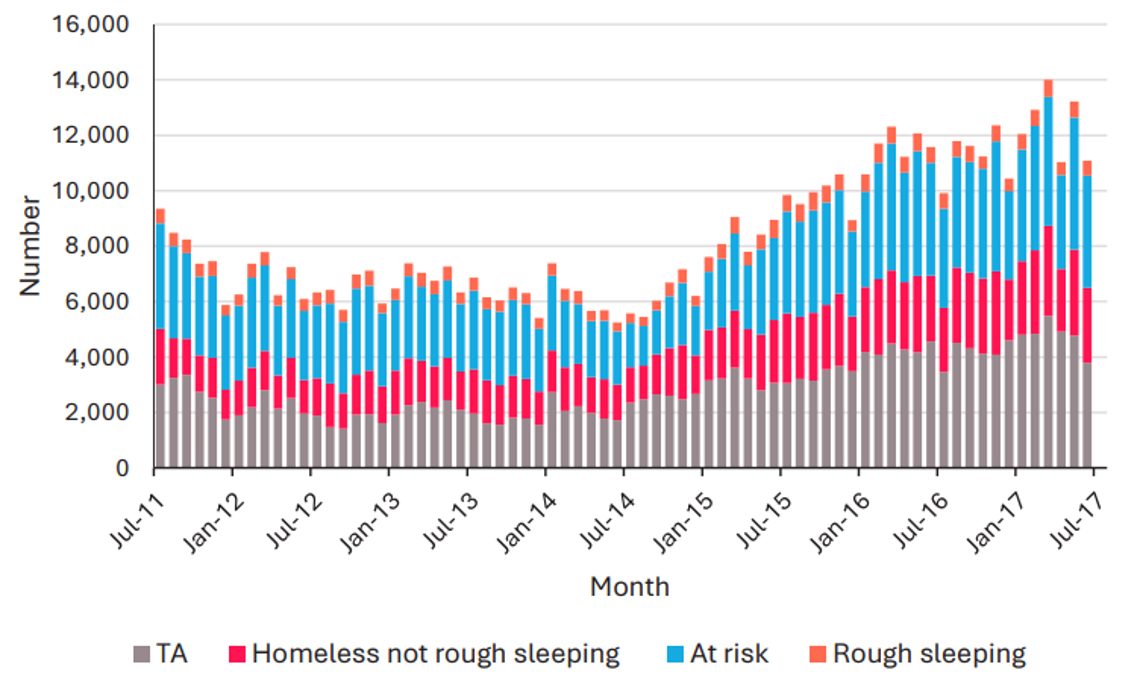
- Homelessness rates (as proxied by interaction with SHS and TA) have been rising. About 12,000 people a month receive support per month, a 60% increase over six years. Part of this increase may be supply (more funding has been provided to the sector over time to reflect perceived need), but it appears homelessness is a rising problem in an environment of falling housing affordability.
- Females are slightly over-represented (54% of presentations). This is partly due to females being more likely to be seeking support as a victim of domestic and family violence.
- Aboriginal people are significantly over-represented, at roughly ten times the rate relative to their fraction of the population.
- About two-thirds (65%) of people accessing homelessness services receive income support payments. Most commonly people are on the Jobseeker benefit, but Disability Support Pension and Parents Payment are also prevalent.
Figure 2 – Number of people seeking homelessness support over time in NSW
 Understanding cost to government
One key question is understanding the ‘cost to government’ of people interacting with homelessness services, and how this compares to the broader population. This can be estimated by attaching unit costs to each service use and summing up over the observable data. Among adults with recent experiences of homelessness, the median six-year service use cost-to-government is $166,000 per person. This is about eleven times higher than the average adult.
This distribution is also heavily skewed. The highest cost 5% (~ 1,500 people) have costs of $458,000 or more, with an average of $706,000.
Importantly, most of this cost is not accrued in the housing and homelessness sector. We estimate that less than 10% of these costs to government are attributable to this sector. This means most of the cost accrues in other areas such as health, justice and the welfare system. This is one strong argument for a cross-sectoral view that echoes work done overseas; much of the ‘value’ of effective intervention will be seen across a range of areas.
Predicting homelessness and identifying points of early intervention
One question we sought to answer is how well demographic and cross-sectoral data can be used to predict who will need homelessness support in the future. One of our models predicted incidents of people presenting as sleeping rough – an acute form of homelessness where people are sleeping on the street or in makeshift accommodation such as tents.
We found that there are definitely subgroups with very high relative likelihood. The most at-risk 0.2% of the population (about 16,000 people across NSW) represents about 20% of rough sleeping presentations, and were more than 100 times more likely to be rough sleeping over the next year. While previous homelessness service use was a strong predictor, there were many other significant predictors including welfare receipt, recent court and youth justice interactions as well as health service use.
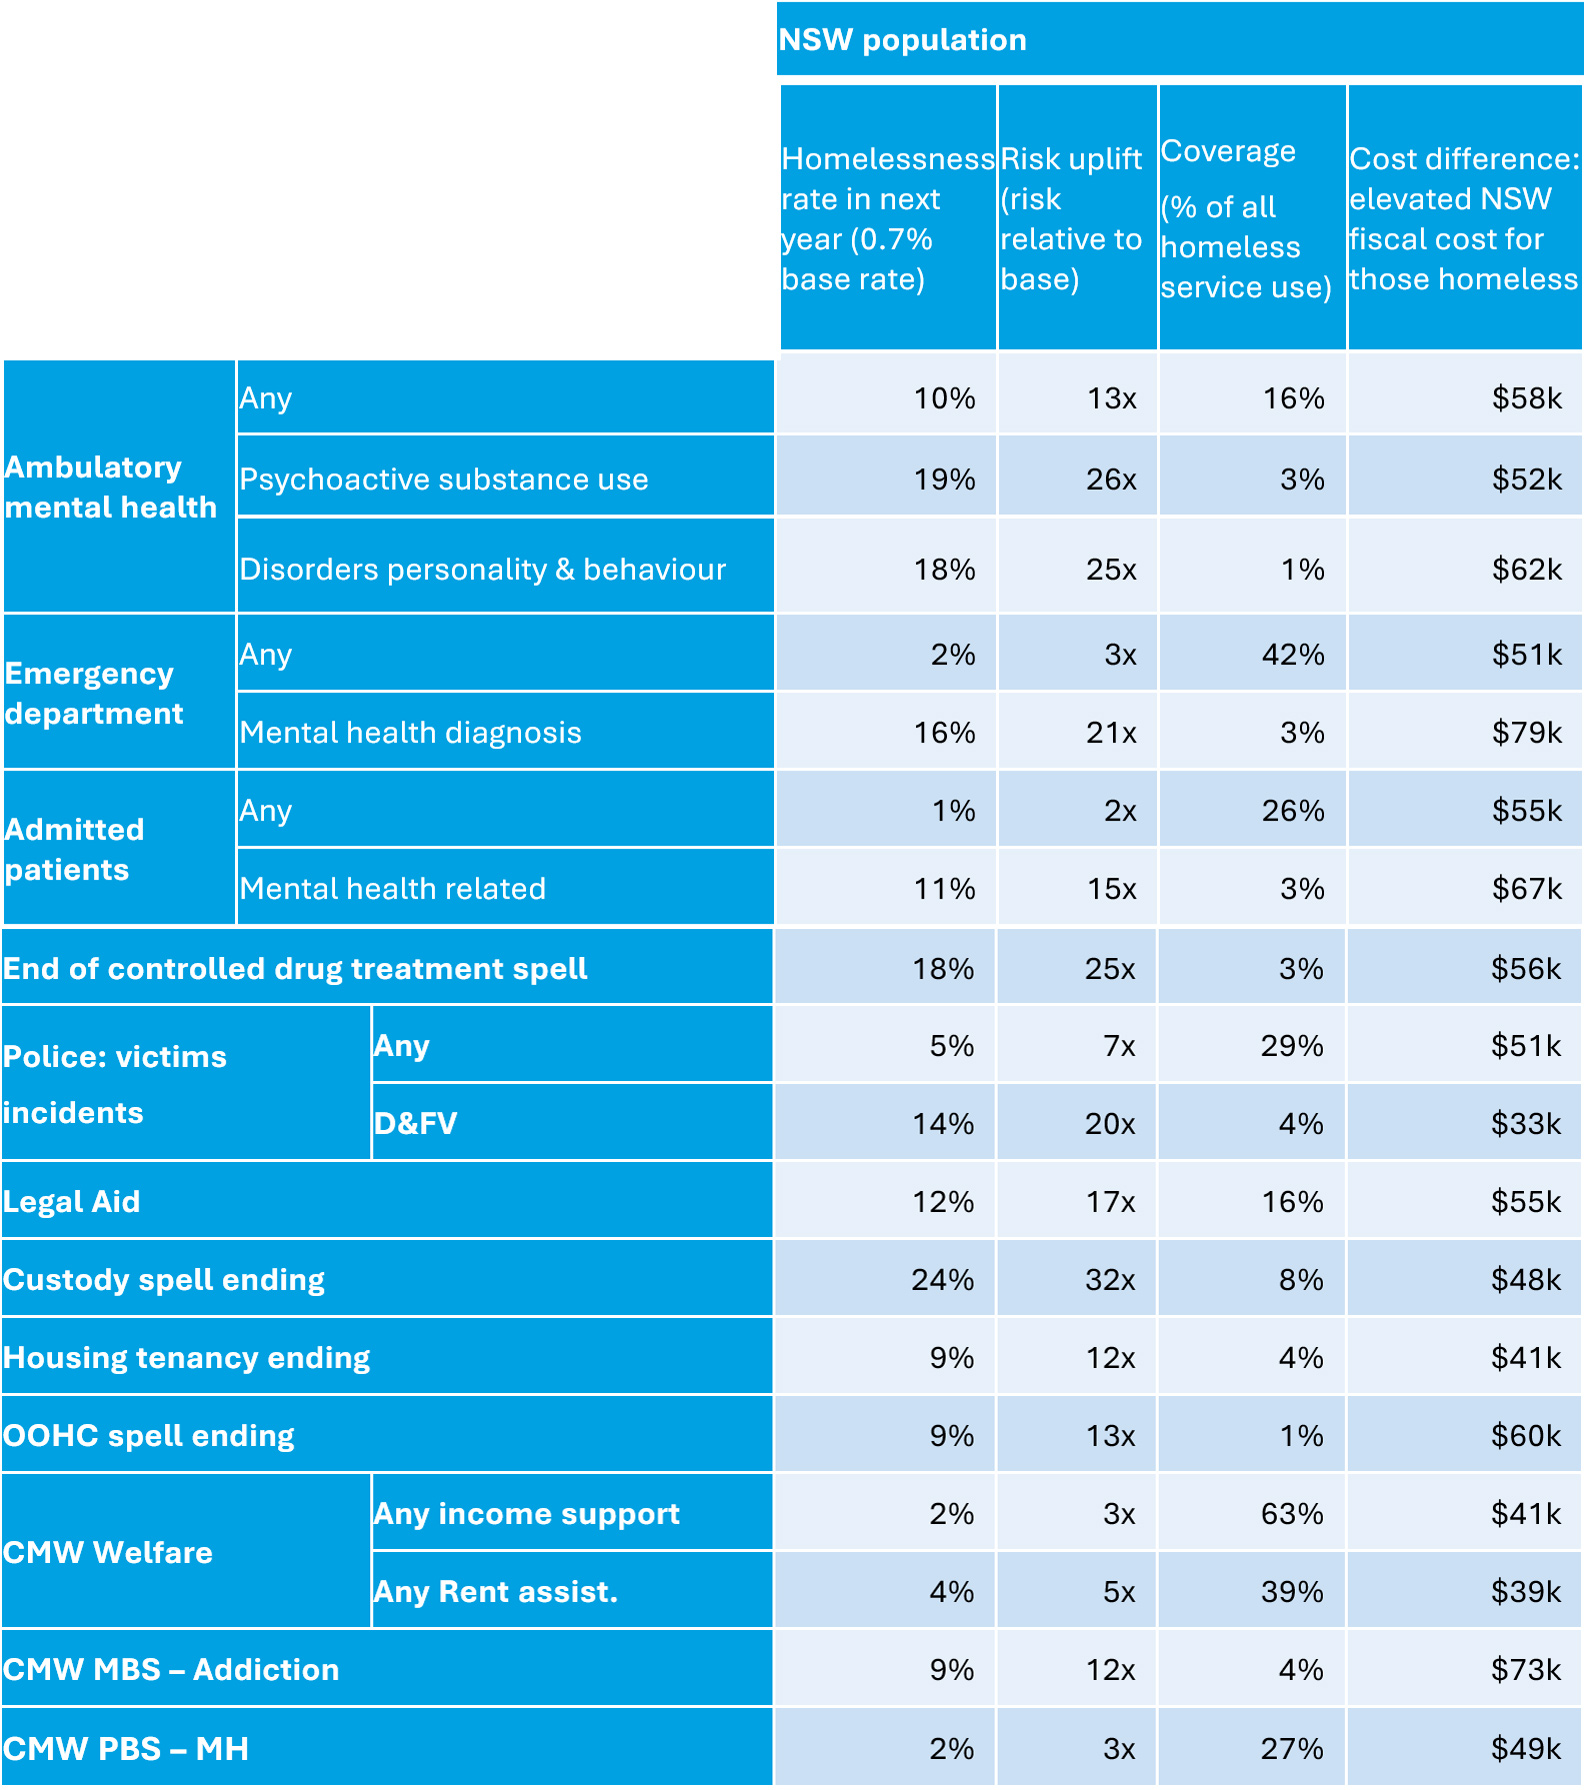
More practically, we looked at the potential for other (non-homelessness) services to be early intervention points. To do this, we looked at the ‘risk uplift’ (how much more likely someone would be to interact with homelessness services in the year after accessing service X), coverage (what percentage of people who access homelessness support also accessed service X in the previous year) and cost difference (a plausible upper bound on three-year cost to government from effective intervention).
A results table is shown below. For example, ambulatory mental health services see a large risk uplift of 13 times, has coverage of about 1 in 6 people receiving homelessness supports and significant cost difference. This means there is the potential for well-tailored intervention.
Table 2 – Comparison of risk uplift, coverage and cost difference for different government services
Implications and reflections
As part of the project we’ve been able to present results to different stakeholders, including cross-agency groups. Findings have informed key initiatives to deliver on the Premier’s Priority to halve street homelessness by 2025 and the development of the next NSW Homelessness Strategy. It also builds the evidence base for constructing business cases for new types of interventions and supports. Over the course of the project we’ve been able to see the commitment of many public services to make genuine improvements to the system, across what is a complex and challenging policy area.
Ultimately, it has been an interesting and rewarding project. While data governance and permissions added a lot of time and complexity to the project, the end result is a solid piece of analysis that can be used in a variety of ways.
Such work can only be effective when combined with other type of work, including by those ‘on the ground’ in the sector. For those interested in the area, there are many other organisations doing great work, including the End Street Sleeping Collaboration or Homelessness NSW.
CPD: Actuaries Institute Members can claim two CPD points for every hour of reading articles on Actuaries Digital.


