


COVID-19: Overall September-October mortality remains steady, but January increase likely
Analysis from the Actuaries Institute’s COVID-19 Mortality Working Group has determined that overall mortality in September and October 2021 was close to expected, despite significant COVID-19 deaths, but mortality in January is likely to be higher.
In summary:
|
The COVID-19 Mortality Working Group has examined the latest provisional mortality statistics to 31 October 2021, released by the ABS just before Christmas. We have compared our predicted baseline number of deaths to the observed deaths, noting that this analysis includes two additional months of observed data points since our previous analysis. This analysis is based on monthly ABS data for doctor-certified deaths, so it excludes roughly 10% of all deaths that are certified by the coroner.
In brief, the Working Group’s analysis:
- scales actual weekly deaths from 2015 to 2020 so that they are representative of the number of deaths in those years if they had the 2021 population size and age mix;
- fits a linear regression model to the scaled deaths from 2015 to 2019, giving overall mortality improvements of around 1.8% per annum over the five-year period;
- extrapolates the linear regression model to arrive at a predicted number of deaths for each week in 2020 and 2021 (assuming that the same 1.8% per annum mortality improvement continues and ignoring the impact of the pandemic); and
- compares predicted deaths to the actual deaths in 2021 (after a small allowance for late reported deaths).
It is important to note that expected deaths are increasing faster from demographic changes (ageing and population size) than they are reducing due to mortality improvement. As a result, our model predicts higher deaths each successive year. Our prediction for 2021 is higher than for 2020 and both are higher than the 2015-19 average. In fact, despite the overall mortality improvements, our predicted total deaths in the first 10 months of 2021 were 6,600 (6%) above the 2015-19 average.
The graph and table below summarise the results of the analysis. This article concentrates on the experience in 2021, but we have also shown the 2020 results for context.
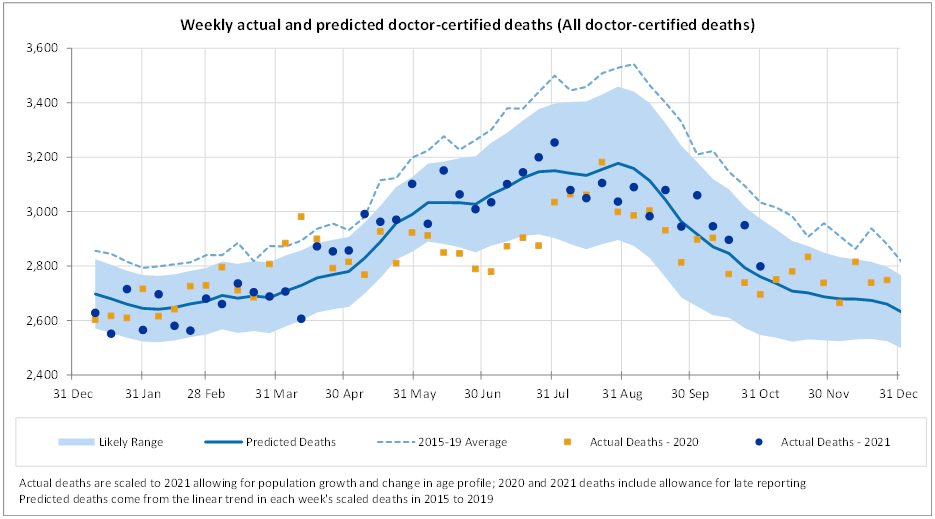
While in total deaths in September and October are close to expected and within the 95% prediction interval (i.e. between the 2.5th and 97.5th percentiles), there are some quite material differences when we examine deaths by cause.
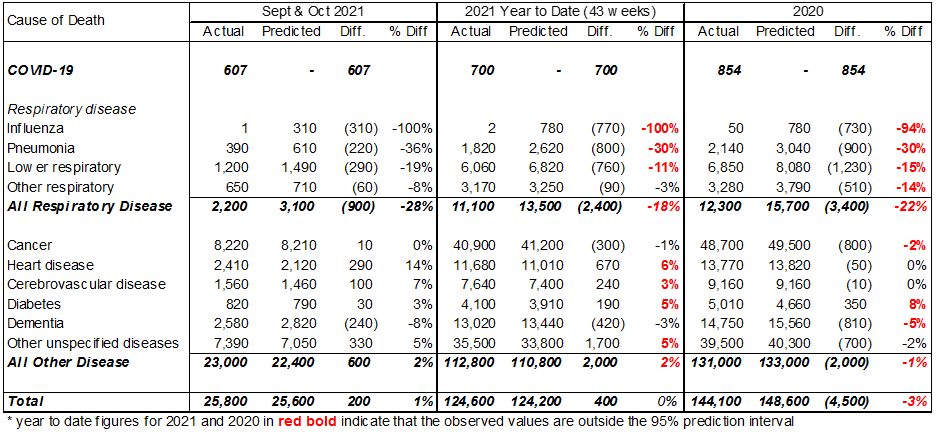
For the months of September and October 2021, total deaths were close to predicted, continuing the trend of 2021 to date. Also:
- there were 607 doctor-certified deaths from COVID-19;
- deaths from respiratory disease continued to be much lower than expected (down 900 or 28%);
- deaths from heart disease were again higher than expected (up 290 or 14%) while deaths from cerebrovascular disease (strokes, etc) were also higher than expected (up 100 or 7%);
- deaths from dementia were lower than expected (down 240 or 8%), possibly related to lower-than-usual levels of respiratory disease in the community; and
- deaths from other causes, i.e. those not explicitly reported on by the ABS, were again higher than expected (up 330 or 5%).
In the year to date (ten months to end October), deaths from all causes were close to predicted and:
- there have been 700 doctor-certified COVID-19 deaths;
- deaths from respiratory disease have been around 2,400 (18%) less than predicted, which is less than the 2.5th percentile;
- there were more deaths than expected from heart disease (up 670 or 6%), cerebrovascular disease (up 240 or 3%), diabetes (up 190 or 5%) and other causes (up 1,700 or 5%), and these deaths were higher than the 97.5th Higher deaths from these causes offset the lower deaths from respiratory disease; and
- deaths from cancer and dementia are close to expected.
The following graphs show the detailed comparisons for each cause of death.
COVID-19 deaths
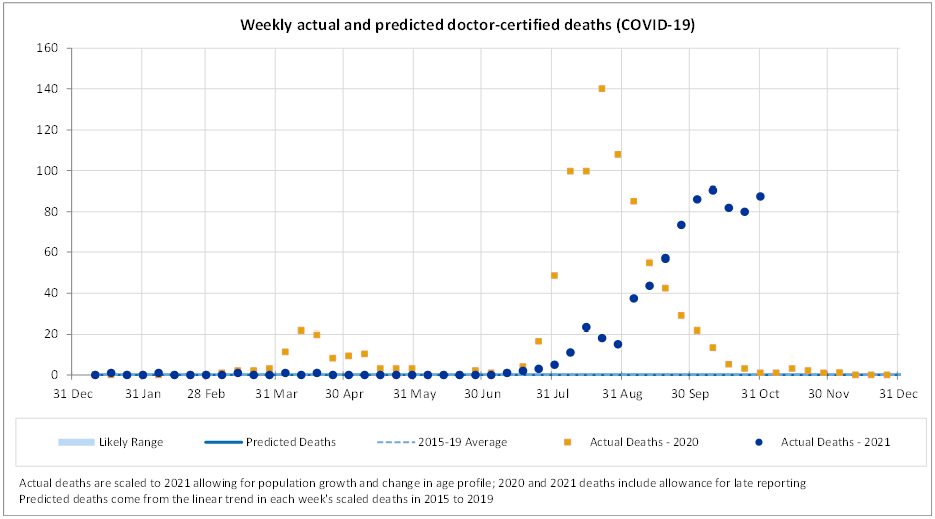
There were 607 doctor-certified deaths in September and October from COVID-19. This is 121 fewer than the 728 officially recorded COVID-19 deaths in the two months. We would not expect the numbers to be identical, because:
- there are delays between time of death and lodgement of the doctor’s certificate (noting we have not made any allowance for late reported COVID-19 deaths);
- the reporting criteria are slightly different; and
- some COVID-19 deaths will be referred to the coroner (e.g. deaths occurring at home).
In the year to 31 October, there have been 700 doctor-certified deaths, compared with 825 officially recorded COVID-19 deaths.
While the ABS provisional mortality statistics data is only available until the end of October, the officially recorded COVID-19 deaths are available daily. The following graph shows the number of such deaths in each month of 2020 and 2021.
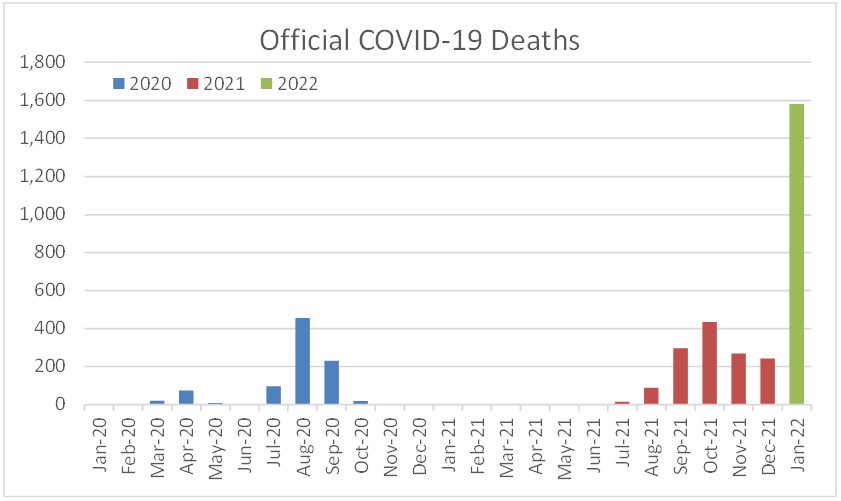
There were 909 official COVID-19 deaths in 2020 (including 854 doctor-certified) and a further 1,344 deaths in 2021. In the month of January 2022 alone, COVID-19 deaths total 1,582, more than the annual total in 2021.
Our model predicts that, without a pandemic, around 13,500 to 14,000 deaths would be expected in January 2022 (including an allowance for coroner referred deaths). As such, COVID-19 is likely to have increased mortality in Australia by around 10% in the month of January. There is unlikely to have been a corresponding reduction in deaths from lockdowns, social distancing, border closures or other measures as we have observed very little reduction in overall mortality during the summer months of 2020 and 2021 from these measures.
If COVID-19 deaths are near the peak of this current wave, and we do not have another significant wave, total COVID-19 deaths in 2022 may not result in a material net increase in total mortality given the gains in other areas, most notably respiratory disease. However, if COVID-19 deaths continue at this level for several months, or we have another wave later this year, Australia could be expected to record excess mortality in 2022, the first such year during the pandemic.
Respiratory deaths
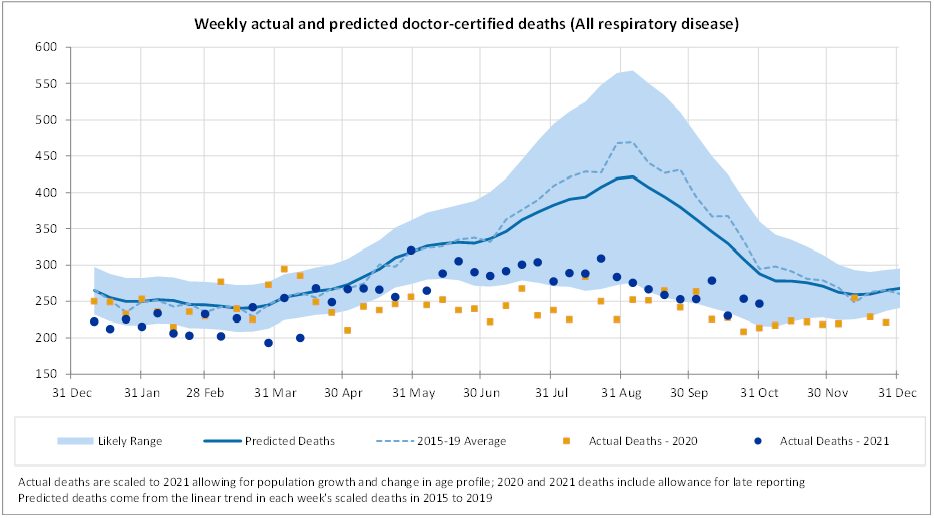
Following the trend observed since the beginning of the COVID-19 pandemic, Australia continued to see significantly lower deaths from all respiratory disease in the months of September and October 2021. Note that deaths from respiratory disease in 2021, while much lower than trend, have been higher than in 2020 for almost all weeks since mid-April.
The following figures present a breakdown of respiratory disease into influenza, pneumonia, lower respiratory disease, and other respiratory disease.
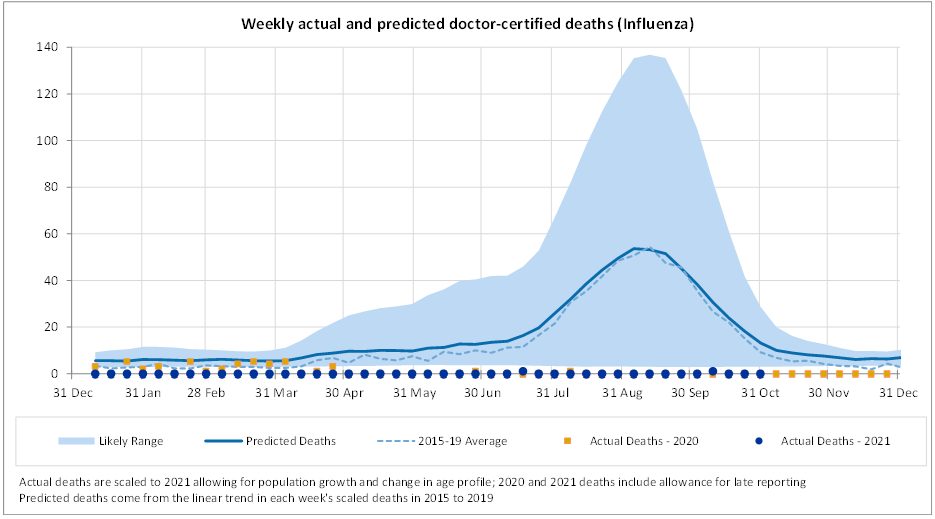
There were no deaths from influenza in September 2021 and only one such death in October 2021.
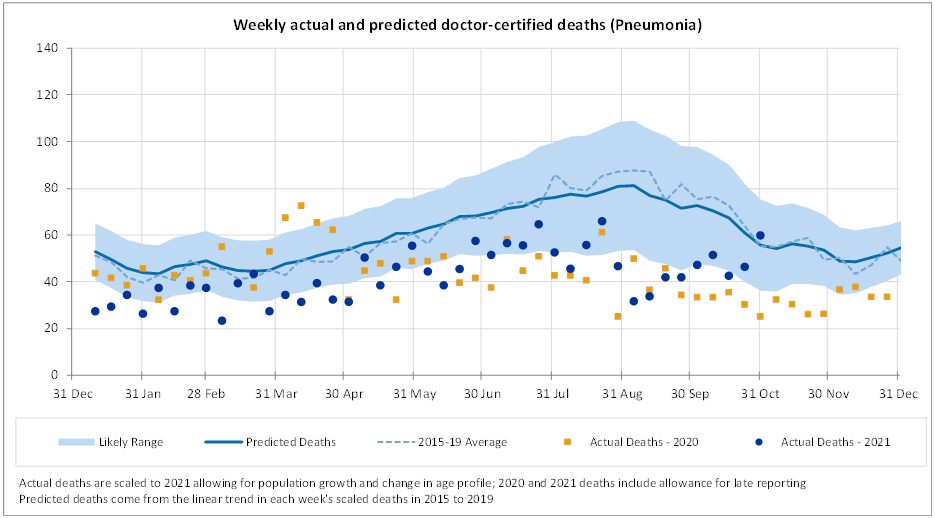
Pneumonia deaths remain low; deaths from this cause are lower than predicted for every week of 2021 other than the last week of October, and lower than the lower bound for most weeks.
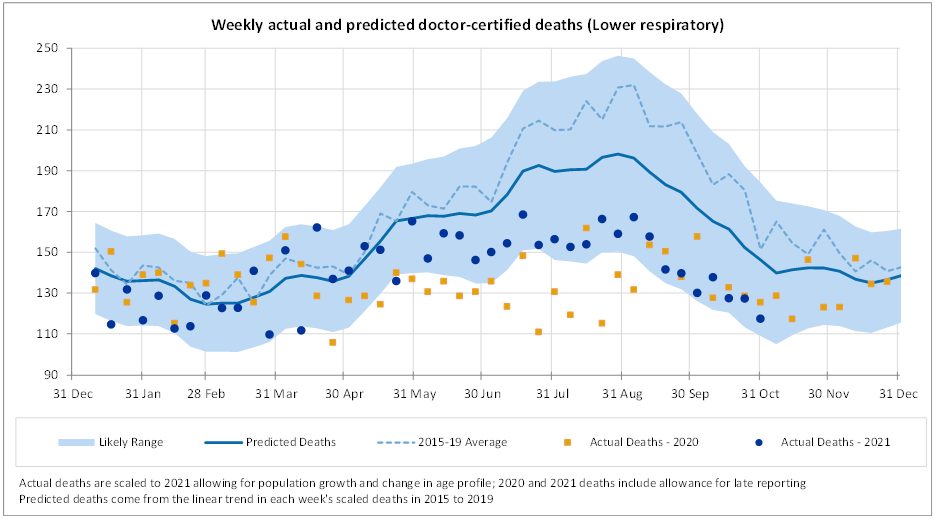
Deaths from lower respiratory disease were close to predicted for most weeks until end May 2021. From June to August, deaths from this cause are lower than predicted, however they are not as low as in 2020. For September and October, deaths from this cause are close to the lower bound of our prediction interval and are similar to 2020.
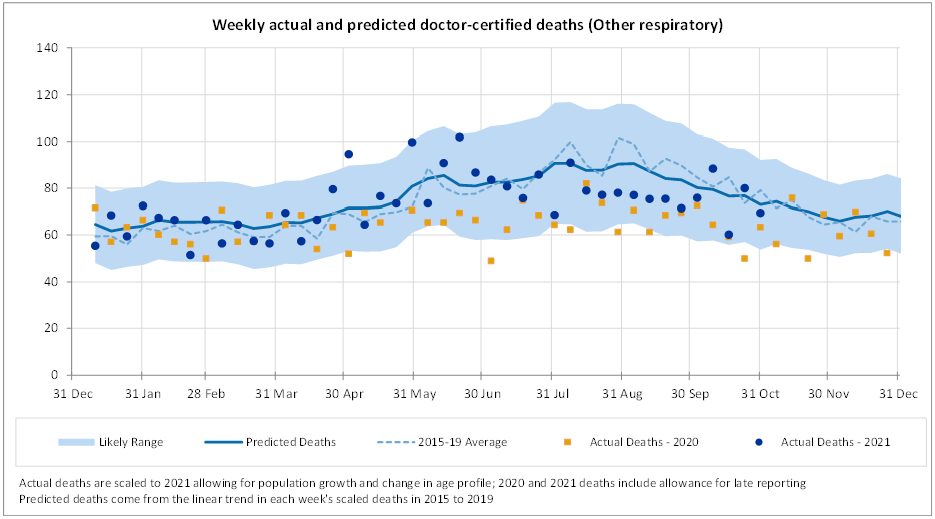
Deaths from other respiratory diseases are close to predicted for most weeks.
Non-COVID-19 and non-respiratory deaths
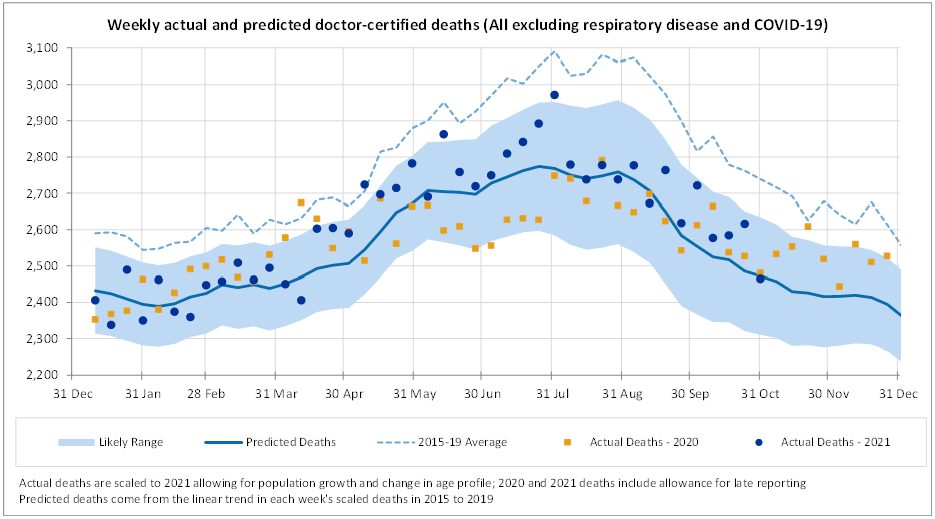
Excluding deaths from COVID-19 and respiratory disease, deaths in September and October were a little higher than expected, but within the prediction interval. This followed a period from mid-April until end-July where deaths were higher than predicted and above or close to the 97.5th percentile in quite a number of weeks. This is mainly driven by the experience of ‘other’ deaths, and, to a lesser extent, heart disease.
The following figures show a breakdown of non-respiratory/non-COVID-19 deaths into cancer, heart disease, cerebrovascular disease, diabetes, dementia and all other causes.
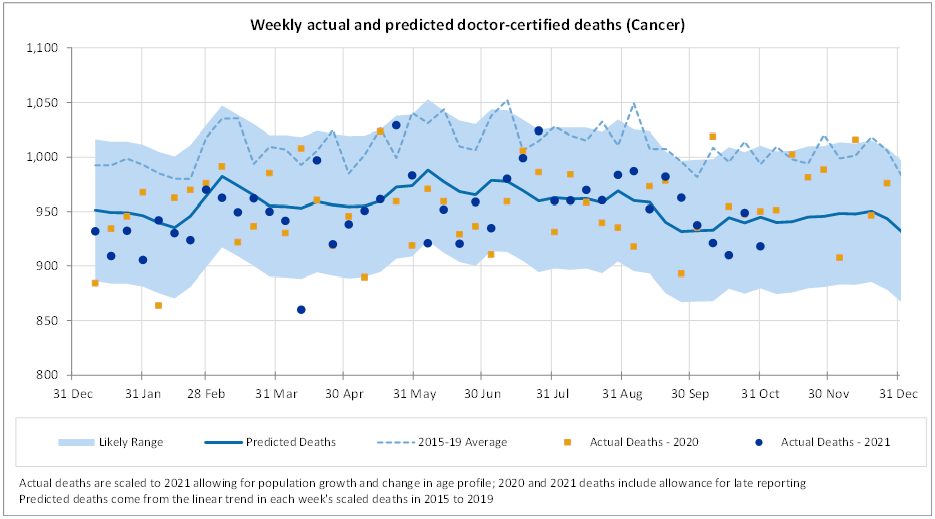
Cancer deaths continue to be close to the predicted values for most weeks. With diagnostic testing down in 2020, there were concerns that there would be a spike in cancer deaths in 2021 and beyond. While it is still early days, we are not yet seeing any evidence of this effect.
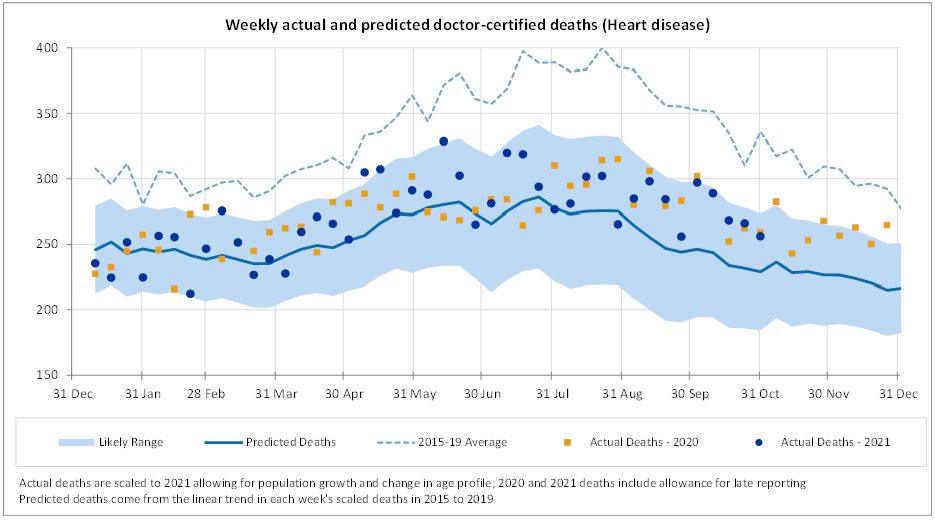
In the ten months to end-October, there have been higher than expected deaths from heart disease (up 6%). This has been fairly consistent across most weeks with only a small number of weeks above the 97.5th percentile. We note that the predicted values allow for continued strong mortality improvement in 2021 in this cause. Deaths in 2021 are close to 2020.
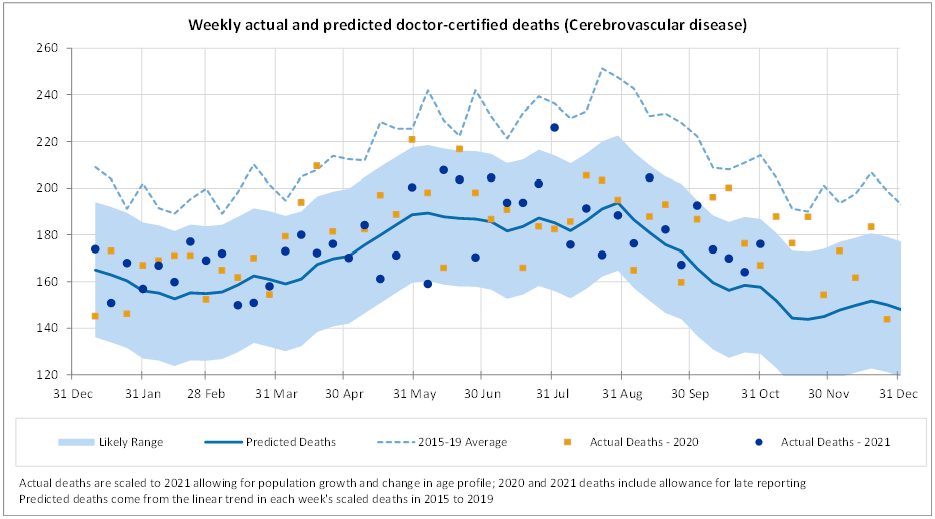
For cerebrovascular disease, actual deaths are 3% higher than predicted in the ten months to 31 October. Most weeks are higher than predicted, but only a small number are above the 97.5th percentile, noting that the predicted values incorporate a continuation of strong mortality improvement.
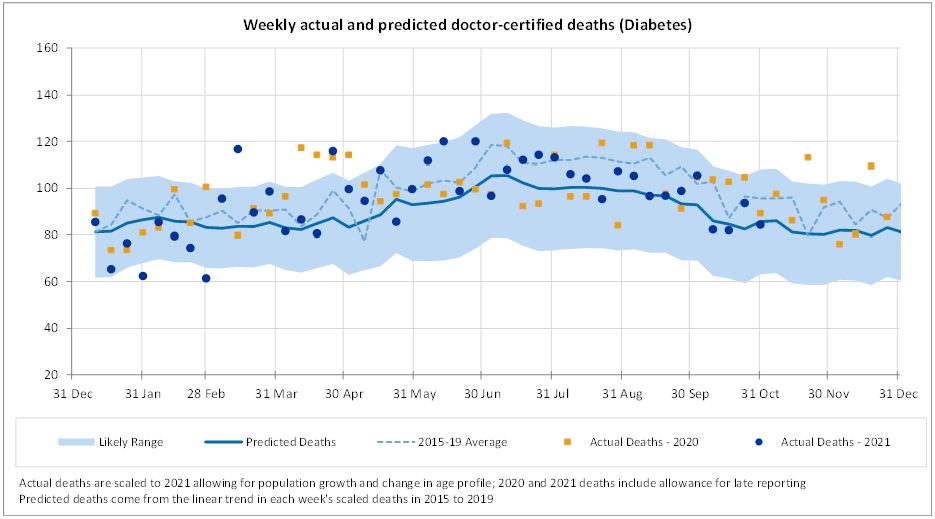
Deaths from diabetes are higher than expected (up 5%) in the ten months to 31 October. Deaths from this cause make up only a small proportion of all deaths and are somewhat volatile, however most weeks are above the mean prediction.
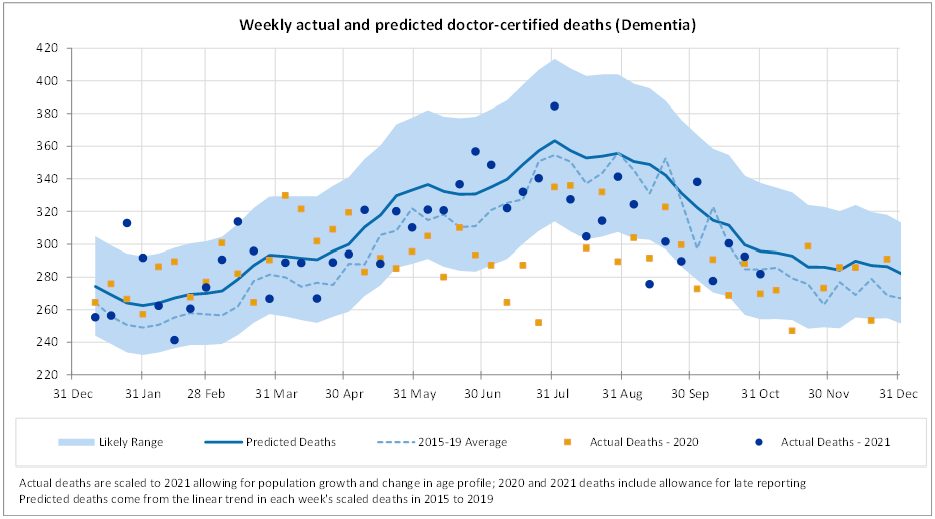
Deaths from dementia were lower than expected in September and October by quite a significant amount (down 8%). This is similar to the experience in July and August and is possibly related to lower than usual levels of respiratory disease in the community over winter.
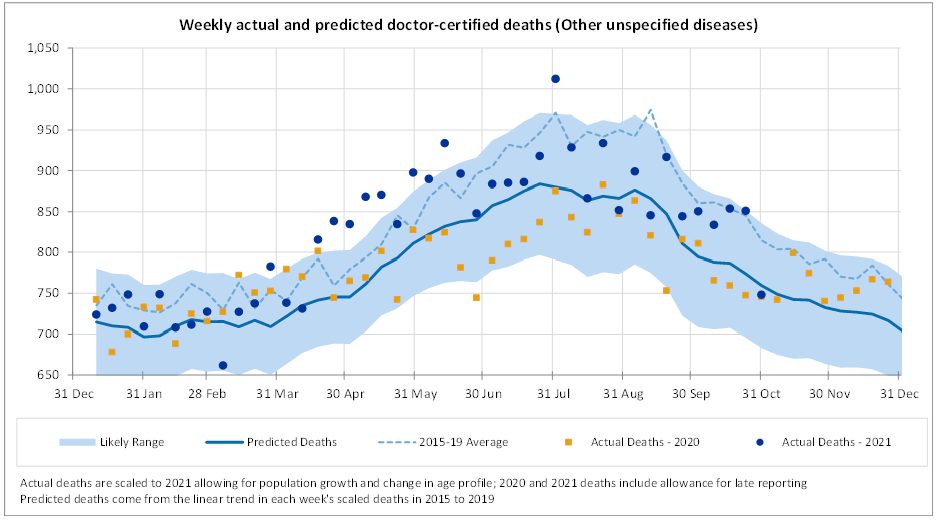
Deaths from other causes, i.e. those not explicitly reported on by the ABS, continued to be higher than expected in September and October. Deaths from this group of causes were substantially above the upper limit of the prediction interval from around mid-April until end-June. Since then, deaths have mostly been within the prediction interval but higher than the mean.
Members of the COVID-19 Mortality Working Group:
|
CPD: Actuaries Institute Members can claim two CPD points for every hour of reading articles on Actuaries Digital.


