


Victoria – the journey so far and what lies ahead
How has the COVID-19 situation evolved in Victoria during the ‘second wave’? How does this compare to the ‘first wave’? What might be coming next? Read on for this author’s thoughts,
Please note that this was written on 13 August in a fast moving environment.
A reminder about time lags
There is a considerable lag between becoming infected and being diagnosed. It takes 5-7 days on average for symptoms to appear (range 1-14 days)[i], maybe 1-3 days to decide to go and get a test, and around two days for test results to come back (assuming testing capacity is not under strain)[ii]. We need to remember that cases diagnosed today represent infections that occurred at a minimum around a week ago, and potentially up to two weeks ago if people are slow to get tested or if testing capacity is stretched. As such, the impact of any interventions will not show up in the number of cases diagnosed until around 1-2 weeks later.
A re-cap on the first wave
In the latter part of February and early March, it became apparent that the virus was spreading widely in parts of Europe and the US. This was impacting on Australia, with overseas travellers bringing the virus in with them. As such, the border to was closed to non-Australian residents on 15 March, and returning Australian residents were asked to self-isolate (mandatory hotel quarantine did not commence until 29 March).
The whole of Australia went into lockdown on or about 23 March. We had progressively been introducing social distancing measures prior to that date, but 23 March is the date that the majority of people who could work from home started to do so, and the date that schools switched to remote learning.
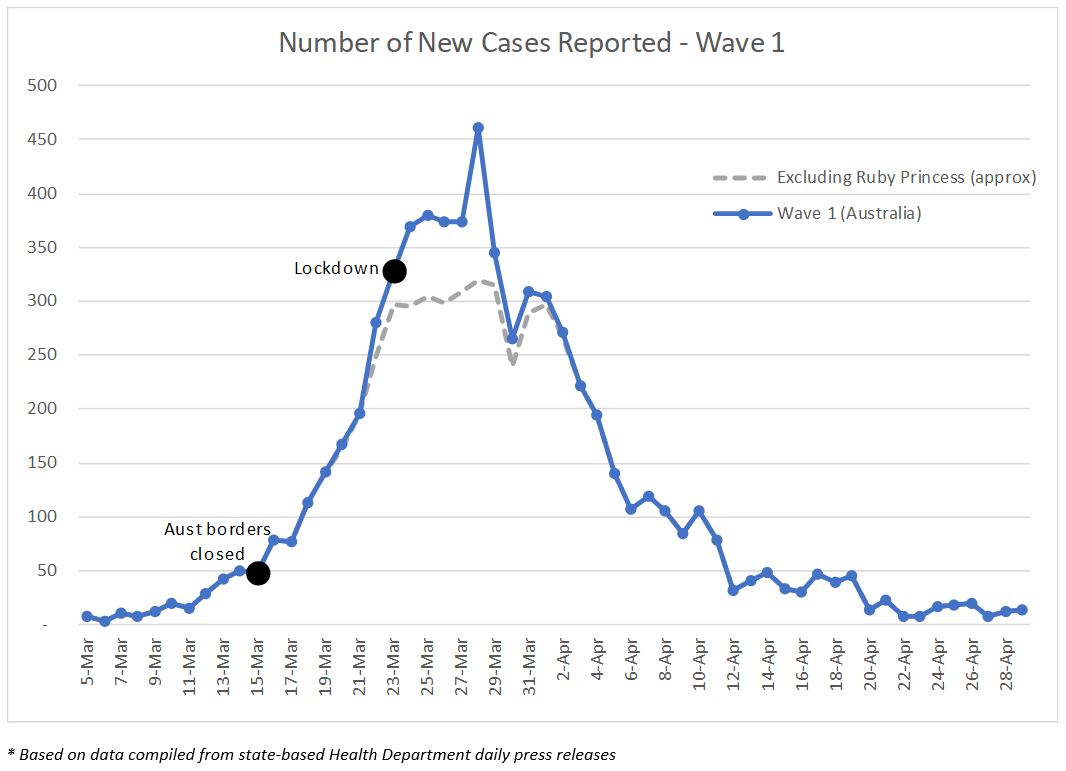
On 15 March there were a number of people in Australia who had returned from overseas with COVID-19 but didn’t know about it yet – it is these people that made up the vast majority of diagnosed cases between mid-March and end-March as their symptoms presented and they were diagnosed.
Another large tranche of cases (around 600) resulted from the Ruby Princess cruise ship, most of which were reported in the last week of March. Information is not available to properly exclude these cases, however I have approximated the impact and estimate cases would have peaked at around 300 per day over the last week of March were it not for the Ruby Princess cases.
The number of cases diagnosed began to reduce after the peak on 28 March. So it appeared as though the lockdown had a fairly rapid impact on the cases numbers, but it did not. The main reasons for the reduction in case numbers were because:
- the large numbers of cases from the Ruby Princess dried up; and
- overseas traveller cases also dried up due to the border closure and self-isolation measures implemented two weeks earlier.
That is not to say the lockdown wasn’t necessary – there were community transmission cases that needed to be contained, however these were not the main driving factor behind the reduction in case numbers.
Data is available that shows case numbers split between overseas travellers and local transmission cases. However the local transmission cases include the household contacts of overseas travellers, so the shape of the run-off of these two curves is the same. Unfortunately, data is not available with household contacts of overseas travellers separated out from other local transmission cases, but I surmise that the run-off curve would look quite different to that shown above, with a broader, fatter tail.
The Victorian second wave
This graph shows the number of new cases reported in Victoria and given the daily volatility in the numbers, the 5-day rolling average is also shown.
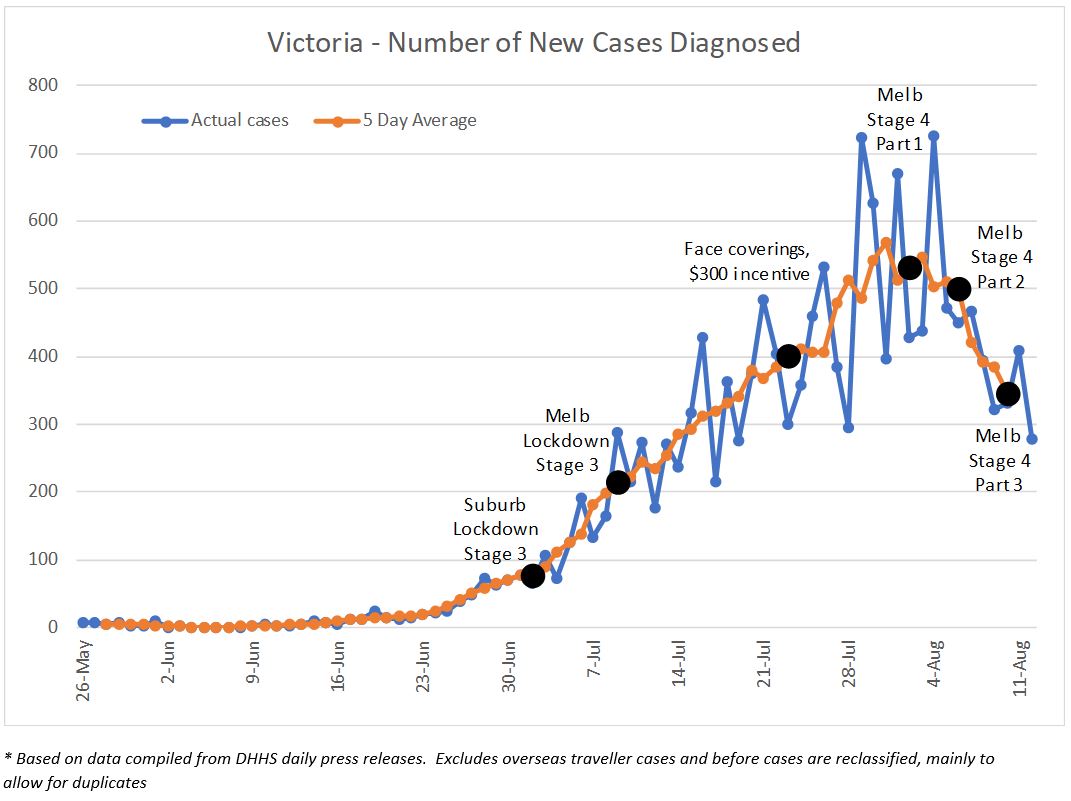
Breaches of hotel quarantine and subsequent transmission through the family clusters is well documented. The first case associated with the Rydges Hotel was diagnosed on 26 May, and the first case in a family cluster was diagnosed the following day. The second family cluster had its first case identified on 13 June, around a similar time to the first case from the Stamford Plaza (16 June). Contact tracing does not appear to have linked either family cluster with either hotel outbreak. From mid-June to early-July, a further 10-12 family clusters were identified with case numbers ranging from 5 to 30 per cluster, prompting the 2 July Stage 3 lockdown of Melbourne ‘hot spot’ suburbs.
The suburb lockdown was modelled on the successful lockdown of north-west Tasmania following the outbreak associated with the North West Regional Hospital in April. However, the Tasmanian lockdown ringfenced a large regional area, whereas the Melbourne suburb lockdown attempted to ringfence certain suburbs within a large city, and those suburbs were not contiguous. In addition, people living within the lockdown suburbs were allowed to leave the lockdown zone for work and school, and those outside of the lockdown suburbs were allowed to enter for the same reasons. These porous borders around the lockdown suburbs meant that the virus was not contained to the ringfenced area, and transmission through workplaces took hold.
It became evident fairly quickly after the suburb lockdown that there was much more community transmission than was realized, and much more of it outside of the lockdown areas. This resulted in the Stage 3 lockdown of the rest of metropolitan Melbourne and the Mitchell Shire on 9 July.
Case numbers continued to climb after the Stage 3 Melbourne/Mitchell lockdown, with analysis held within the Victoria DHHS indicating that the rate of transmission had not reduced sufficiently. The Victorian Premier and Chief Health Officer stated at the time that workplace transmission was the primary cause, and this makes sense given where people were allowed to be mobile.
In response, subsequent interventions introduced were:
- face coverings were made mandatory in Melbourne and Mitchell Shire from 23 July
- a $300 financial assistance payment was made available to those awaiting test results from 23 July
- anyone who tested positive from 29 July would receive an at home visit from the public health team, both for compliance purposes and speed of contact tracing
- from 3 August, a $1,500 pandemic leave payment was available to anyone forced to self-isolate for 14 days if they have no sick leave entitlements. (A similar payment was already in place for anyone who has tested positive.)
These interventions will be responsible for the reduction in case numbers observed over the last few days, however these interventions were not expected to be sufficient to reduce case number by enough. As a result, from early August, Melbournians have been placed under Stage 4 restrictions and regional Victoria under Stage 3 restrictions (noting Mitchell Shire remains at Stage 3).
Why have Stage 3 restrictions been less effective in Wave Two?
The following graph shows the progress of two waves side by side, noting that I have designated 5 March as the start of Wave One and 26 May as the start of Wave Two.
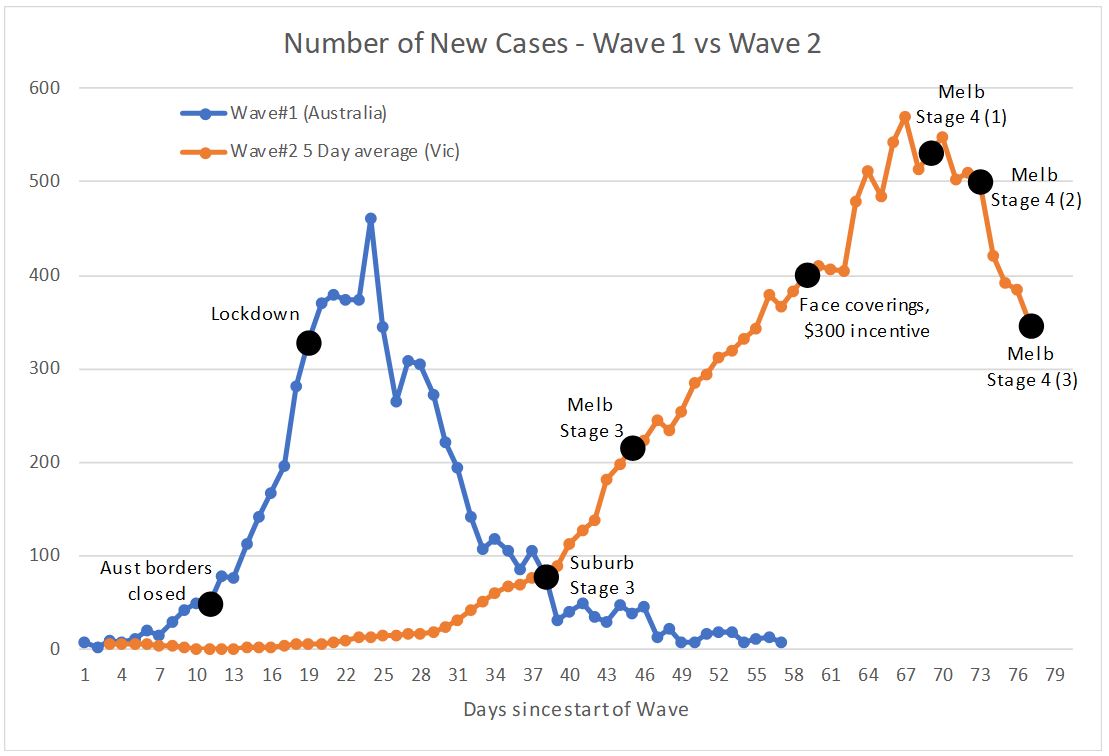
One thing that is very clear is that the upward trajectory of Wave One was much earlier than Wave Two, and much steeper. The Wave One trajectory primarily reflects the rates of transmission that were occurring in overseas countries at that time, where very little was occurring by way of suppression. The lower rate of increase in Victoria during Wave Two reflects the suppression strategies in place, including contact tracing efforts, social distancing/hand hygiene measures adopted by the public, along with the various interventions that have been subsequently introduced. A pre-print article submitted for publication in the Medial Journal of Australia by the Burnet Institute estimated that “control measures have …. averted 9,000–37,000 infections between 2 and 30 July.”[iii]
So while the interventions have been successful in averting cases, why weren’t they as successful as in Wave One? Why didn’t we ‘peak’ much earlier?
- Wave One was predominantly from imported cases, and when we went into lockdown in March, we had reduced the flow of incoming overseas travellers by around 90% by closing the border 12 days earlier, coupled with stemming the spread by the remaining 10% through requiring self-isolation. For Wave Two, we did not have this lever. All transmission was local transmission, and was always going to be much harder to stamp out.
- There are considerable socio-economic differences between the cohorts of infected people in Wave One (‘wealthy’ people who can afford to travel overseas) versus Wave Two (generally people from lower socio-economic backgrounds). The wave two cohort has a higher proportion of blue collar rather than white collar workers (hence less of an ability to undertake their work from home), a higher proportion of casual workers (thus no sick leave to fall back on), and a higher proportion of people with English as a second language (thus COVID-safe messages may not be as well understood).
- COVID-fatigue and the rise of misinformation – there has been concern since the virus emerged that any second wave would be harder to control due to people not displaying as much obedience the second time around, and tuning out to public health messages. Coupled with this is the proliferation of conspiracy theories around COVID, most notably that COVID is a hoax and that COVID is not a serious illness. Professor McCaw from the Doherty Institute said on 8 August that data showed residents in Melbourne had only that week reduced their movement to similar levels as Stage 3 restrictions in March, indicating Victorians were not fully adhering to Stage 3 rules in July’s second wave.[iv]
The combination of these last two points has resulted in:
- some people continuing with their normal activities while symptomatic – on 22 July, the Victorian Premier stated that 90% of people who had tested positive fell into this category;
- some people continuing with their normal activities while awaiting test results – on 22 July, the Victorian Premier stated that 50% of people who had tested positive fell into this category; and
- not being at home after a COVID-positive diagnosis – on 31 July, the Victorian Premier stated that 25% of people who had tested positive and been door knocked the previous day were not home.
In addition, as case numbers have grown, so have the challenges of contact tracing. The contact tracing teams have been struggling to keep up with the volumes of cases, and to undertake effective contact tracing quickly enough. As case numbers come down, efficiency of contact tracing will improve again which will further aid in supressing transmission.
One last factor could be the weather – while the virus itself is not thought to be seasonal, our behaviour is. In winter, we spend a lot more time in inside spaces with poorer ventilation than in summer, and evidence shows these are the environments where COVID thrives.
Are we ‘past the peak’?
It is tempting to declare that the answer to this question is “yes”, and it certainly looks like it now that we have a few consecutive days with lower case numbers. We also still haven’t seen the full impact of the Stage 4 restrictions in the case numbers:
- The 5km radius on shopping & exercise, plus the nightly curfew from 8pm to 5am was imposed on 2 August, so any impact of this measure should appear in the numbers around 9-16 August. If most transmission is in the workplace, then this impact may be at the margins rather than a large change.
- The changes introduced on 6 August (all non-essential retail, manufacturing and administration businesses close, regional Victoria entered Stage 3) will likely drive a bigger impact on the numbers, with this effect expected to show in the numbers around 13-20 August.
- The changes on 10 August (reduced production capacity for food processing and construction) will likely produce a lesser impact around 17-24 August.
Beyond that, how quickly will cases run down? It seems unlikely that the decline will be anywhere near a fast as what we saw in Wave One when you take into account both the Ruby Princess impact and the fact that cases were predominantly from overseas rather than local community transmission.
What are the risks that cases wont continue to fall?
There are some key risk areas that may mean the decline in case numbers will not be as quick as we would all like. The following graph shows the case numbers over the last eight weeks by type of case.
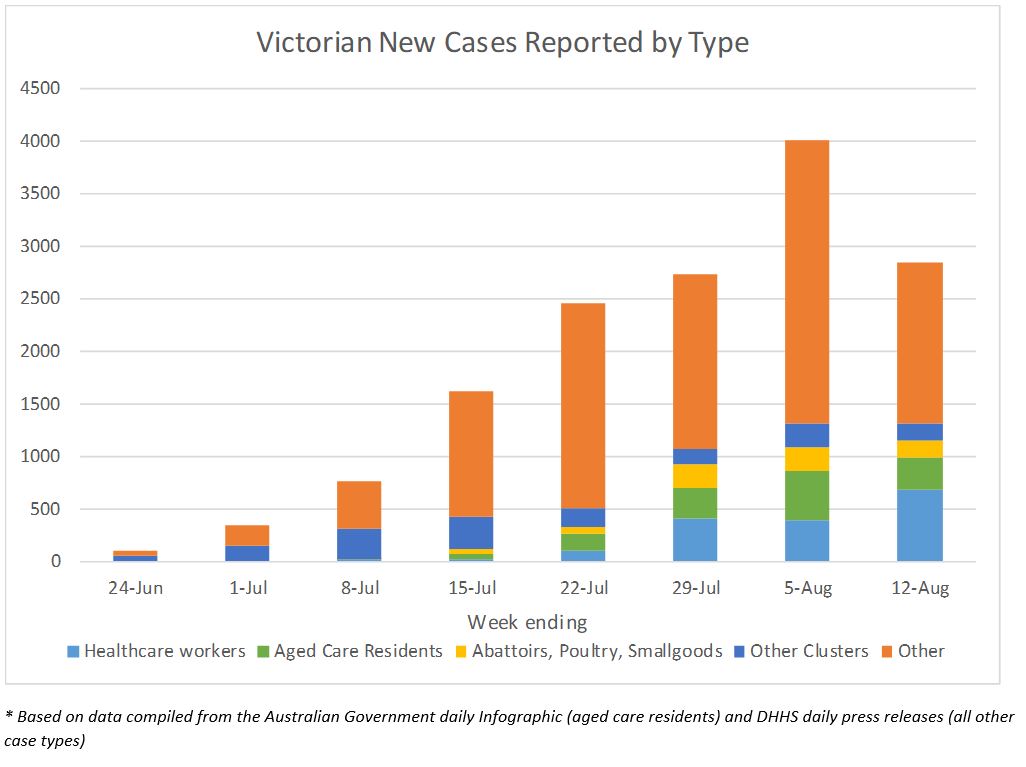
The decline in new case numbers seen in the last week has predominantly been in the ‘other cases’ group i.e. excluding health care workers, aged care residents, meat production and other clusters that have been mentioned in the press releases. The number of new cases in aged care residents has reduced a little, but this has been more than offset by increases in healthcare workers.
There is not a lot of information available on what comprises the “other cases” group, however some data was released on 12 August that shows the total number of cases reported between 1 July and 11 August by type of transmission.
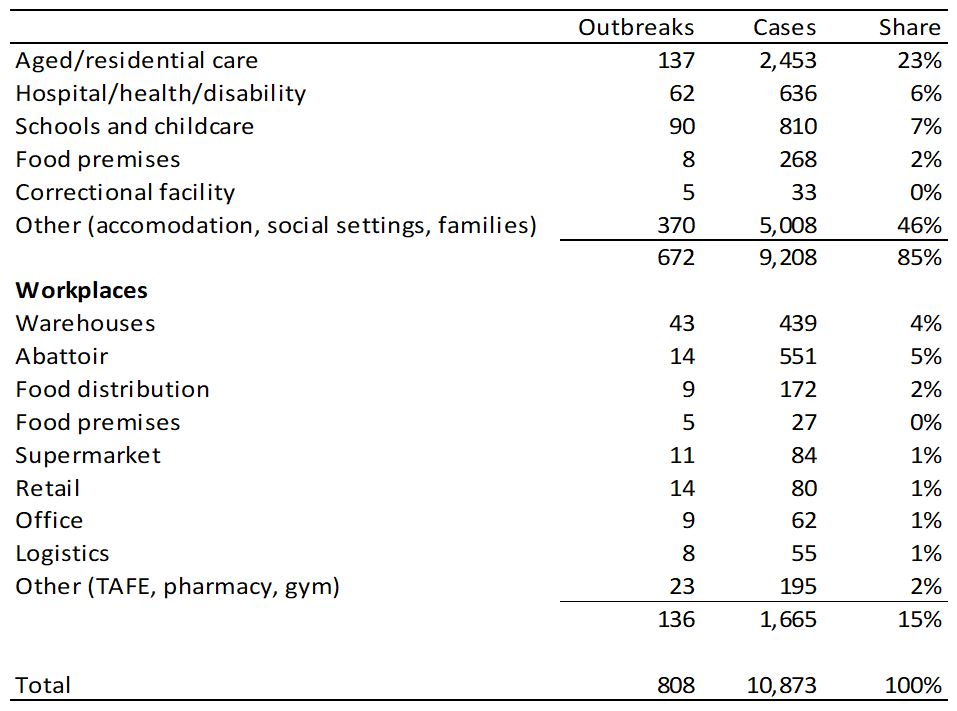
It is unclear exactly how this data has been compiled so interpretation is a little difficult, however it was provided to the press in response to a question about where transmission is happening, with a particular focus on transmission in the workplace. So I am guessing that:
- the large number of cases included in “other (accommodation, social settings, families)” are predominantly household contacts of people who have caught COVID in other settings, along with the family clusters that occurred at the start of Wave Two (approx. 200 cases), and the cases associated with the public housing towers (approx. 380 cases);
- the cases in aged care shown in this table include healthcare workers who work in aged care as well as residents (the graph above shows residents only in the aged care group); and
- the cases in schools and childcare include the large cluster of 185 cases associated with the Al Taqwa school.
Risk 1 – Food production and distribution
As shown in the table, workplace transmission cases are dominated by warehouses, abattoirs and food distribution centres. It is unclear whether food cold storage facilities are included within warehouses or food distribution.
The data released on clusters shows that there have been outbreaks in four abattoirs, thrr poultry processing facilities and two smallgoods producers, with an outbreak in a fourth poultry farm advised on 11 August. One of the abattoirs, JBS Brooklyn with around 140 cases, has had a second outbreak in the last few days and as a result have decided to close operations and furlough staff until the current COVID crisis has passed.
Abattoirs and the like have had huge problems with COVID-19 around the world. The conditions are ideal for the virus – cool temperatures, often fixed production lines that dont enable social distancing, noisy environments so people have to either project their voices or get close to each other, multiple handling by many people of the same item (i.e. the carcas). Under stage 4 restrictions, production for these workplaces will be scaled down to 66% of capacity (abattoirs) or 80% (poultry processing), and all workers will be required to wear hospital grade PPE. It is unclear what impact the scaling down measures will have on the number of transmissions (in my opinion, COVID either gets into the workplace and lots of people contract it, or it doesn’t get in at all). The measure that could make a real difference is the use of PPE, however that usage must be effective, and will be highly dependent on the abilities of those not used to wearing it.
With food supply obviously continuing under Stage 4 restrictions, these food production and distribution outlets continue to be a clear source of transmission risk.
Risk 2 – Aged Care and Health Care workers[v]
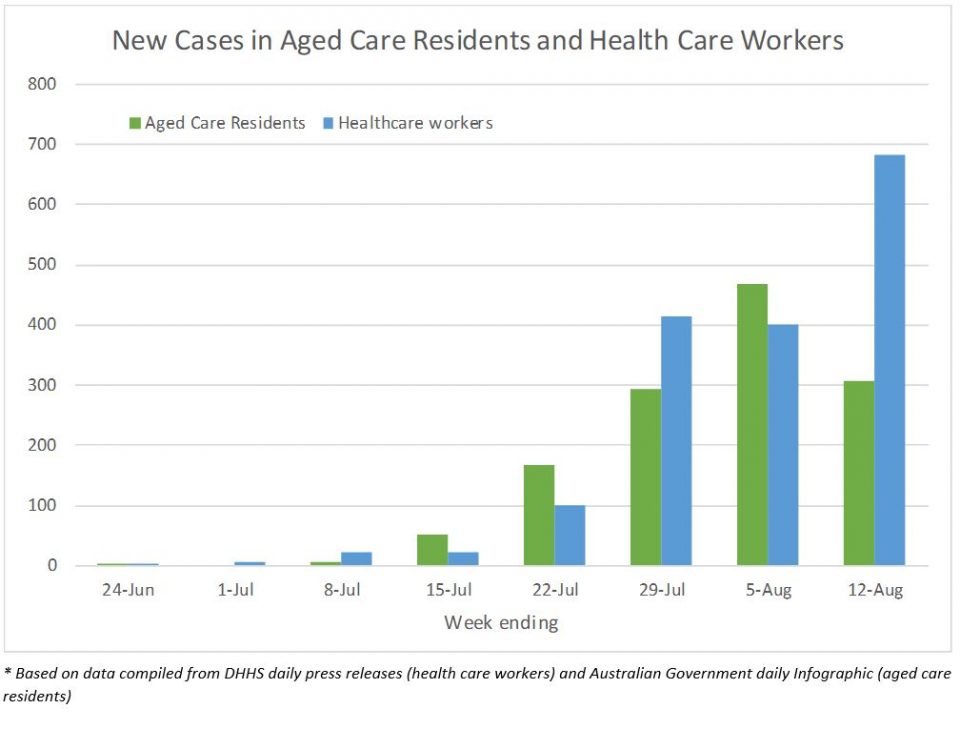
Cases in aged care residents are the major tragedy of this second wave, and are the collateral damage of widespread community transmission. Since Wave Two began, there have been around 1,300 cases diagnosed in aged care residents in over 100 different facilities. Over the last week, around 45 new cases have been diagnosed per day in aged care residents; the equivalent of more than one Newmarch House-sized outbreak every day. These cases made up just over 10% of new cases reported this week, more than four weeks since infections in aged care settings began. It is unclear to me why infections in these settings are continuing.
Cases in health care workers (including aged care workers) number around 1,800 in the second wave. Of these, around 1,200 are from aged care settings. The number of new cases in health care workers continues to grow dramatically, with an average of almost 100 new cases per day over the last week. Cases in health care workers comprised about a quarter of all new cases this week.
For both of these groups, stage 4 restrictions will have little/no impact on their day-to-day lives relative to stage 3 restrictions. However both groups will benefit from a lower overall prevalence in the community.
The largest aged care outbreak has almost 200 cases associated with it (including residents, aged care workers and contacts), and the tenth largest has around 80 cases. It is quite easy to see that a small number of outbreaks in new aged care homes, or the continuation of existing outbreaks, can threaten any reductions in case numbers seen in other areas of the community.
Risk 3 – Regional Victoria
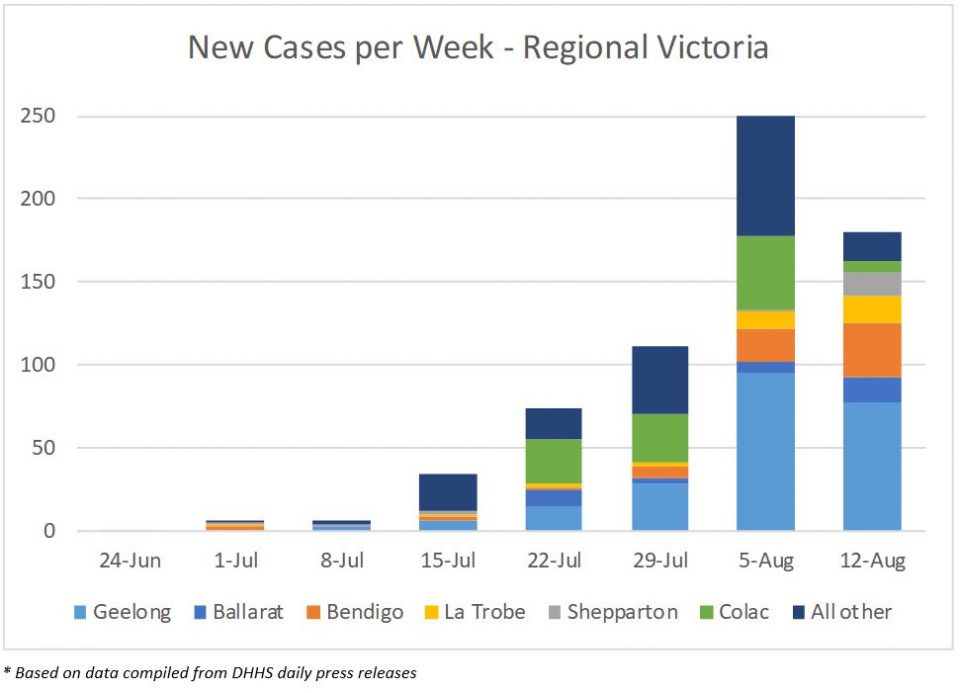
In the same way that there were porous borders between the lockdown suburbs and the rest of metro Melbourne, the borders between Melbourne and regional Victoria have also been porous, with people being able to cross the boundary for work and education purposes.
Case numbers in regional Victoria had been climbing each week, but the number of new cases reported was lower in this last week. Some cases are linked to known clusters (e.g. the Australian Lamb meatworks cluster is located in the Colac region), and numbers in those clusters have been lower. However, the number of cases in some regional centres remain a concern, particularly Geelong, Bendigo and Ballarat – mentioned by the Premier in the press conference held on 12 August.
One other point worth noting is that on 12 August there were 238 cases that have an “unknown” LGA attached, the bulk of which have been recorded in the last 2-3 weeks. These have all been included in the “metro Melbourne” figures for reporting purposes. It is unclear why these cases have an unknown LGA and if a portion of them should perhaps be coded to regional Victoria?
Some final thoughts
While it appears that the Victorian case numbers are now heading in the right direction, significant risks remain that the numbers will not fall away quickly.
It is critical that the issues in aged care and healthcare workers are addressed and numbers brought under control. Cases in aged care settings have a huge impact on the number of deaths. Given the delay between diagnosis and death, we should expect to see high numbers of deaths continue to be reported for at least the next two weeks, and even longer if infection rates are not quickly brought under control.
And while focussing on the big problem in Melbourne, regional Victoria cannot be forgotten. There is risk of significant transmission in these regional areas while they remain at Stage 3 lockdown, particularly in the larger centres.
The other thought that occurs to me is the huge numbers of cases in household contacts. Is it considered inevitable that household transmission will occur? Is this perhaps an area for public health messaging?
On a personal note, I would like to send my best wishes to my family and friends in Victoria, and to all Victorians. Our thoughts are with you.
[i] Public Health Laboratory Network evidence review on the utility of COVID-19 testing to reduce the 14-day quarantine period, 25 May 2020
[ii] I have not found any daily/weekly statistics on either how long it takes people to get tested after symptoms emerge, or how long it takes to get test results back. There has been some ad hoc reporting on these measures, but nothing that would enable a thorough analysis or conclusions to be drawn.
[iii] https://www.mja.com.au/journal/2020/victorias-response-resurgence-covid-19-has-averted-9000-37000-cases-july-2020?utm_source=carousel&utm_medium=web&utm_campaign=homepage
[iv] Sydney Morning Herald on 8 August
[v] The information provided by DHHS on aged care is a little ad hoc. DHHS do not regularly report on the number of cases in aged care residents alone (as opposed to staff/contacts), and there is a double count of aged care staff in their “aged care” cases and “healthcare worker” cases. The Infographic data does not reconcile perfectly to the DHHS data, I think due to timing issues, but it is close enough for this purpose.
CPD: Actuaries Institute Members can claim two CPD points for every hour of reading articles on Actuaries Digital.


