


SG Level, Benefit Adequacy and Investment Performance Fluctuations – Part 1
In the first of a two-part series, Colin Grenfell, of the Institute’s Superannuation Projections and Disclosure (SPD) subcommittee, provides an insightful assessment of hypotheses on defined contribution superannuation plans and setting the Superannuation Guarantee.
First hypothesis: “The impact of fluctuations in investment performance on benefit outcomes for members of defined contribution superannuation plans can be significant”.
Second hypothesis: “Setting the Superannuation Guarantee (SG) at 9.5% or 12% will only provide adequate superannuation benefits if you either work a lot longer than 40 years or if you benefit from above average investment performance.”
Most consumers who understand what a defined contribution superannuation plan is should understand the first hypothesis. But the second hypothesis may come as a surprise.
This article explains, and hopefully justifies, both the hypotheses. However, the many aspects of “benefit adequacy” and retirees’ consumption needs are beyond the scope of this article; those who are interested in that topic are referred to an Actuaries Digital article by Young Tan and the SPD which was published on 21 February 2020, entitled Retirement Adequacy – A Case for a Hybrid Measure.
For the purposes of this article benefit adequacy is judged solely against a before tax and indexed income benchmark of 65% of final salary at retirement. Foremost, this is an article about recognising the importance of investment performance fluctuations.
Throughout this article, please click the figures in order to view in full size.
The Comparison
To illustrate the second hypothesis above, we compare three lifetime projections:
- 200 scenarios based on SG at 9.5% of salary from age 27 to age 67 then with an allocated pension drawing 65% final salary per annum (indexed);
- 200 scenarios based on SG at 12% of salary from age 27 to age 67 then with an allocated pension drawing 65% final salary per annum (indexed); and
- 200 scenarios based on SG at 12% plus 3% (non-concessional from members) of salary from age 27 to age 67 then with an allocated pension drawing 65% final salary per annum (indexed).
A key aspect of this comparison is that, measured in wage-adjusted today’s dollars, all 600 scenarios have exactly the same retirement income until the allocated pensions run out. In consequence the pensions from (a) run out earlier than (b), and the pensions from (b) run out earlier than (c). There is no allowance for mortality or other decrements – the projections run from age 27 to 127.
Each of the projections allow for:
- 40 years of Balanced (70% growth) investment returns net of tax and net of investment and administration fees,
- 40 years of deducted insurance premiums and contribution taxes,
- post-retirement Aggressive Capital Stable (50% growth) investment returns, plus imputation credits, and net of investment and administration fees, and
- a base initial annual salary of $100,000 with everything linked to and deflated by Average Weekly Ordinary-time Wages (AWOTE).
The Assumptions
The assumptions are:
- A deduction of .875% of salary to cover the cost of insurance premiums – this was the level the SPD recommended to ASFA and the ISWG in October 2017 for use in generalised projections.
- Pre-retirement – a deduction of $72 plus 0.3% of account balances per annum for administration. This is the average administration fees for MySuper products included in the November 2019 APRA Heatmap.
- Post retirement – a deduction of $152 plus 0.1% of account balances per annum for administration. This is the average of three large Industry Super plans’ pension product administration fees.
- Except for 5) below, other assumptions are from the “standards” built-in to the Austmod Investment Simulation model and documented in the Actuaries Institute and Berlin 2018 ICA papers “Australian Investment Performance 1959 to 2017 (and Investment Assumptions for Stochastic Models)” by myself and Tom Sneddon. Those assumptions were for “use until about 2020” so we have now reduced all before tax annual investment returns by 0.5%.
- for tax purposes, the dividend yield on Australian Shares has been increased from 3.5% to 4.5% (this has marginally increased earnings due to imputation credits).
The following is a comparison with Treasury’s “Accumulation of superannuation across a lifetime”[1].The Treasury assumptions are now also used as the default in ASIC’s Money-smart retirement planner.
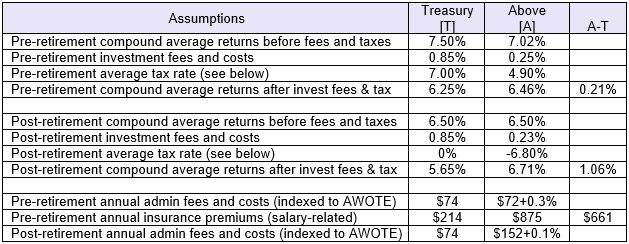
Both A and T above assume that “average tax rate” = (compound average return before tax and fees – return after tax but before fees)/(compound average return before tax and fees). It is not the basis used in Austmod and commonly used by other market participants. The latter is (mean return before tax but after fees – mean return after tax and fees)/(mean return before tax but after fees).
A possible explanation of the significant difference between the assumed post-retirement average returns is that Treasury assume a “more conservative investment strategy post retirement” which is probably Capital Stable with about 35% to 40% growth. We have allowed for 50% growth. Even though you may get better outcomes with more growth (the AGA’s recent work concurs), people’s tolerance for investment volatility in retirement acts as a constraint. This difference is partly offset by the significantly higher insurance premiums allowed for pre-retirement. The SPD felt that the Treasury estimate of $214 is too low, particularly for white-collar employees with default insurance cover (and any additional insurance) related to salary.
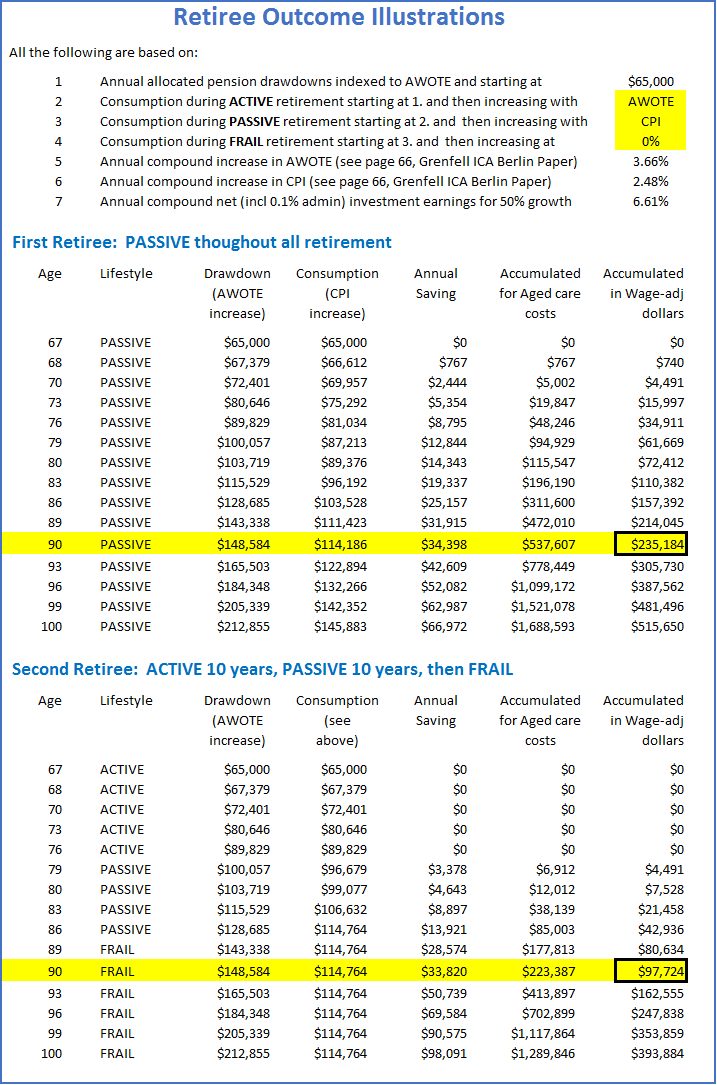
Benefit Adequacy Post Retirement
The comparisons described above and illustrated below, allow for allocated pension drawdowns to commence at 65% of final salary and then to be indexed proportionately to AWOTE. A drawdown increasing with AWOTE does not necessarily signify that we are allowing for consumption to also increase with AWOTE. The following illustration allows for drawdowns to increase with AWOTE but when, and if, consumption increases at a lower rate the “excess” drawdowns are saved (and invested) to offset later, sudden and possibly significant, aged care costs.
The illustrations in Figure 1 below show how a sum of approximately $100,000 to $200,000 in today’s dollars (wage-adjusted) could be accumulated by age 90 to offset aged care costs.
Figure 1.
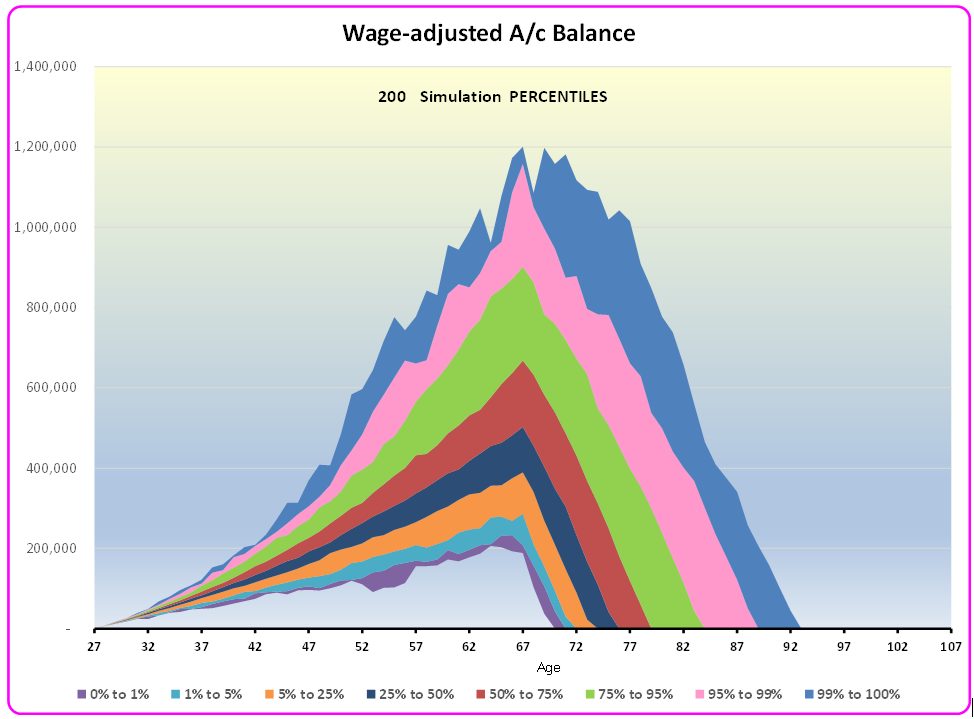
With SG at 9.5%
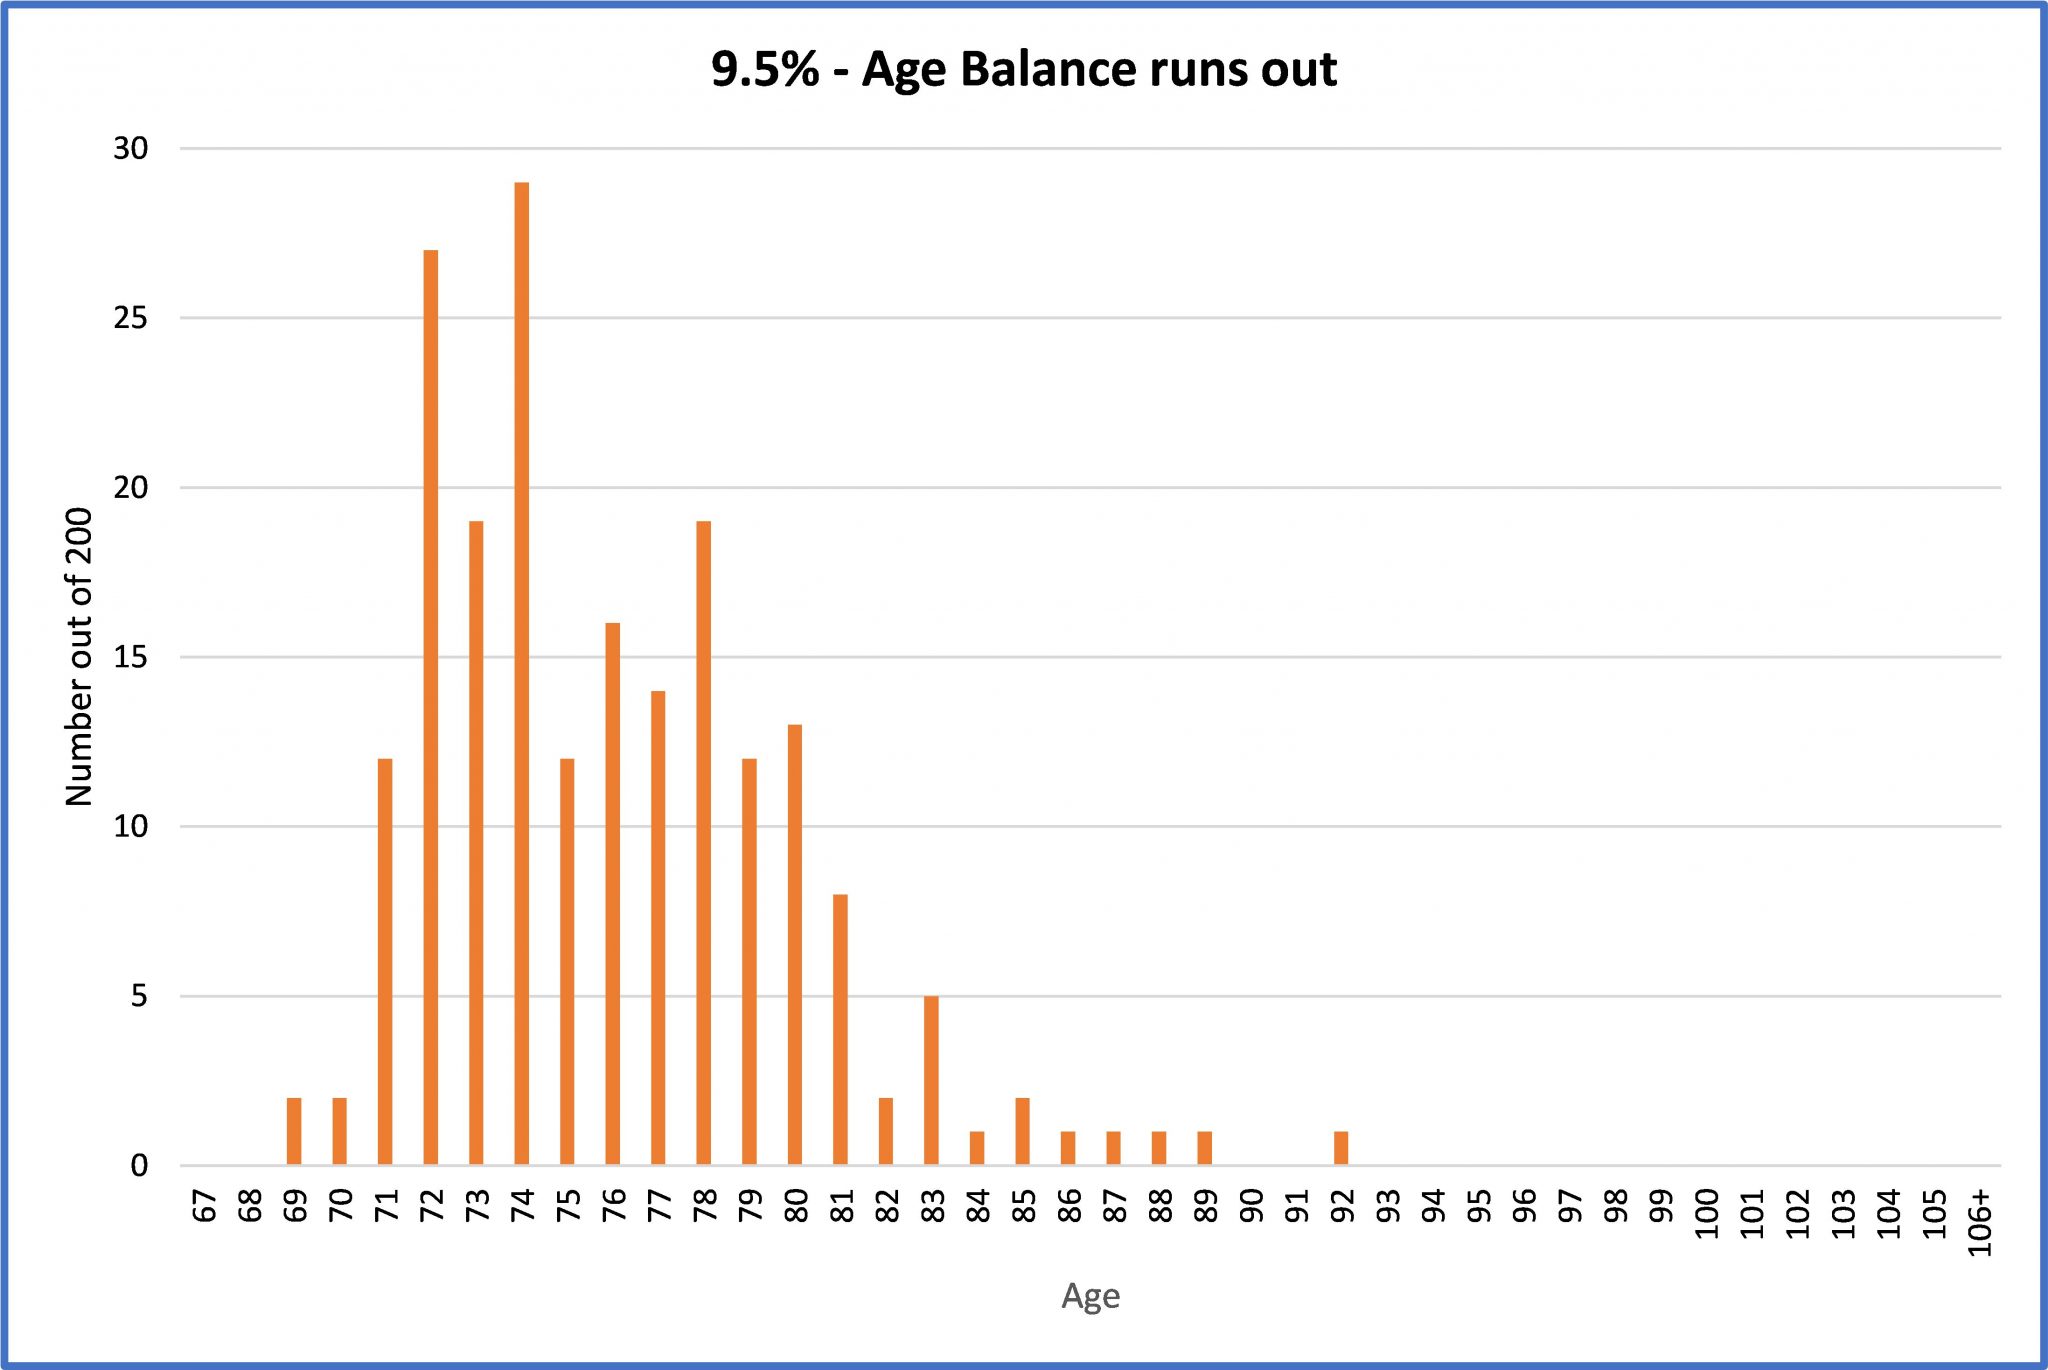
The SG contribution is currently 9.5% of ordinary times earnings (OTE) and is paid on top of wages or salary. OTE is usually the amount you earn for your ordinary hours of work and includes commissions, shift loadings and allowances, bonuses and any over-award payments. The 9.5% is legislated to increase to 10% from 1 July 2021 and then to increase gradually to 12% from 1 July 2025. Figures 2, 3 and 4 below illustrate the outcome if the SG were to remain at the current 9.5%.
Figure 2.
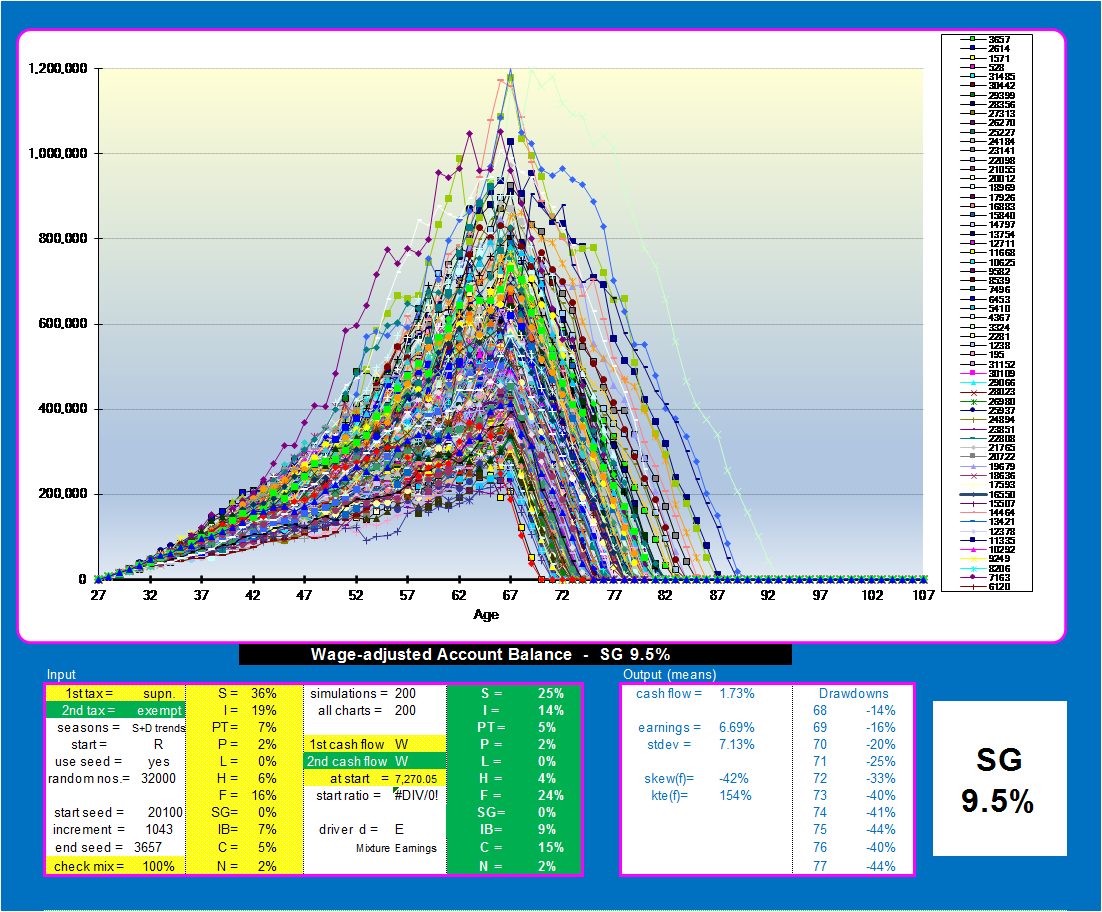
All Figures in this article are based on the Austmod investment simulation model and documented in Section 16 of the Berlin 2018 ICA paper “Australian Investment Performance 1959 to 2017 (and Investment Assumptions for Stochastic Models)” and are based on specified assumptions for:
-
Long-term expected mean investment returns
-
Standard deviations, skewness and kurtosis
-
Rank cross-correlations
-
Auto-correlations for Shares and 10-year Bonds
-
Tax rates and imputation credits on investment income
-
Deferred tax rates on capital gains and losses
-
Wholesale passive investment fees
Figures 3 and 4.
With SG at 12%
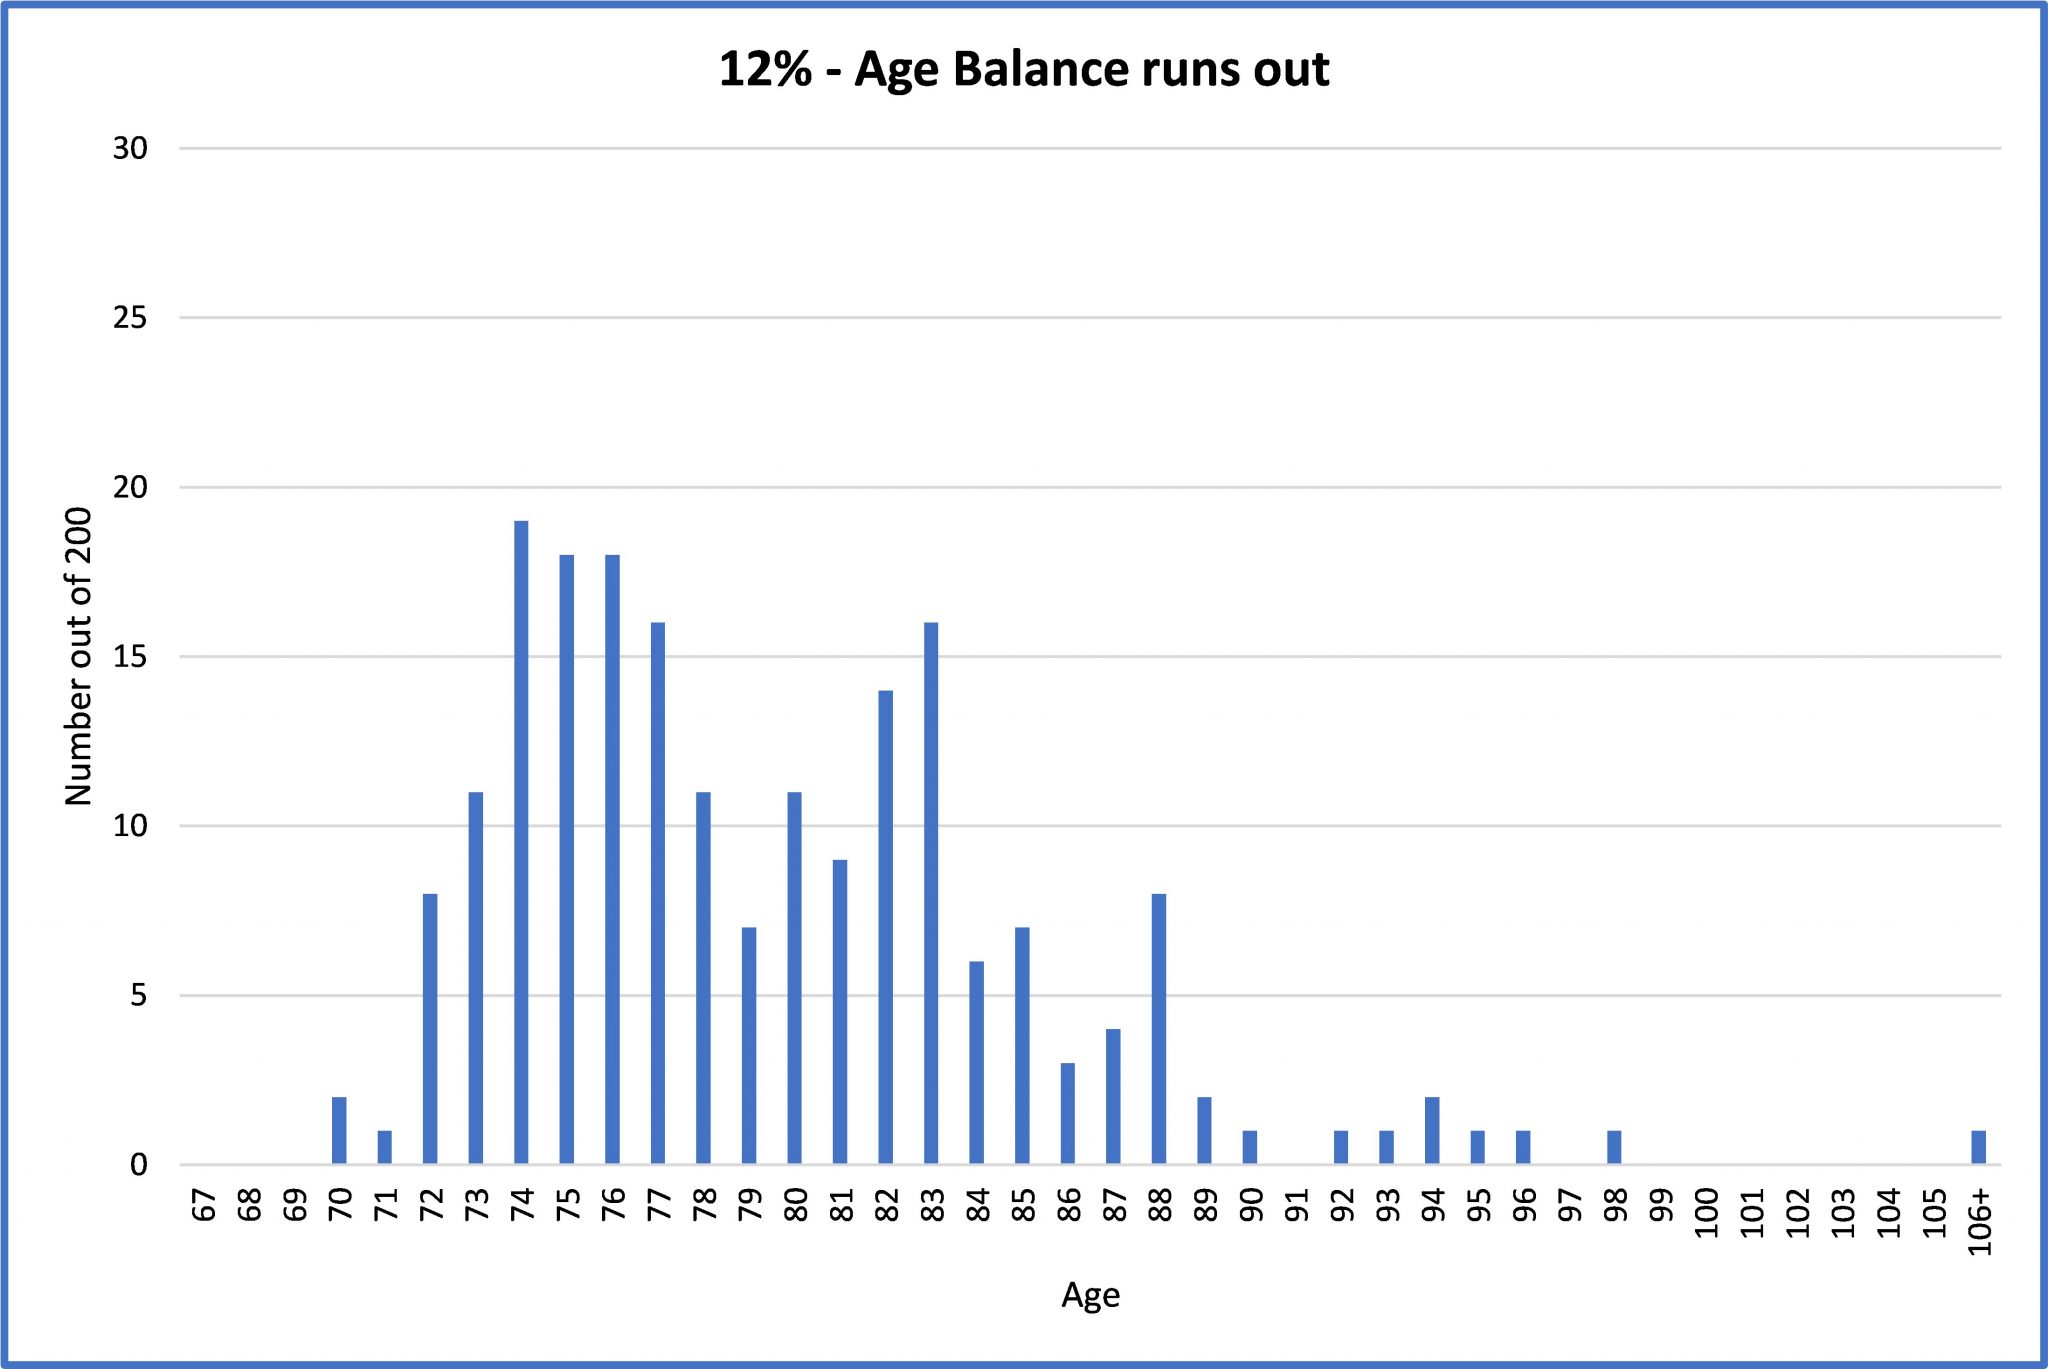
The SG contribution is legislated to increase to 12% from 1 July 2025. Figure 5 below illustrates the outcome if the SG were to be 12% from age 27 to age 67.
Figure 5.
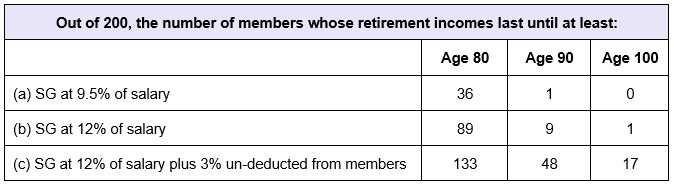
The benefit outcomes in Figures 2 to 4 show that only one of the 200 members has a positive account balance at age 90 and is able to continue withdrawing their target income (i.e. $65,000 per annum in wage-adjusted today’s dollars). This is clearly unsatisfactory; a 9.5% SG contribution does not, by itself, provide an adequate lifetime income for 199 out of the 200 members (if they live beyond age 90).
The benefit outcomes in Figure 5 are better – but they still show that only nine out of the 200 members have an account balance at age 90. A 12% SG contribution does not, by itself, provide an adequate lifetime income for 191 out of the 200 members (if they live beyond age 90).
With SG at 12% plus 3% from Members
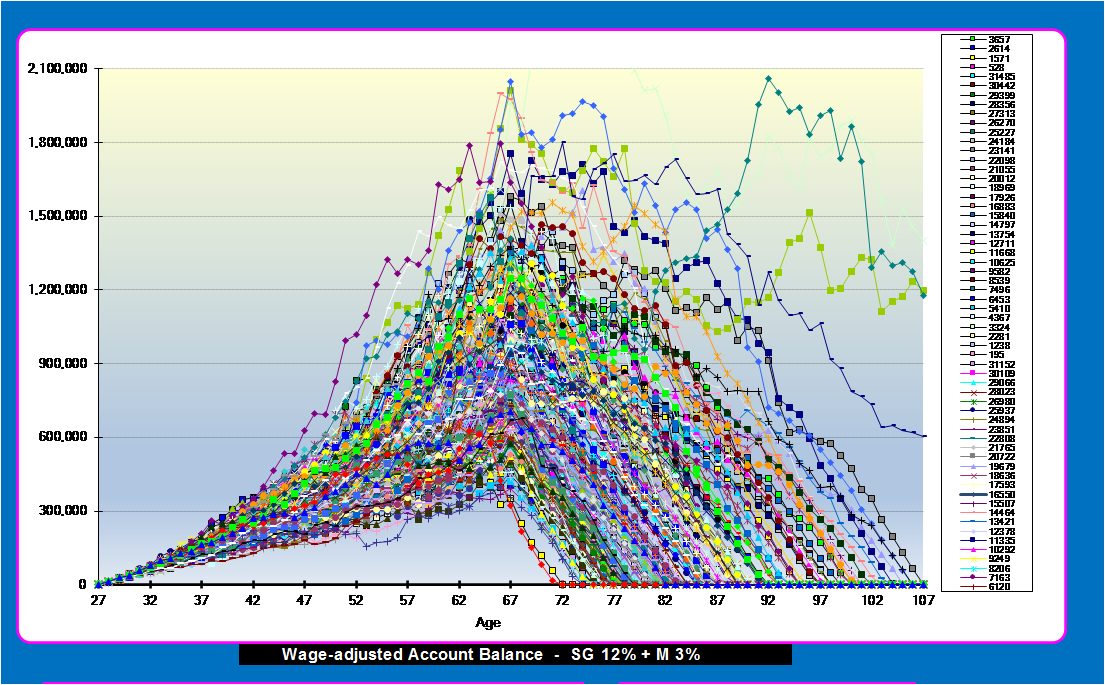
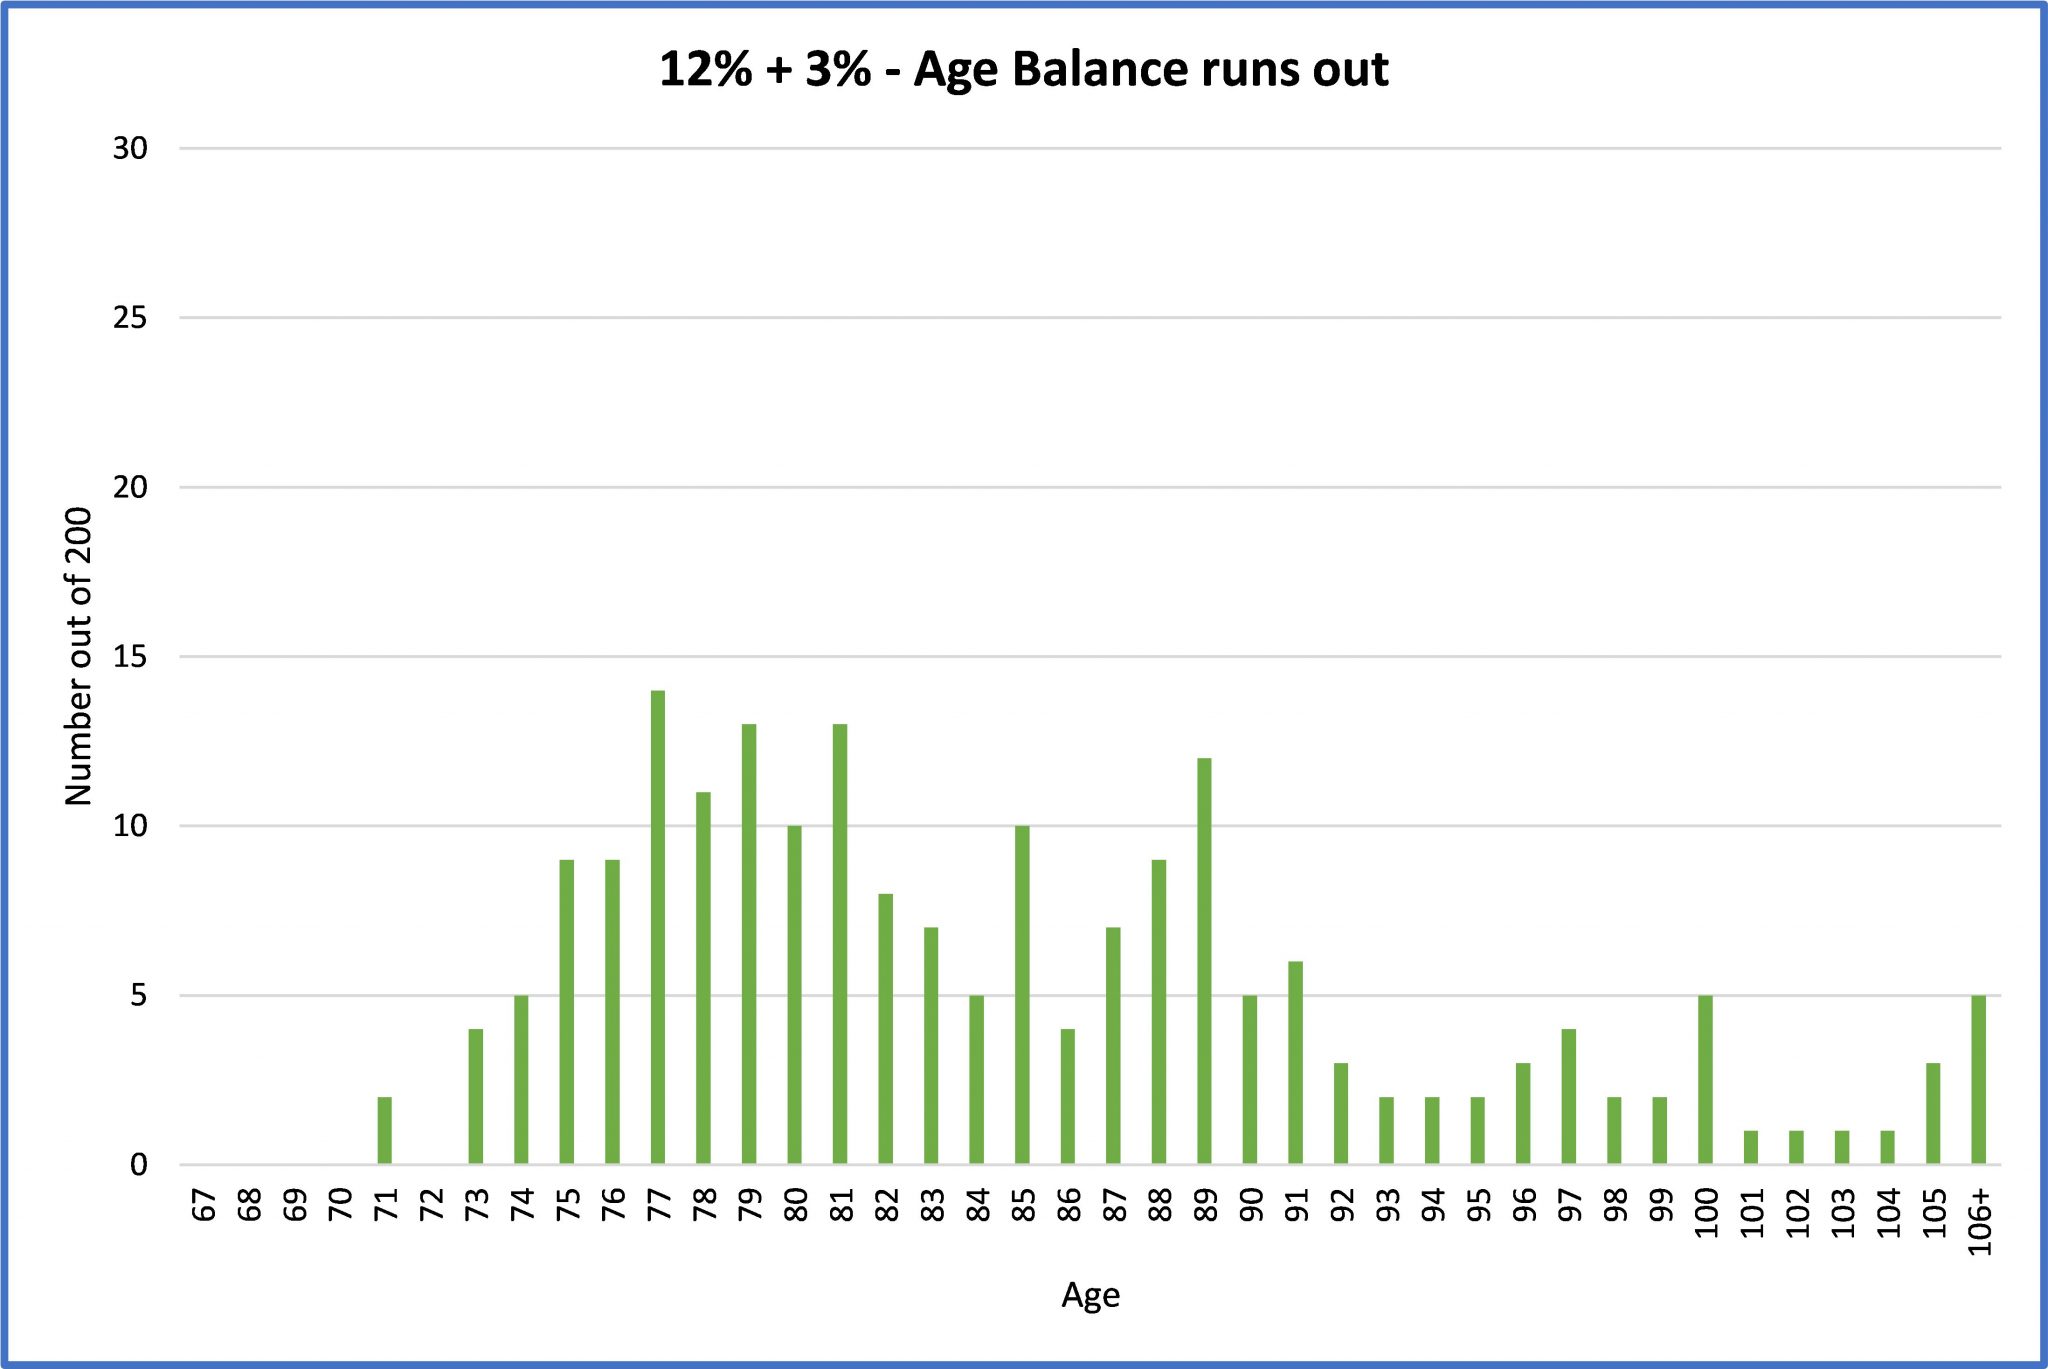
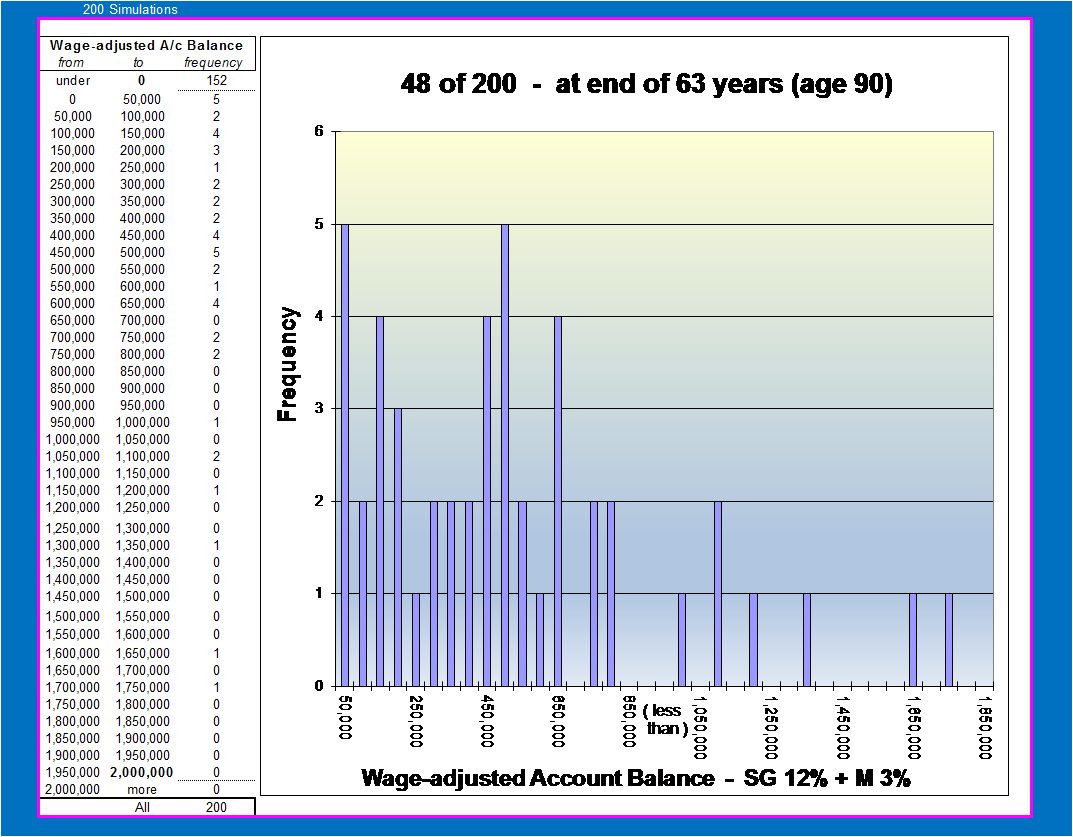
Figures 6 to 8 below show, as expected, that better outcomes are likely if members contribute 3%, in addition to the 12% SG. However even this level of contributions, which the calculations assume will cover 40 years without a break, still shows that only 48 out of the 200 members have an account balance at age 90.
Figure 8 shows the Account Balance (in wage-adjusted today’s dollars) at age 90 for the fortunate 48 members whose target income level lasts that long.
Figures 6, 7, and 8
Summary for far
Figures 1 to 8 above are all based on an initial annual salary of $100,000 without allowance for the Age Pension. Less significantly they also do not allow for the allocated pension minimum drawdown rules. The results are summarised in the table immediately below and are valid for all salary levels.
Figures 4, 5, 6 and 7 in particular show very different benefit outcomes for each of the 200 members within each of the three groups, even though all the members have the same starting age and contribution history. This should be sufficient to explain and hopefully justify the first hypothesis:
First hypothesis: “The impact of fluctuations in investment performance on benefit outcomes for members of defined contribution superannuation plans can be significant”.
But the second hypothesis requires further considerations – which will be examined in part 2 of this article.
Superannuation Projections and Disclosure subcommittee
- Estelle Liu, Convenor
- Bill Buttler
- David Carruthers
- Esther Conway
- Colin Grenfell
- Jim Hennington, former member
- Jean Nette Koay
- Ian Fryer
- David Orford
- Young Tan
- Rein Van Rooyen
- Brnic Van Wyk
- Richard Starkey
[1] Lavers et al, “Accumulation of superannuation across a lifetime”, Treasury Research Institute, 29 November 2019. URL: https://research.treasury.gov.au/treasurys-two-cents/accumulation-superannuation-across-lifetime
CPD: Actuaries Institute Members can claim two CPD points for every hour of reading articles on Actuaries Digital.


