


Insights into SARS-COV-2 – Data, Outcomes and Transmission
Actuaries Love Data
The more data actuaries get the more we believe we can model it. But often, the more we model data the more we forget that our models will never be perfect!
This article will, hopefully, help actuaries understand the SARS-COV-2 data that is published by the World Health Organisation. The article looks at the third, overlooked, outcome for a person who has the COVID-19 disease. Then it looks at a recent study of turbulent gas cloud physics. This should help actuaries better understand the transmission of this virus which is already leading to new methods of containment in Western countries. This article seeks to inform those who are designing actuarial models so that they can include parameters that will provide better insights into the progression of the COVID-19 pandemic and its outcomes.
Data sources from China
A good place to start is data from China, since China provided the first epidemiological data sets. Maria van Kerkhove, a WHO epidemiologist who took part in an international mission to China found data dramatically understated their numbers of COVID-19 patients and the deaths caused by this disease1. There were two reasons for this. Their hospital systems were not prepared for the caseloads that eventuated. It is likely that they were initially unaware of the scope of this disease that originated in Wuhan and were also unaware of the severity and rate of infection (R0); the likely death rate or the long-term clinical consequences of surviving a severe form of this disease. China soon made up for this quickly with many epidemiological papers detailing what was being learned. I have referenced some of these papers in previous articles.
The first reported number of cases in China (571) was for 22 January 2020. The following day Wuhan, the epicentre of the virus and several other cities in the Hubei province were locked down by the Chinese government. Chinese sources suggest that the first cases of an unusual pneumonia occurred in late November 2019 and there were many more in December. Therefore, the disease is called COVID-19 and not COVID-20. From 22 January to 29 January there would have been a huge catch-up in reporting as widespread testing got underway and many previously unreported cases were then reported. Hence the average daily rate of increase for that week was 63.3%. The following week the average rate of growth slowed unbelievably to just 6.2%. However, there was a problem with the test that determined who had the disease.
The reverse-transcription polymerase chain reaction (RT-PCR) serology test of many people presenting with COVID-19 symptoms showed they didn’t have the disease. A later Chinese paper2 showed there was a 31% false negative rate for this test. This was the only test available to determine who had transmitted COVID-19 at that time. In late March cheap pin-prick antibody tests became available. But these only tell you who has had COVID-19 and has developed antibodies to it. They can’t be used to tell you who has the virus at that time as it takes a week or more for the body to develop the antibodies. Because of the level of false negatives and the backlog of getting test results back from laboratories Chinese authorities decided to include in their number their patients who had had a CAT scan of their lungs that showed the symptoms of COVID-19. This increased the total numbers by around 50% on 12 February and caused the seven-day running average increase to jump from 9.1% to 15.1%. The lockdown in Hubei and restrictions in other cities was also having a big effect by then and the following week showed an average rate of increase of only 3.4% with the next week of 0.7%.
Around 80%-85% people who catch SARS-COV-2 only get a mild form of the disease and recover within a couple of weeks without having to go to hospital. It would seem to these folks that they had had a bad cold or the flu. With the lockdown in place in China many infected folks would not have been able to get a pass to visit a doctor or a hospital when they only had symptoms of a cold and why would they have wanted to? No-one wanted to go anywhere near places where people with COVID-19 were present in case they caught it too! Hence the likelihood that the real numbers of people in China who have had COVID-19 are likely to be much greater than the reported numbers. Also, some elderly people who had a severe form of the disease may not have got treatment for it if their carers were caring for several people with it at the same time or had it themselves and weren’t able to provide care anyway.
The RT-PCR test costs around A$150 to perform so there was, and still is, in China and elsewhere limited availability. This means that there may have been obvious cases treated for the disease without a formal diagnosis. Also, no physician or nurse is going to hold up treatment for a patient who seemingly has COVID-19 and is fighting for their life just because they need a test result which may take 12-24 hours to prove something, which to them was already obvious. In my own experience twelve years ago, I arrived back from working in Indonesia and presented to an emergency department with a high temperature, a pulse of 187, myocarditis, pneumonia and congestive heart failure. The physicians and nurses immediately went to work on me to lessen the risk of my imminent demise and without even wearing personal protective equipment. They did this knowing it was possible that I might have had an exotic tropical disease that would have posed a risk to themselves. A doctor confided in me two days later when the initial test results came back that he had been quite worried about that possibility for himself and the nursing staff.
I therefore recommend extreme caution in using Chinese data for modelling. A lot of data is missing and the timing of the data there is not consistent because of catchups and definition changes.
Data sources from Italy
The Italian hospital system was also quickly overwhelmed by the number of COVID-19 patients. The virus was almost certainly circulating in Northern Italy before January 2020. If this is the case, then many citizens may have had a mild form of the disease and unfortunately it was transmitted at a higher rate among the community. Further, in Northern Italy, it is common for three generations of a family to live under the same roof, increasing exposure to multiple people. These are perfect conditions for the spread of this virus, particularly to older people who are more likely to suffer a severe form of this disease. Hence the reported death rate in Italy has been extraordinarily high but the numbers infected are likely to be understated by several orders of magnitude. For the above reasons, differences in initial time of outbreak and general living arrangements, it is recommended that data from Italy isn’t used for close modelling in Australia.
Other European Data
Several countries in Europe are battling similar issues to Italy, reacting with shutdowns far too long after community spread of the virus had taken hold. As a result, their reported numbers of COVID-19 cases are likely to only reveal part of the true level of infection in those countries. Germany may be an exception. Its COVID-19 mortality rate is about 10% of those of Italy and Spain. It is about a quarter of that of the UK and a sixth of the mortality rate of France. But Germany’s health care system is generally superior to other countries in Europe. It is also very well-funded. Members of the public health insurance scheme compulsorily pay 15.5% of their wages to be covered. If I was basing modelling for Australia, I would use German data above any other country in Europe. Clearly models must also allow for government interventions to reduce the spread and the earlier these occur the greater the effect on eventual outcomes. Sweden is an interesting country. Although the government have not ordered a lockdown the Swedish people have effectively instituted one anyway. Data from Sweden may be useful in a modelling exercise. However their testing per head of population is about half of Australia’s.
Outcomes
The outcome for a person with a mild form of this disease is a full recovery. There are only two possible outcomes for a person that has a severe form of this disease. The first outcome is death. The second is survival but with damaged lung tissue, which may take a long time to heal. The older the person is the longer their lungs are likely to take to heal. Intensive care physicians have suggested that for many people with serious lung damage complete recovery could be long-term3. That is, even after recovery, patients will probably require expensive medication, possibly supplemental oxygen sometimes, with frequent medical appointments and a fair degree of disability. For people over age 70 a severe bout of COVID-19 will effectively become a long-term sentence. So, it is not just the death rate of seniors with this disease that is concerning but governments and actuaries must also be concerned about the life-long costs to their health systems of survivors of severe COVID-19 illnesses.
Transmission
To understand the transmission of respiratory pathogens we need to understand the physics of the transmission as well as the bioscience on the interaction of the pathogen with human cells in order for reproduction to occur.
The following is the introduction to a paper published by the Journal of the American Medical Association on March 26, 20204. “The current coronavirus disease 2019 (COVID-19) outbreak vividly demonstrates the burden that respiratory infectious diseases impose in an intimately connected world. Unprecedented containment and mitigation policies have been implemented in an effort to limit the spread of COVID-19, including travel restrictions, screening and testing of travellers, isolation and quarantine, and school closures. A key goal of such policies is to decrease the encounters between infected individuals and susceptible individuals and decelerate the rate of transmission. Although such social distancing strategies are critical in the current time of pandemic, it may seem surprising that the current understanding of the routes of host-to-host transmission in respiratory infectious diseases are predicated on a model of disease transmission developed in the 1930s that, by modern standards, seems overly simplified. Implementing public health recommendations based on these older models may limit the effectiveness of the proposed interventions.”
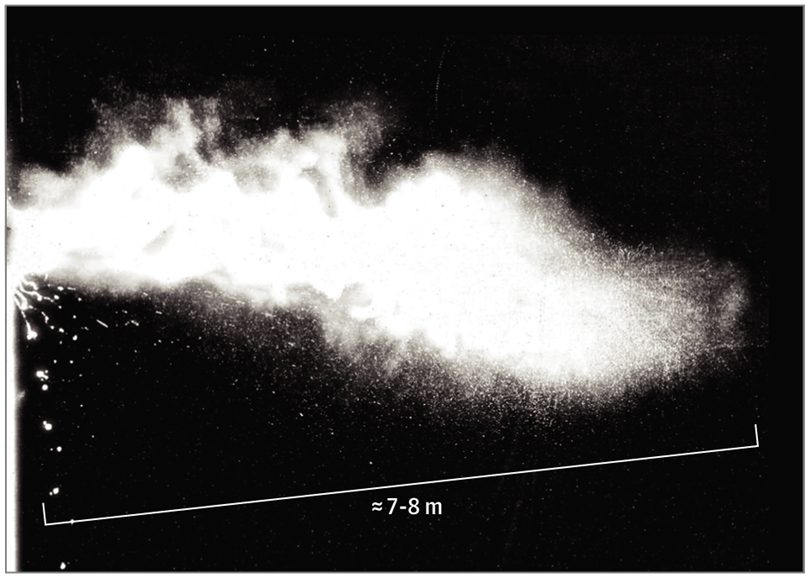
The paper and its references then describe from fluid dynamics how the virus is spread through the air and effectively becomes aerosolised. Without going into detail, very fine droplets resulting out of processes within the turbulent moist air emanating from our nose and mouth evaporate quickly leaving clumps of virus particles and mucous suspended in the air. These can remain suspended for several hours and be transported by air currents including un or poorly filtered air conditioning over considerable distances. In a still environment these tiny droplets can be projected four meters with normal breathing, six meters with a cough and eight meters with a sneeze. The figure shows a multiphase turbulent gas cloud from a human sneeze.
This paper, and those it refers to, help to explain why 712 passengers and crew on the cruise ship Diamond Princess became infected and 622 (with more to come) passengers and crew on the Ruby Princess. It also makes a plea for the design of face masks to be improved by incorporating studies of turbulent gas cloud dynamics.
In any event, people who have COVID-19 are doing everyone a favour if they wear a face mask in a public place as this restricts the spread of the turbulent gas cloud containing the virus. People that don’t have the virus have a significantly reduced likelihood of breathing in the virus if they are wearing their own face masks.
As many people with this disease are asymptomatic for part or even all of the time that they have the disease it would be sensible for governments to mandate the use of masks in all closed environment public places. This has already occurred in the Czech Republic, Austria, Slovenia, Bosnia as well as many Asian countries. Asian countries that adopted this practice early in this pandemic, seemed to have flattened the virus curve early too. Germany and even the US are likely to also mandate this requirement in the next few days. I expect to see this practice adopted in most countries in the next few weeks. In Australia, if the use of masks is also mandated, it could also be followed with the lifting of some of the broader restrictions to curb the spread of the virus. Models need to account for infection through aerosolisation and not just through droplets.
Conclusion
I hope this paper will be helpful in the design of the parameters of actuarial models of this pandemic.
1 China’s revised COVID-19 figures are a bid to ‘leave no case undocumented’: WHO https://www.thehindu.com/news/international/chinas-revised-covid-19-figures-are-a-bid-to-leave-no-case-undocumented-who/article31372223.ece
2“Correlation of Chest CT and RT-PCR Testing in Coronavirus Disease 2019 (COVID-19) in China: A Report of 1014 Cases”, https://pubs.rsna.org/doi/10.1148/radiol.2020200642
3 Doctor’s Note: Can coronavirus cause permanent damage? https://www.aljazeera.com/indepth/features/doctor-note-coronavirus-permanent-damage-200410112235801.html
4 Turbulent Gas Clouds and Respiratory Pathogen Emissions – Potential Implications for Reducing Transmission of COVID-19, Lydia Bourouiba, PhD (MIT) https://jamanetwork.com/journals/jama/fullarticle/2763852
CPD: Actuaries Institute Members can claim two CPD points for every hour of reading articles on Actuaries Digital.


