


Does one size fit all for MySuper members?
BT – part of the Westpac Group, recently conducted the Triennial Review of its MySuper product, specifically to research the overall design of the investment strategy.
The introduction of specific member outcomes legislation[1] emphasises the need for Trustees to review the definition and assessment of member outcomes. Therefore, a core priority of BT’s research was the appropriate characterisation of default members’ financial interests where the member base is demonstrably heterogeneous and a “one size fits all” approach may not promote the financial interests of all members.
Consequently, consideration of member segmentation and representative strawpeople were critical to defining the approach consistent with the Trustees’ obligations to members, including to act in the best interests of members of the relevant superannuation fund as a whole.
Promoting the Financial Interests of Default Members
There are key challenges facing Trustees of default MySuper products in defining and implementing an investment strategy given the membership is relatively less engaged with superannuation. This includes how the Trustee:
- Defines the membership whose collective financial interests are pursued, and how they are represented;
- Defines the objective of the investment strategy and how success will be measured;
- Defines risk in a retirement income context; and
- Ascertains risk preferences of members in the product.
This article focuses on the first challenge –defining the membership and how they are represented.
Know your customers
Are our members homogenous – does one size fit all?
In designing a default retirement income investment strategy, Trustees generally seek to identify the characteristics of the fund’s membership and designate a “typical investor” or “strawperson” as the reference for whom the strategy is designed. In Australia, this is usually identified through the demographics of age and salary. The “strawperson” salary curve used by the Productivity Commission is represented by Figure 1 [2] below:
Defining a retirement income strategy with reference to a single strawperson such as Figure 1 assumes the whole membership base, is represented by it.
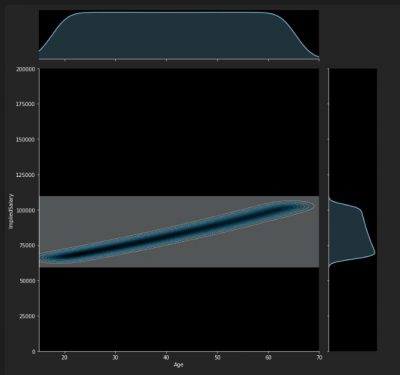
To examine whether the customer population is homogeneous, we plotted a joint distribution of a sample membership base using a joint KDE (Kernel Density Estimation) – the y-axis represents implied salary and the x-axis represents age. A darker coloured contour region represents a higher relative population in that combination of age and salary. Above the joint distribution is the individual distribution by age, and to the right is the individual distribution by implied salary. Figure 2 demonstrates the sample member population compared to a theoretically constructed population in Figure 3 where members are uniformly distributed across both salary and age. Clearly the sample member base is not uniformly distributed – i.e. it is not homogeneous.

Our members are not homogenous – how do we define representative strawpersons?
A “cohort of one” approach i.e. one cohort per member is ideal but maybe impractical – the trustee needs to balance considerations, such as implementation cost and complexity, with the marginal benefit of tailoring.
Given this challenge, we defined 3 member segments which we confirmed using machine learning.
The low-income segment was chosen first, and was objectively set based on the Government Super Co-Contribution cut-off[3].
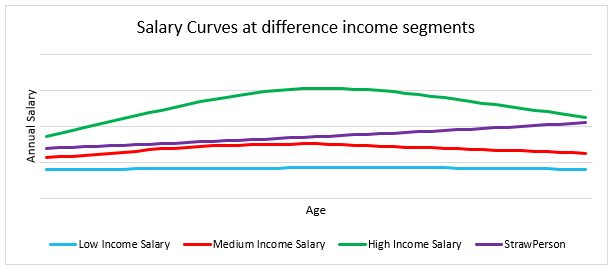
The sub-population above the low-income threshold was split into medium and high-income groups, with the 75TH percentile of the full population as the threshold. This cut-off balanced capturing different salary experiences with representativeness of the population. See Figure 5 for our salary curves. Similar salary curve shapes have been reported by other researchers and practitioners.[4]
Cross checking our assumptions – using sophistication to add value
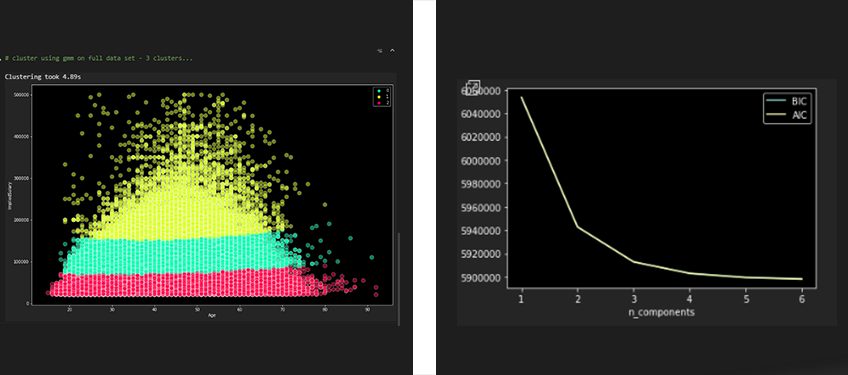
Next, we applied unsupervised machine learning to test our selection of three member segments by salary. Figure 6 shows three clusters fitted using the Gaussian Mixture Model[5].
We evaluated the number of clusters based on Information Criteria analysis. Figure 7 demonstrates the marginal benefit of additional clusters, the lower the value the better the model fit. It shows that three clusters strike a good balance between model complexity and goodness of fit.
We have our segments – why are they relevant?
While there is no legislated objective for superannuation, the objective suggested by the Superannuation (Objective) Bill 2016 is “to provide income in retirement that supplements or substitutes the Age Pension”[6].
Using an income replacement rate to measure potential member outcomes aligns to that objective. Table 1 demonstrates that salary is expected to have a material impact on modelled income replacement rates, therefore, using salary to define member representation for product design and assessment is considered appropriate.
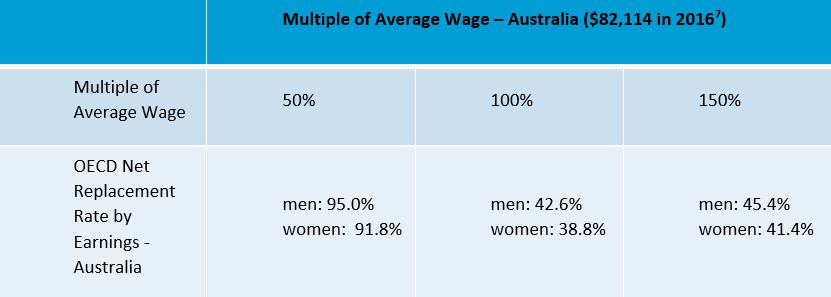
Table 1 demonstrates a clear difference in achievable net income replacement ratio as a function of salary. For members on 50% of the average wage, more of their retirement income will come from the Age Pension, whereas members who are on 100% to 150% of the average wage, will likely be eligible for only the Part Age Pension, or no Pension, due to the Income and Assets Tests[9].
[9] https://www.humanservices.gov.au/individuals/services/centrelink/age-pension/how-much-you-can-get
The gap between the Age Pension and members’ pre-retirement income will therefore increase as pre-retirement income increases, which contributes to reducing the achievable income replacement ratio.
Conclusion
“Knowing Your Customer” is a critical component to designing a default retirement income strategy, but it is only one of many factors trustees need to consider. Once you know your customer, the next question is defining the right objective for your customers, which will be the topic of our next article.
This information is of a general nature only, it does not constitute any recommendation or advice. It has been prepared without taking into account the objectives, financial situation or needs of any particular person. Before acting on this information, a person should consider its appropriateness having regard to these factors. This information provides an overview or summary only and it should not be considered a comprehensive statement on any matter or relied upon as such. Issued by BT Funds Management Limited ABN 63 002 916 458, AFSL No. 233724.
[1] Section 52(9) to 52(11) SIS Act and APRA Prudential Standard SPS 515 – Strategic Planning and Member Outcomes
[2] Superannuation: Assessing Efficiency and Competitiveness, Productivity Commission Inquiry Report, No. 91, 21 December 2018, pg. 103.
[3] https://www.ato.gov.au/individuals/super/in-detail/growing/super-co-contribution/?anchor=Eligibilityforthesupercocontribution#Eligibilityforthesupercocontribution
[4] See the Alonso-Garcia and Sherris paper “One size fits all? Drawdown structures in Australia and The Netherlands”
[5] https://scikit-learn.org/stable/modules/mixture.html
[6] See Commonwealth of Australia, Financial System Inquiry 2014, Final Report Ch. 2.
[7] https://read.oecd-ilibrary.org/social-issues-migration-health/pensions-at-a-glance-2017_pension_glance-2017-en#page139
[8] https://read.oecd-ilibrary.org/social-issues-migration-health/pensions-at-a-glance-2017_pension_glance-2017-en
[9] https://www.humanservices.gov.au/individuals/services/centrelink/age-pension/how-much-you-can-get
CPD: Actuaries Institute Members can claim two CPD points for every hour of reading articles on Actuaries Digital.


