


A Summer of Warm Temperatures and Wild Weather in the East
The Australian Actuaries Climate Index (AACI) results for the summer of 2023/24 show that both low and high temperatures were warmer than usual. In addition, high levels of extreme rainfall and wind were observed in the north east.
The AACI shows that the latest season brought extreme weather in the form of warm temperatures and storms in the north east.
The Central Slopes and Southern Slopes Victoria, which cover eastern parts of Queensland, New South Wales and Victoria, recorded the highest low temperature index value to date. This indicates that minimum temperatures, which tend to occur at night, were above reference period averages. Increases in low temperatures can be associated with increased propagation of diseases, pests, and insects that were previously less likely to survive in lower temperatures, and therefore can reduce agricultural production and impair sleep, amongst key impacts.
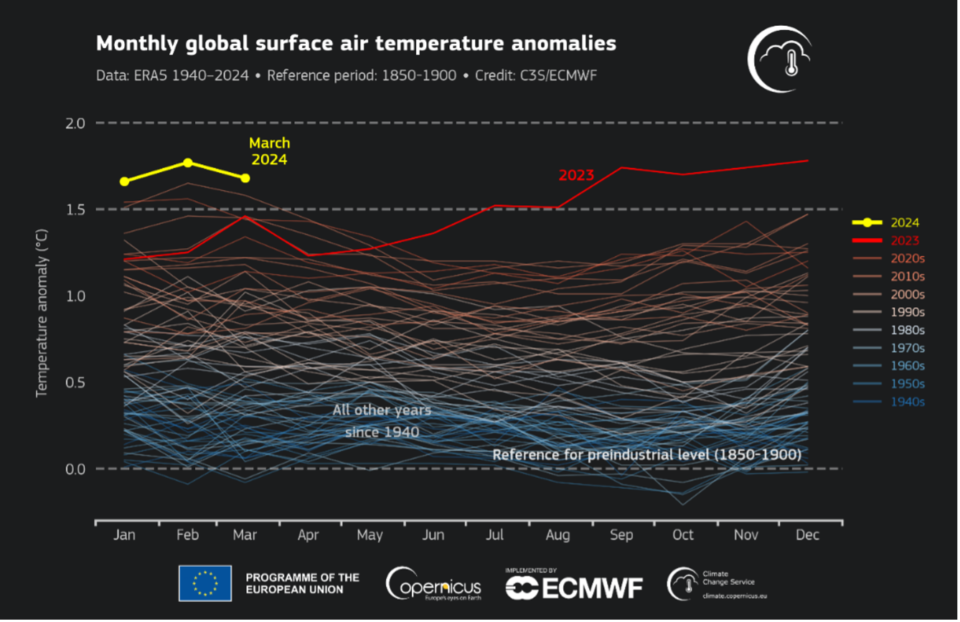
Similarly, the East Coast South and Wet Tropics Clusters, which cover New South Wales and Queensland, observed the third- and fourth-highest high temperature index value to date. These results align with global observations, which indicate that the world has experienced record heat for 10 consecutive months.[1]
Some of this is attributed to climate change and the El Niño Southern Oscillation (ENSO) weather system being in an El Niño phase, which is associated with warmer temperatures. However, the observed temperatures exceed predictions made in light of these phenomena. Reduced air pollution allowing more sunlight to enter, the eruption of an underwater volcano which released greenhouse gases into the stratosphere in January 2022 and the solar cycle have been put forth as possible explanations.[2]
The elevated sea surface temperature is one factor that may have contributed to the fact that the El Niño of 2023 and early 2024 did not show the level of dryness often associated with this phase of the ENSO weather system. Warm sea surface temperatures can push more moisture into the air, leading to greater amounts of rainfall.[3]
In particular, the extreme rainfall index was high in the Wet Tropics, which covers the north eastern parts of Queensland. This region also observed the first positive extreme wind index since the spring of 2021.
This part of the country experienced two cyclones during this period, with Cyclone Jasper making landfall on December 13 and Cyclone Kirrily on January 25. In addition, a severe storm occurred in south Queensland over the Christmas period. This was likely influenced by the Southern Annular Mode (SAM) which was positive for the majority of December and January and is associated with increased rainfall on the eastern parts of the country.[4]
Thunderstorms have a fairly weak relationship with the ENSO weather system and are more difficult to predict at a seasonal level.[5] This means they can occur during an El Niño phase and lead to torrential rain at times, even when the season as a whole is dryer.
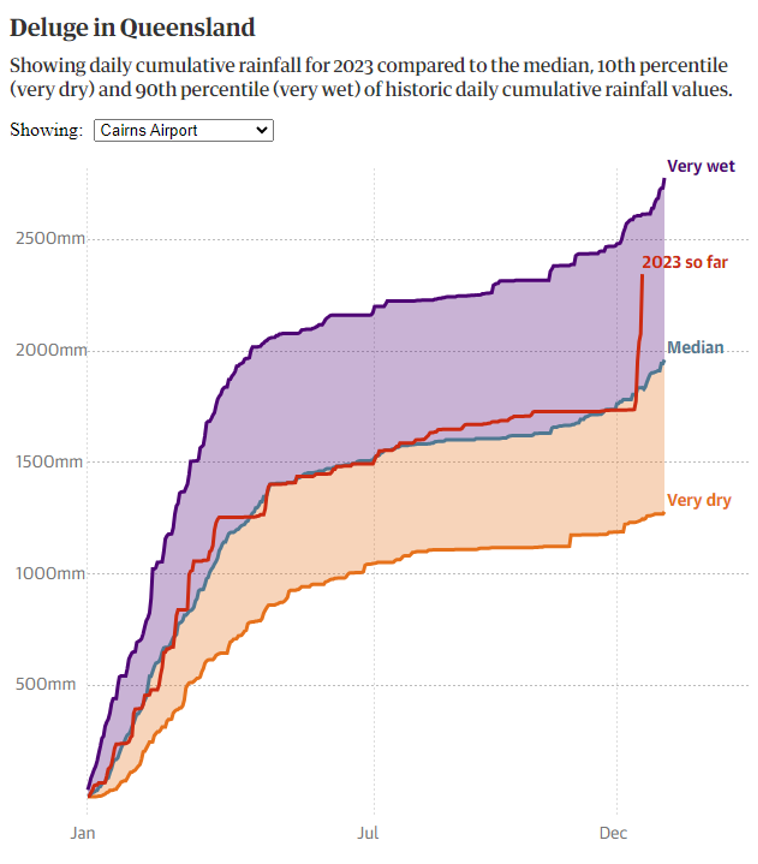
Cyclone Jasper resulted in particularly large amounts of rain due to its slow speed, which had it remaining above Queensland for almost five days. Up to a metre of rain was seen in some parts of the state.[6] The graph below, sourced from The Guardian, shows that while Cyclone Jasper did not result in 2023 exceeding the 90th percentile of historic daily cumulative rainfall values, it increased very sharply from about 1750mm to approximately 2300mm of cumulative rainfall in a matter of days. This was more rainfall than was observed in the six months prior to the event.
Given that the Australian Actuaries Climate Index averages observations over a larger time period and geographical area, it makes sense that several large events, accompanied by mild weather over the season results in a positive, but not record-breaking, rainfall index result.
The Bureau of Meteorology predicts a warmer than average autumn and winter for most of the country. This is anticipated to affect both maximum and minimum temperatures. Globally, significant focus is on the temperatures observed in the northern hemisphere in the summer of 2024, which are expected to shed light on whether the unusually high temperatures seen around the world are an anomaly or not. Meanwhile, rainfall is predicted to be below average for the western and northern parts of Australia.
The Bureau of Meteorology, in conjunction with international atmospheric agencies, is also reconsidering the way in which El Niño and La Niña are defined. The current definition has been in place for approximately two decades but may be refined in order to better reflect the latest scientific understanding and the impact of climate change on global weather patterns.[7]
Background
The AACI measures the frequency of extreme weather conditions and sea levels across Australia and how these vary over time.
It covers extreme high and low temperatures, extreme rainfall, consecutive dry days, extreme wind and sea level. The Index was launched in November 2018 by the Actuaries Institute and is updated four times a year by Finity Consulting for the Actuaries Institute.
Unlike many other measures, the AACI focuses on changes in the extremes. This is a more relevant metric for the insurance industry than averages, as it correlates more closely with damage. This is done by measuring how often we observe the current quarter’s observations exceeding the 99th percentile of the corresponding observations in the reference period of 1981-2010. More details and full results can be found on the microsite.
The purpose of the AACI is to provide a publicly available measure of extreme weather conditions and demonstrate how the capabilities of the actuarial profession can contribute to the assessment of climate risk.
Alongside the North American Actuaries Climate Index[8], it is one of two climate indices produced globally on behalf of actuarial associations and has been referenced extensively in the media and other reports.[9]
References
[1] https://climate.copernicus.eu/copernicus-march-2024-tenth-month-row-be-hottest-record
[2] https://www.abc.net.au/news/2024-04-09/data-can-t-explain-off-the-charts-heat/103649190
[3] https://theconversation.com/were-in-an-el-nino-so-why-has-australia-been-so-wet-219111
[4] http://www.bom.gov.au/climate/sam/
[5] https://theconversation.com/were-in-an-el-nino-so-why-has-australia-been-so-wet-219111
[6] https://www.theguardian.com/australia-news/2023/dec/19/cyclone-jasper-how-did-it-cause-so-much-rain-and-could-global-heating-be-to-blame
[7] https://www.abc.net.au/news/2023-02-11/bureau-of-meteorology-considering-redefining-el-nino-and-la-nina/101959160
[8] https://actuariesclimateindex.org/home/
[9] For example, https://naturaldisaster.royalcommission.gov.au/publications/exhibit-1-006003-shp5010010001-australian-actuaries-climate-index-some-comments-extremes
CPD: Actuaries Institute Members can claim two CPD points for every hour of reading articles on Actuaries Digital.


