


AACI Shows Australia Experienced Warm and Dry Spring in Lead Up to Summer
The Australian Actuaries Climate Index (AACI) results for spring 2023 show the country experienced warm, dry conditions heading into summer. This was particularly pronounced in the south-west.
The latest AACI recorded the 33rd consecutive positive value in the spring of 2023, indicating that the frequency of extreme weather was above the reference period average of 1981-2010 across Australia as a whole.
This season’s positive index value was primarily driven by the southern and western parts of Australia. In particular, the Southern and Southern-Western Flatlands (West) cluster and the Southern Slopes Victoria cluster experienced their highest and second-highest index values, respectively.
The high index values of both clusters were largely driven by extreme high temperatures. The Southern and South-Western Flatlands (West) cluster, which covers southern West Australia including Perth, recorded its highest ever extreme high temperature value. This follows a warm winter where the fourth-highest high temperature index value was recorded.
Similarly, the Bureau of Meteorology noted that this was the warmest spring on record for Western Australia[1]. Consistent with the AACI results, mean maximum temperatures were above average almost everywhere except for the most northern areas of the country.
The consecutive dry days index, a measure of drought conditions, was positive for Australia as a whole for the first time since the summer of 2020. All clusters observed a positive index value except for the Wet Tropics, the area which covers northern Queensland.
The higher number of consecutive dry days contributed to a more active bushfire season, which led to fatalities in New South Wales, Queensland and Western Australia[2]. This included the death of a man defending his property from a fire in Kempsey, northern New South Wales, which burnt over 23,000 hectares in an area that had been similarly affected during the Black Summer bushfires of 2019-20[3].
Predictions from the Bureau of Meteorology made at the end of Spring where that these warm, dry conditions will continue into summer[4]. It also predicted temperatures are predicted to be above average across all of Australia, and rainfall is to be below average across Western Australia, the Northern Territory and northern parts of Queensland. However, predictions of this nature focus on seasonal trends and do not preclude extreme events such as Cyclone Jasper, which made landfall in the early summer of 2023 and brought torrential rain to parts of northern Queensland.
A forecast of a warm and dry summer brought predictions of increased bushfire risk from the Australasian Fire Authorities Council[5]. The Council identified large parts of Queensland, New South Wales and the Northern Territory as having increased bushfire risk as well as coastal areas of Western Australia.
These predictions are influenced by the continuing effects of El Niño and a positive Indian Ocean Dipole (IOD). The ENSO weather system is expected to remain in an El Niño phase until well into autumn, while the positive IOD is likely to last until the end of the summer[6]. These typically result in warmer temperatures and lower rainfall across Australia.
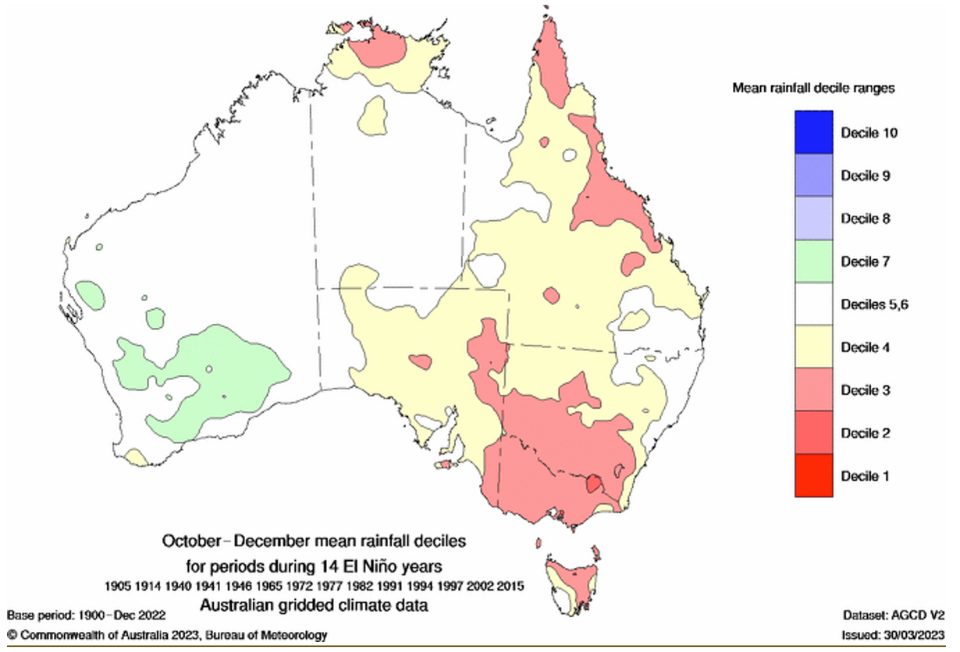
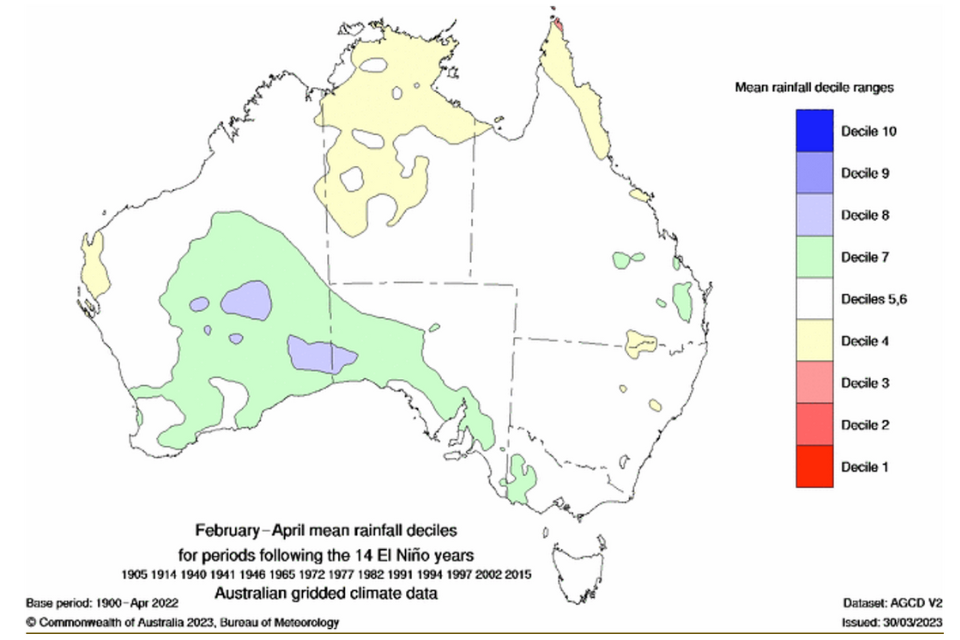
However, the Bureau notes that the drying effect of El Niño is usually more pronounced in spring and early summer, and less evident in late summer and autumn[7]. This is shown in the maps below[8], which show that El Niño years are more likely to lead to low levels of rainfall in October to December than February to April.
Additionally, the Southern Annular Mode (SAM) has been positive for most of December and January[9]. Positive SAM values typically increase rainfall over eastern and south-eastern Australia and decrease the likelihood of extreme heat.
The AACI measures the frequency of extreme weather conditions and sea levels across Australia and how these vary over time.
It covers extreme high and low temperatures, extreme rainfall, consecutive dry days, extreme wind and sea level. The Index was launched in November 2018 by the Actuaries Institute and is updated four times a year by Finity Consulting for the Actuaries Institute.
Unlike many other measures, the climate index focuses on changes in the extremes. This is a more relevant metric for the insurance industry than averages, as it correlates more closely with damage. This is done by measuring how often we observe exceedances of the 99th percentile of the reference period of 1981-2010. More details and full results can be found on the microsite.
The purpose of the climate index is to provide a publicly available measure of extreme weather and demonstrate how the capabilities of the actuarial profession can contribute to the assessment of climate risk.
Alongside the North American Actuaries Climate Index[10], it is one of two climate indices produced globally on behalf of actuarial associations and has been referenced in the media[11] and in government reports[12].
References
[1] http://www.bom.gov.au/climate/current/season/aus/summary.shtml
[2] https://en.wikipedia.org/wiki/2023%E2%80%9324_Australian_bushfire_season
[3] https://www.abc.net.au/news/2023-10-19/nsw-bushfres-kempsey-fire-properties-destroyed/102996120
[4] http://www.bom.gov.au/climate/ahead/outlooks/archive/20231130-outlook.shtml
[5] https://www.afac.com.au/auxiliary/publications/seasonal-outlook/seasonal-outlook-article/seasonal-bushfire-outlook-summer-2023
[6] http://www.bom.gov.au/climate/enso/#tabs=Pacific-Ocean
[7] http://www.bom.gov.au/climate/enso/
[8] http://www.bom.gov.au/climate/updates/articles/a008-el-nino-and-australia.shtml
[9] http://www.bom.gov.au/climate/enso/#tabs=Southern-Ocean
[10] https://actuariesclimateindex.org/home/
[11] https://www.insurancenews.com.au/daily/destructive-bushfire-conditions-ripening-actuaries-institute
[12] https://naturaldisaster.royalcommission.gov.au/publications/exhibit-1-006003-shp5010010001-australian-actuaries-climate-index-some-comments-extremes
CPD: Actuaries Institute Members can claim two CPD points for every hour of reading articles on Actuaries Digital.


