The bad flu season that never was
Contrary to popular myth, Australia has not experienced a bad flu season in 2022.
In fact, indications suggest that flu deaths will be below the average of the pre-pandemic years 2015-19 and similar to what would be expected in an ordinary year. While the flu season started early in 2022, it also finished early, and it seems likely that the spread and persistence of flu has been limited by vaccination and the continuation of some defence measures, whether voluntary or quasi-mandatory.
Glossary of data sources
The main sources for this note are:
- Australian Bureau of Statistics (ABS) Causes of Death, Australia and Provisional Mortality Statistics;
- Department of Health and Aged Care (DHAC) Australian Influenza Surveillance Reports (AISRs); and
- National Centre for Immunisation Research and Surveillance (NCIRS) influenza vaccination coverage data.
Historical data
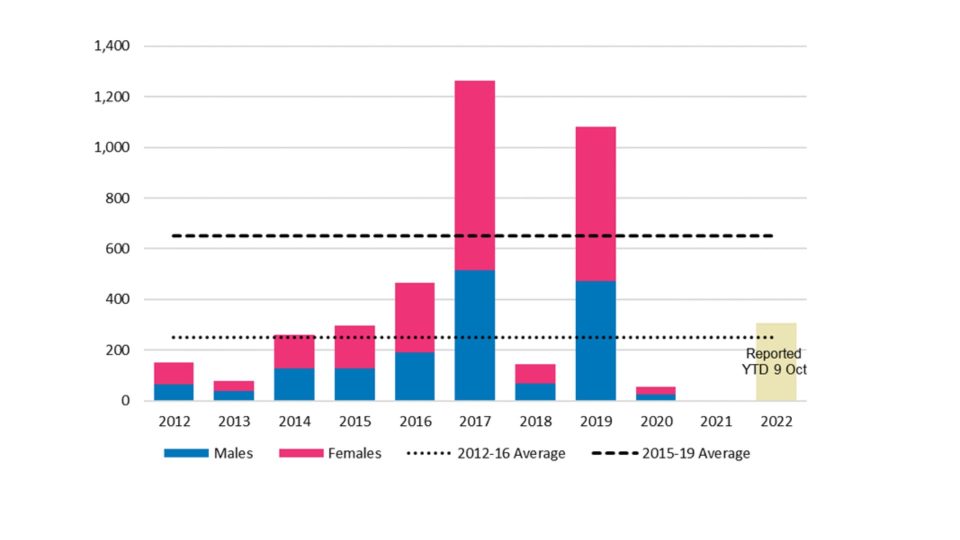
In the past ten years, we have had two “bad” flu seasons: 2017 and 2019. More recently, our international borders were closed in March 2020 and there was a mandatory two-week quarantine for any inbound travellers until the end of 2021. Along with lockdowns and social distancing, this meant that flu was almost non-existent in Australia from about April 2020 until early 2022. We can see this in Figure 1.
In 2020, there were 55 flu deaths, almost all of which were before the start of the pandemic. In 2021, there were only 2 flu deaths. Based on DHAC surveillance reports, there had been 308 flu deaths by 9 October 2022. We note that the DHAC totals that we have for prior years (2017, 2019, 2020 and 2021) are broadly similar to those published by the ABS.
Figure 1 also illustrates the difficulty in identifying a “normal” or baseline level of flu deaths. Based on the past ten years, and ignoring 2020 and 2021 as pandemic-affected, we could adopt a baseline anywhere between 250 and 650. Ignoring 2017 and 2019 as abnormally high, and broadly allowing for demographic change (increases in both population and average age), we suggest that an appropriate baseline for 2022 would be in the range 300 to 350 flu deaths. This represents an expected value for an “ordinary” year. We will use this concept of an ordinary year in the remainder of this note.
(Figure 1 – Ten years of annual flu deaths (source: ABS 3303.0 Causes of Death, Australia, 2021), also showing the YTD total for 2022 at 9 October, from DHAC surveillance reporting)
2022 flu season
Surveillance reporting
Even with the adoption of monthly reporting, ABS mortality data is not very timely. The Provisional Mortality Statistics are issued almost three months after the last death in the data.
As with COVID-19, therefore, we are dependent on surveillance reports to provide more contemporaneous data.
DHAC produces a fortnightly Australian Influenza Surveillance Report (AISR) during the flu season, typically between May and October. There have been 14 reports so far in 2022, covering the 28 weeks from 28 March to 9 October.
The latest of these says that the impact for the season to date, as measured through the rate of FluTracking respondents absent from normal duties and the number of sentinel hospital patients with influenza, is low to moderate.
Among other things, the AISRs show:
- notifications of laboratory-confirmed influenza;
- results from FluTracking[1] surveys;
- influenza hospitalisations at 17 major hospitals around the country, forming the FluCAN sentinel network; and
- influenza-associated deaths among those with laboratory-confirmed influenza.
In order to use this information to determine the severity of a flu season, we need to understand the information provided by each of the measures.
Laboratory tests will detect flu (if present) regardless of symptoms. So, notifications are highly influenced by the level of testing as well as the prevalence of flu.
FluTracking reports the proportion of fever and cough among survey participants. While this is likely to be comparable with previous seasons, it does not track flu specifically. It will also include COVID-19 and other respiratory diseases.
Medical professionals are more likely to seek laboratory confirmation of a diagnosis for patients who have severe enough illness to be hospitalised or die (and also to rule out COVID-19), so the reported levels of these serious outcomes are likely to be comparable with previous seasons.
Notifications
(Figure 2 – Notifications of laboratory-confirmed influenza, Australia, 01 January 2017 to 09 October 2022, by month and week of diagnosis[2])
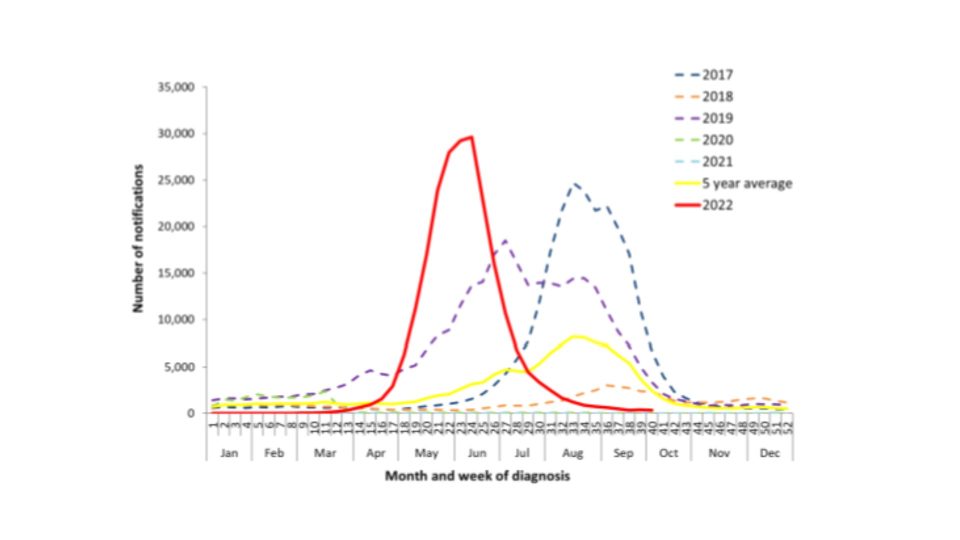
Figure 2 shows the notification pattern in 2022 compared with previous flu seasons. On the face of it, Australia experienced a high, earlier-than-normal spike in flu cases in 2022. News of this spike spread internationally in June and July, giving rise to reports that flu was “back with a vengeance” and that this was a bad omen for the northern hemisphere[3].
FluTracking
(Figure 3 – Proportion of fever and cough among FluTracking participants, Australia, 2017 to 2022, by month and week[4])
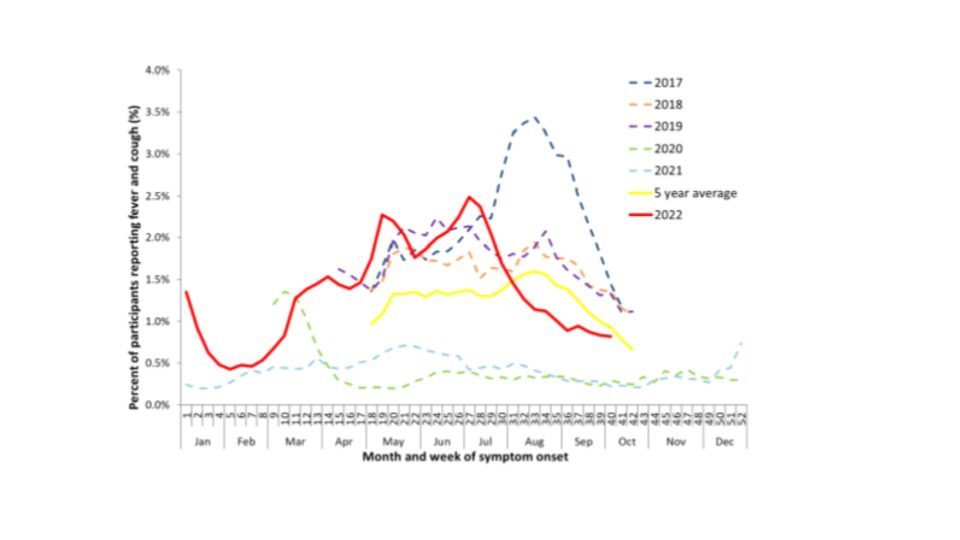
FluTracking data (Figure 3) could be taken as broad support for this view, since symptom reports broadly tracked the levels of 2017 and 2019.
However, this ignores the high prevalence of COVID-19, which gives rise to similar symptoms. This indicates that there may have been a lower prevalence of flu in the community than in 2017 and 2019.
We suggest that many people were tested for flu in 2022 who would not have been tested in pre-pandemic years, because their symptoms were relatively mild. Indeed, we understand that samples tested for COVID-19 have often also been routinely tested for influenza. This would result in a higher apparent case load.
Hospitalisations
(Figure 4 – Number of influenza hospitalisations at sentinel hospitals, from April to October, 2017 to 2022 by month and week of diagnosis[5])
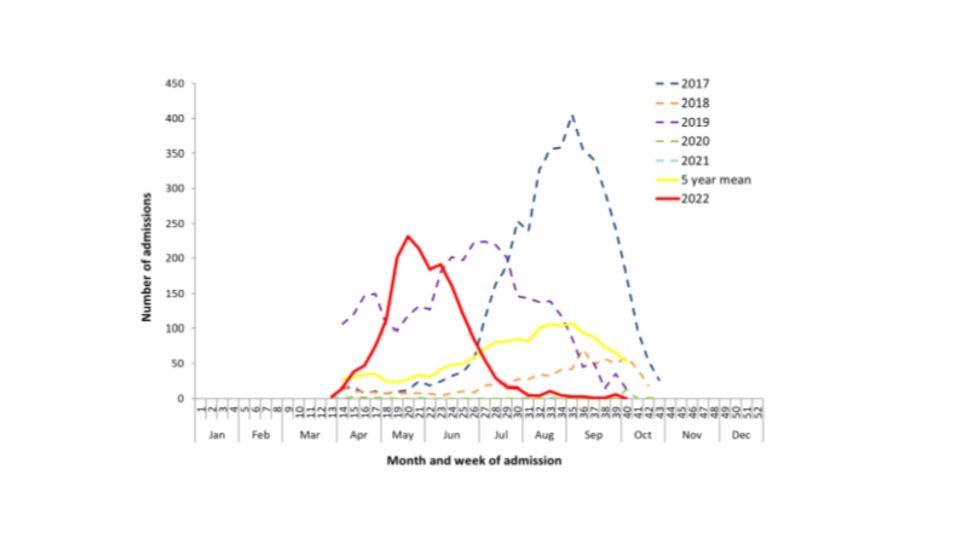
Figure 4 shows a wave of hospitalisations in 2022 that broadly matches the notifications for timing, but its peak is well short of the 2017 record. The 2022 peak is similar to 2019, but the duration is shorter, resulting in total hospitalisations in 2022 (1,832) being less than half of 2019 (3,915).
The hospital systems in Australia were under some strain during 2022, with simultaneous COVID-19 waves while the flu season was occurring. They have also developed stronger processes for triaging less severe respiratory patients for recovery at home (known as Hospital in the Home). So, it is possible that the cases hospitalised in 2022 were more severe on average than those in earlier years.
However, anecdotally the 2019 and particularly 2017 flu seasons also strained the Australian hospital systems, so there could also be some level of differential severity in those seasons.
Overall, the picture of hospital admissions in 2022 appears to confirm our view that the higher flu case load in 2022 is an artefact of higher testing rather than representing a worse flu year[6].
Mortality
Without wishing to downplay the strain on the health system represented by higher hospitalisations and even, to some extent, by higher numbers of known cases, our actuarial perspective is that mortality is the most objective measure of the severity of a flu season.
(Figure 5 – 2022 fortnightly flu deaths, compared with 2015-19 and the two latest bad flu years[7])
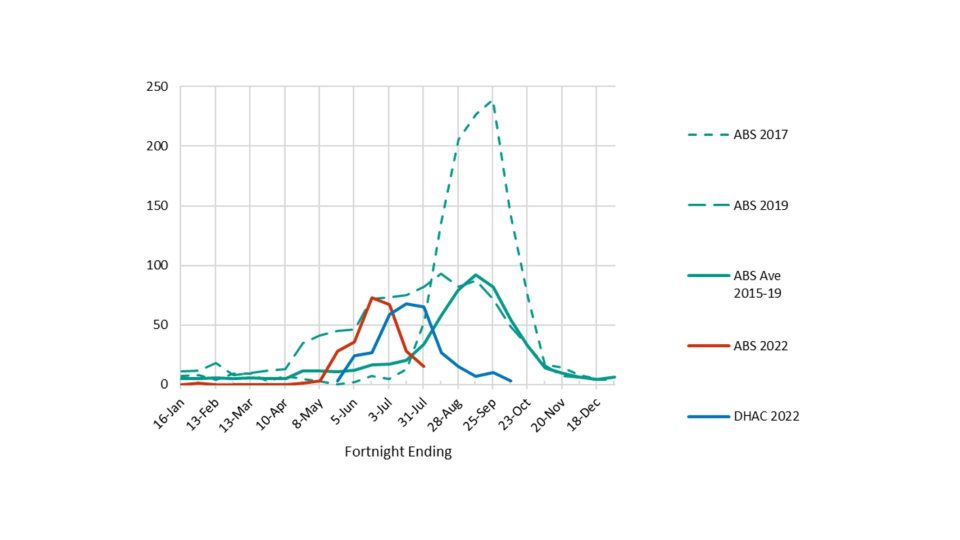
AISRs do not include graphs of flu deaths, but each report contains a year-to-date total, from which we have calculated the implied fortnightly deaths in 2022. Figure 5 compares this DHAC data with doctor-certified deaths reported by the ABS. The early spike in 2022 is clear, but comparison with 2017 and 2019 shows that this has not been a particularly bad flu season.
Note that there is a timing difference between the DHAC and ABS data, with the former representing reporting date while the latter represents date of death. ABS data also does not include the roughly[8] 7% of all flu deaths that are referred to the coroner, nor have we adjusted the 2022 ABS data to allow for the small number that occurred up to 31 July but had not yet been reported. (It is also worth reiterating that the ABS data is released some time after the DHAC data; while in this graph the ABS data is shown earlier than the DHAC data, the data for May was released in August, and data for July was released in October.)
(Figure 6 – Cumulative flu deaths in 2022 compared with 2015-19[9])
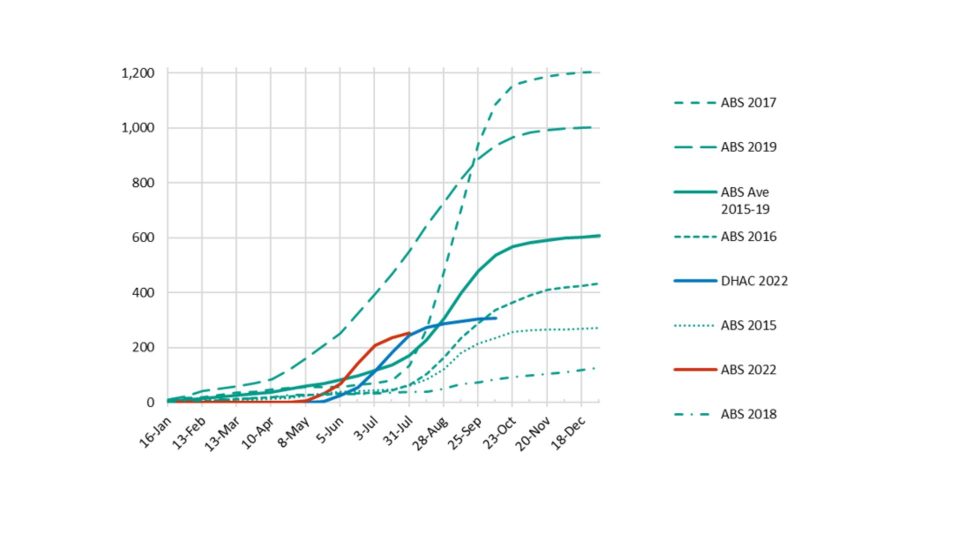
Looking at the cumulative position (Figure 6), we can see that 2022 flu deaths are tracking to be well below the 2015-19 average. Indeed, it seems likely that 2022 will be around the 300-350 expected for an ordinary year.
In our view, the 2022 flu season in Australia has had the severity of an ordinary year in the context of the last 10 years.
Why did the flu season end so early?
The earlier figures show that the flu season usually peaks in late winter or early spring. In 2022, the peak was in June or July, and the season was essentially over by the end of winter.
The early start was perhaps to be expected, given the reopening of borders after almost two years. But the early finish is surprising, because fortnightly flu deaths exceeded 20 from the end of July until the end of October in all but one of the years from 2012 to 2019. The exception – 2018 – was a very low season, with a fortnightly peak of just 15.
Indeed, despite academic evidence to the contrary[10], the almost complete lack of flu in circulation while borders were closed would have been widely expected to have led to a major – and long-lasting – outbreak when flu reappeared.
We have considered two possible causes for the quick end to the flu season:
- vaccinations; and
- behaviour changes due to population experience of COVID-19.
Vaccination statistics from earlier seasons are hard to find, but behavioural changes (such as mask wearing, staying home while sick etc, particularly for those interacting with vulnerable groups) are in any case likely to have been more significant.
Vaccinations
(Figure 7 – Cumulative flu vaccination rates in Australia by age group – 2022 (source: NCIRS))
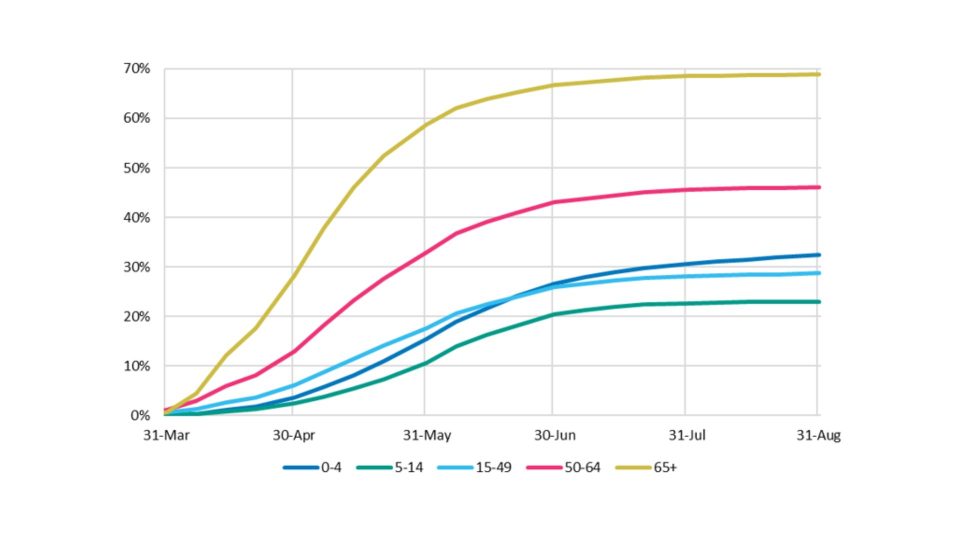
One possible reason for the surprisingly short season is vaccination. Figure 7 shows the growth in population vaccination rates by age group in 2022, using data from The National Centre for Immunisation Research and Surveillance (NCIRS). Influenza mortality is highest among the oldest in our community, so is the strong growth in vaccination rates in the two oldest age groups significant?
Unfortunately, we have been unable to find comparable data from before the pandemic. The available NCIRS data only goes back to 2020.
(Figure 8 – Cumulative flu vaccination rates in Australia in 2020-22 for those aged 65+ (source: NCIRS))
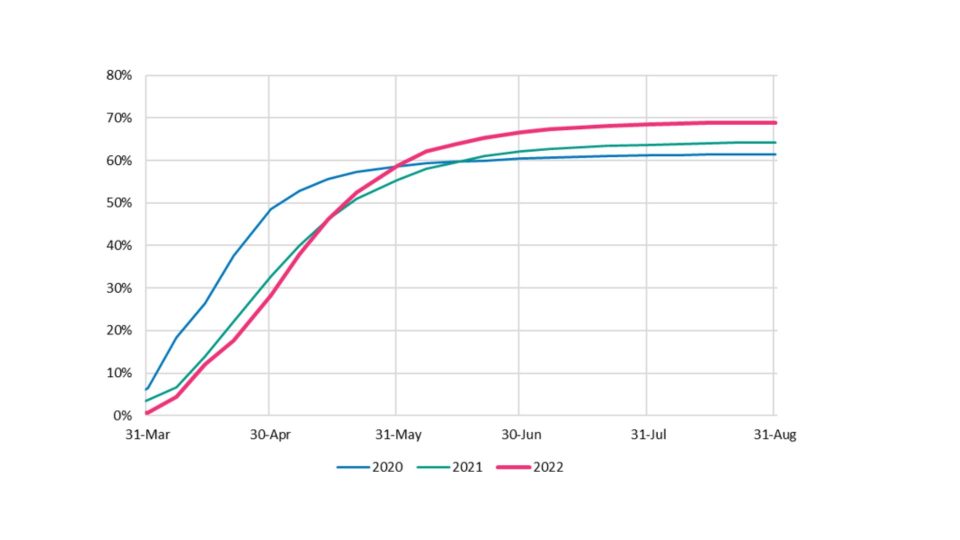
Figure 8 shows that vaccination rates are a little higher in 2022 for those aged 65+ than in the previous two years, but the growth patterns are quite similar.
(Figure 9 – Flu vaccination rates in Australia by age group and year (source: NCIRS))

Figure 9 confirms that vaccination rates are higher in 2022 than in 2021 in all age groups and generally higher than 2020. However, it is not obvious that either the pattern or the ultimate level of vaccination can explain the early end to the flu season.
Nevertheless, if vaccination rates are higher than pre-pandemic levels, this will have contributed to the lower level of mortality. For example, 11 million people were vaccinated in 2022[11], the same number as in 2018[12], when flu deaths were very low. However, there were probably even more vaccinations in 2019[13], when flu deaths were high. We think that the ramped-up vaccination program in 2019 may have reduced the peak, but the season started early and lasted for a long time (see Figure 5). While some believe that this was due to a mismatch between the circulating flu strain and that contained in the vaccination, the World Health Organisation (WHO) considered the vaccines to have been very successful in 2019. In February 2020, Australia’s ABC News reported[14] the WHO’s conclusion that the length of the season could be blamed on the earliness of the outbreak.
A 2016 meta study[15] concluded that vaccination rates in the 65+ age group were generally around 75% from 1999 to 2013. That suggests that current vaccination rates are not particularly high, at least in this most vulnerable group.
As the 2022 outbreak was earlier than any recent season other than 2019, it seems reasonable to suppose that vaccination would have had limited capacity to prevent a long flu season with many deaths. However, we think it likely that the ramping up of vaccination during April and May would have reduced the peak that would otherwise have been reached.
Defence measures
Another possible explanation for the short flu season is the continuation of defence measures among the most vulnerable. For example, there is an industry code for visiting in aged care homes[16] that says, among other things, that visitors should not visit when unwell or displaying any signs of a cold/flu, respiratory or COVID-19 symptoms; and the Code signatories support requiring all visitors (with defined exceptions) be vaccinated against influenza and COVID-19.
In addition, mask wearing was still mandatory throughout the flu season in aged care homes and hospitals in Australia[17].
Voluntary defence measures are also in evidence, at least to some extent, with some mask wearing on public transport and at public gatherings such as concerts. In addition, with working from home now a feasible option for many, people with minor symptoms are actively encouraged to work from home (if well enough) and we understand that some major companies have policies requiring staff to work from home when sick.
(Figure 10 – Google mobility data for Australia, comparing activity with a pre-pandemic baseline)
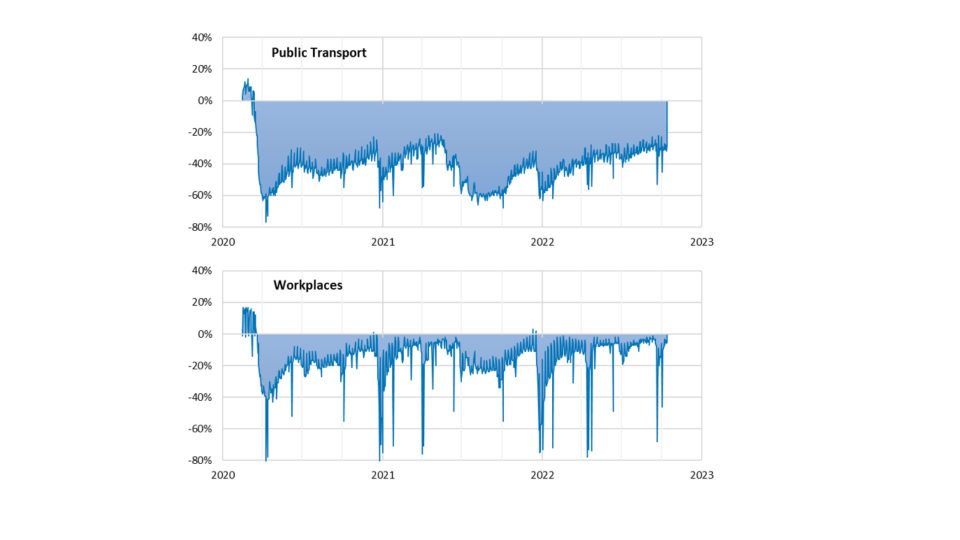
In addition, many people seem to be actively avoiding crowds and busy indoor environments. For example, Google mobility data (Figure 10) shows that, while Australians are largely back at their workplaces, use of public transport remains well below pre-pandemic levels.
It seems plausible to us that defence measures have had a significant impact on the spread and persistence of flu[18] in 2022, with a smaller contribution from the level of vaccination.
Disclaimer
We are not public health specialists or epidemiologists. This note is based on publicly available information and our general observations on that data. We could not find much of the data that we would have liked to have seen (e.g. a ten-year history of vaccination rates by gender and age group). More complete data may have materially affected our conclusions, but we do not expect so.
References
[1] FluTracking is an online syndromic surveillance system which monitors influenza-like illness in the community
[2] This is Figure 4 in the DHAC report, which notes that all data is subject to change as updates are received, especially in relation to the most recent weeks
[3] See, for example, Why Australia’s record flu surge is a bleak omen for the NHS (telegraph.co.uk)
[4] Figure 2 in the DHAC report
[5] Figure 7 in the DHAC report
[6] Note, however, that we understand anecdotally that the hospitalisation of children has been higher than usual in 2022. This may relate to RSV as well as flu.
[7] DHAC data is from DHAC reports; ABS data is from Provisional Mortality Statistics, with cumulative totals shown fortnightly
[8] In 2015-19, this proportion varied from 4.6% (2017) to 12.3% (2018), averaging 6.5%
[9] DHAC data is from DHAC reports; ABS data is from Provisional Mortality Statistics, with cumulative totals shown fortnightly
[10] See Impacts of the COVID-19 pandemic on future seasonal influenza epidemics | medRxiv
[11] See Influenza (flu) immunisation data – 1 March to 9 October | Australian Government Department of Health and Aged Care
[12] See Record vaccinations slash flu rates in Australia – Greg Hunt
[13] See Record numbers of Australians getting vaccinated against the flu – Greg Hunt
[14] Flu season which struck down 310,000 Australians ‘worst on record’ due to early outbreaks – ABC News
[15] See https://bmcinfectdis.biomedcentral.com/counter/pdf/10.1186/s12879-016-1820-8.pdf
[16] See Industry Code for Visiting in Aged Care Homes – COTA Australia
[17] Rules have recently been relaxed in some places, including Queensland and Tasmania
[18] We think it likely that the defence measures being practised are more effective against the spread of flu than COVID-19
CPD: Actuaries Institute Members can claim two CPD points for every hour of reading articles on Actuaries Digital.