


Assessing sustainable aged care financing in Australia
Off the back of the Royal Commission into Aged Care Quality and Safety, which found that “funding for aged care is insufficient, insecure and subject to the fiscal priorities of the Australian Government of the day”, Ellora Shirodkar and Michael Sherris presented their research into aged care financing at the 2022 All-Actuaries Summit.
Aged care funding
The Australian Government controls the supply of government-funded aged care through the aged care target provision ratio and the budget. The Productivity Commission Inquiry Report titled Caring for Older Australians (2011), the Legislated Review of Aged Care (2017) and the Royal Commission (2021) highlight how the ratio is inadequate in measuring demand limiting access to care, fostering aged care outcomes of neglect and sub-standard care.
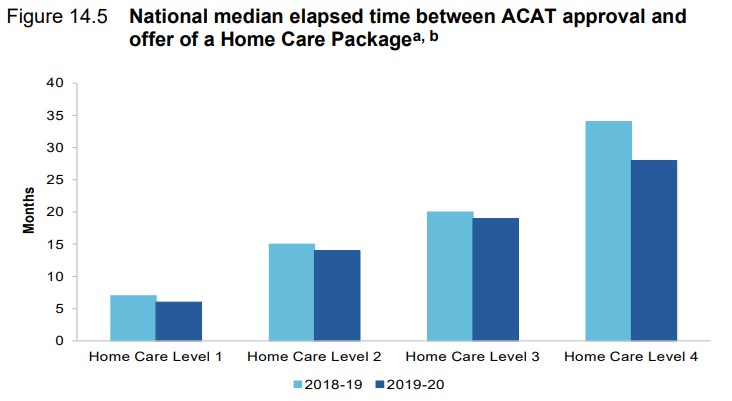
In 2021, 80,000 older Australians were waiting for their assessed level of Home Care Package (HCP) and waiting times often exceeded one year (Figure 1). After the Royal Commission, the Government allocated $6.5 billion to reduce the waiting times. These ad-hoc, short-term reactionary responses by the Government have not addressed the long-term issues with aged care financing.
Figure 1: Median waiting times for a Home Care Package
Quantifying future aged care demand
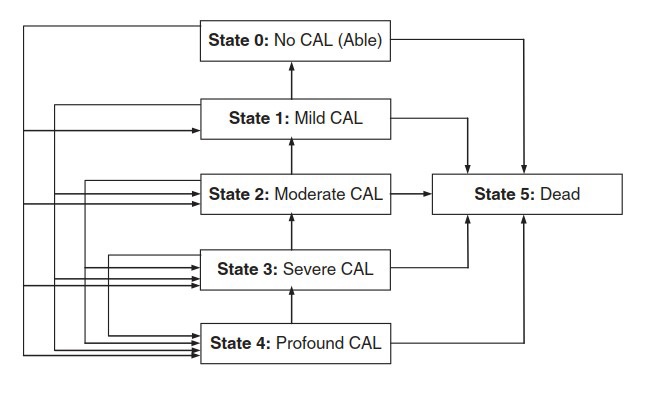
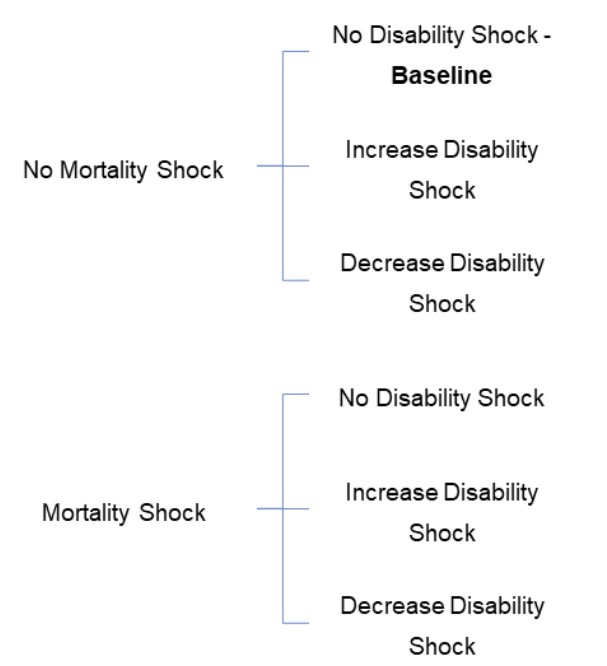
Ensuring aged care financing is sufficient to provide quality care requires quantification of aged care demand based on projected disability levels for the population as it ages. For the first time, we provide an assessment of aged care financing based on projected demand, population, and GDP growth as well as forecast costs. We use a discrete-time multi-state model (Figure 2) based on the four core activity limitations in the 2018 Survey of Disability, Ageing and Caring (SDAC); Mild, Moderate, Severe and Profound. We estimate the probabilities of individual becoming disabled or moving to a higher disability level, by age and sex.
Figure 2: Multi-state model used for disability modelling
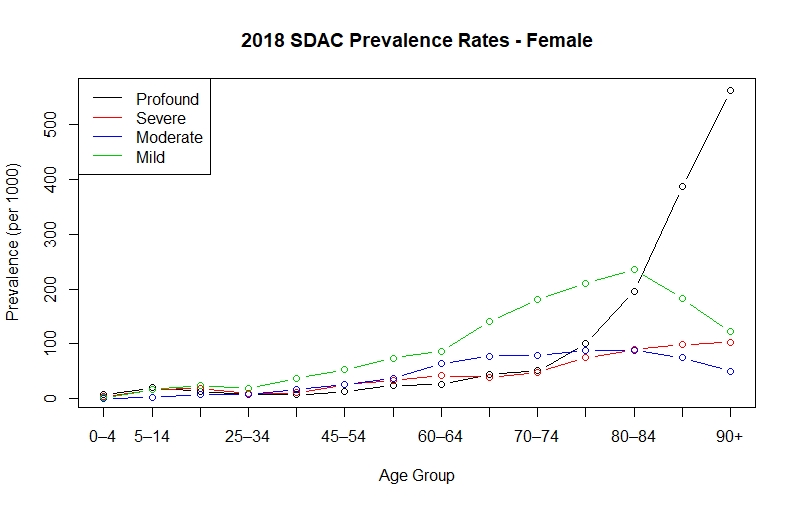
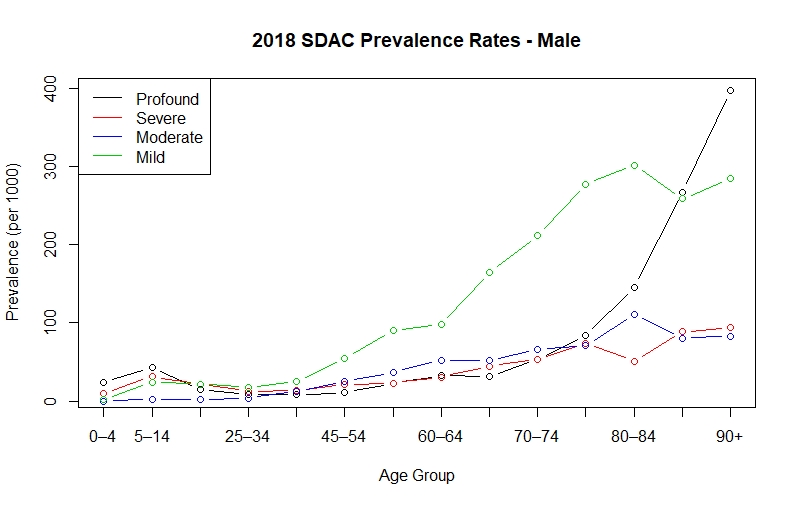
Based on the 2018 SDAC (Figure 3a and 3b), Profound CAL prevalence rates increase exponentially from age 75 and are the dominant CAL by age 80 (for females) and age 90 (for males). They are the biggest contributor to aged care costs.
Figure 3a and 3b: 2018 Survey of Disability, Ageing and Caring prevalence rates
Population projections by disability status
To forecast aged care costs, we project Australia’s population over the next 110 years, using a cohort-component projection method, separated into the four CAL states (Mild, Moderate, Severe and Profound) as well as Able/Healthy. We link the CAL states to aged care programs and costs using the 2018 SDAC data and the HCP Program Quarter Reports (Reports and publications – AIHW Gen (gen-agedcaredata.gov.au)), recognising not all individuals require assistance and those with a Profound CAL require the highest level of care.
Future migration, mortality, and disability patterns, over 110 years, have inherent uncertainty. We use a scenario analysis to assess the sensitivity of aged care demand and costs to demographic factors. Migration and fertility patterns are taken from the Centre for Population 2021 Population Statement Projections with an additional scenario, denoted as ‘Sustained Lower NOM’ which assumes lower net overseas migration of 100,000 p.a.
Since mortality rates have been improving at a declining rate, five-year historical averages of mortality improvement rates are used for ages 0 to 84 and 25-year averages for ages 85 and above, with improvements ceasing after 30 years.
Lack of data hinders use of well-established actuarial models
Australia has no publicly available longitudinal disability data for individuals 65 and above to estimate trends and uncertainty in disability rates. Australians are living longer and may spend more, the same, or less time with a disability. To illustrate the risks, we adopt the shocks that private insurers would have to assess using CEIOPS’ Solvency II longevity, morbidity, and disability stress assumptions, where a ‘mortality shock’ is a decrease in the mortality rate incorporating assumed improvements (Figure 4).
Figure 4: Demographic scenarios
From the population projections there are some developments in disability worth highlighting:
- Females are expected to live longer but are more likely to spend longer with a disability, compared to males.
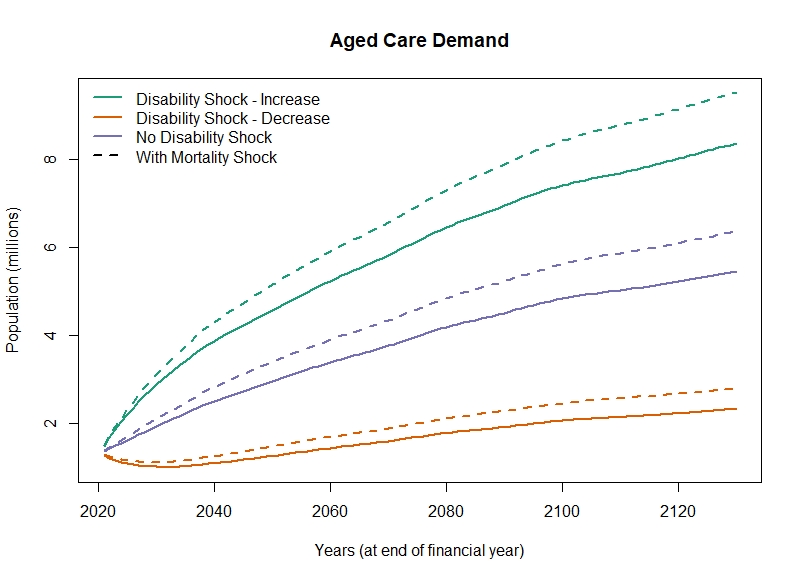
- The steepest increase in aged care demand occurs in the next 40 years but the increase continues over the 110 years reflecting migration (Figure 5).
- Aged care demand is extremely sensitive to future disability patterns, with a range based on the assumed shocks from 5% to 15% of the population by 2060 (Figure 5).
Figure 5: Aged care demand by different demographic scenarios
Future Aged Care costs
We estimate costs using an average real expenditure per person as a sum of government subsidies plus individual co-contributions, split by aged care service (Commonwealth Home Support Programme, Home Care Package Level 1-4, and Residential Care). Costs are indexed with current subsidies and care-related supplements. Current aged care costs are not indexed to wage movements. We forecast inflation and GDP using a Vector Auto-Regressive (VAR) model calibrated to data from 2003 to 2018.
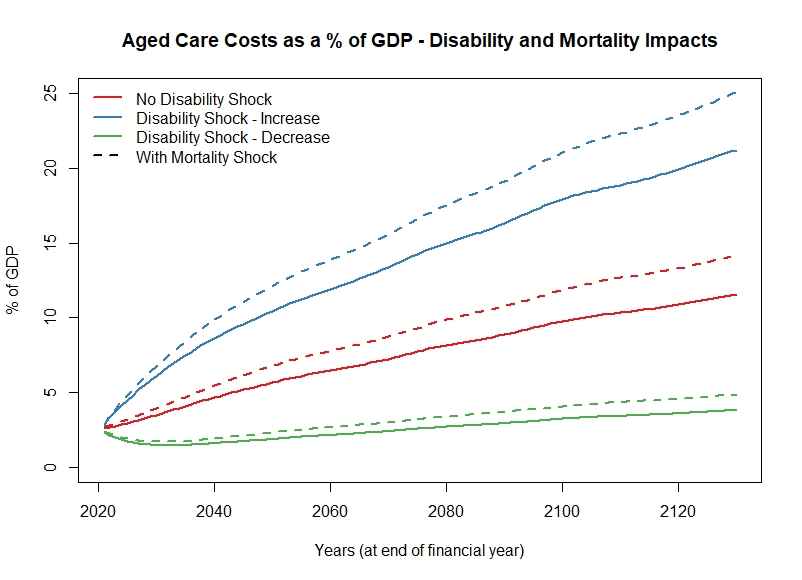
Assuming aged care is based on demand, costs grow to 6.5% of GDP by 2060 under current disability and mortality rates (Figure 6), compared to the 2.1% the Intergenerational Report estimates. These costs are most sensitive to the disability shock assumptions, with the range of costs varying from 4% to 25% of GDP by 2120.
Figure 6: Aged care costs by different demographic scenarios
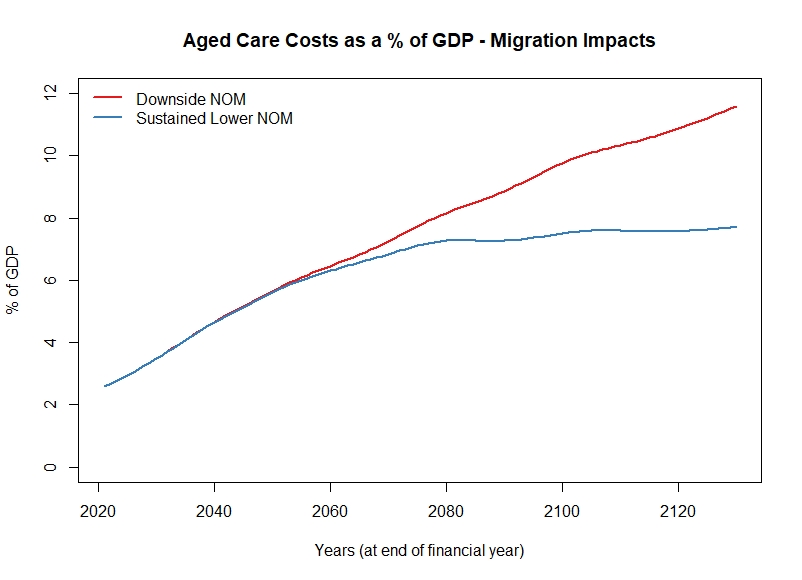
Future migration patterns play a significant role in aged care costs. Under recent net migration levels, the population growth rate exceeds the GDP growth resulting in a rise in costs. Assuming a ‘Sustained Lower NOM’ scenario, the population growth rate falls below the GDP growth rate and costs stabilise after 2060 (Figure 7).
Figure 7: Aged care costs by different migration scenarios
Sustainable financing of Aged Care costs
Australia expends 1.5% of GDP on aged care spending, less than the OECD average for aged care. Countries with internationally recognised high-quality aged care systems spend 2.5%-4% of their GDP on long-term care. If Australia’s aged care system is to “provide a system of care based on a universal right to high quality safe and time support to care” as proposed by the Aged Care Royal Commission, then the Australian government must develop an aged care financing system that will fund the cost of providing this care.
Under current financing arrangements, the burden on government expenditure will become unsustainable given the post-COVID-19 fiscal pressures. An aged care levy and means-tested co-payments, in addition to government budget aged care financing, can support the expected trends in the aged care costs of the disabled Australian population.
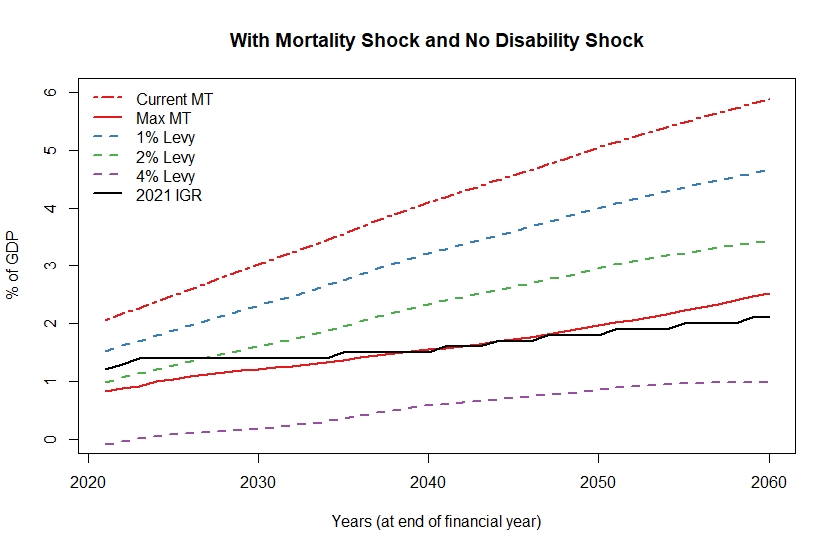
An aged care levy would bring additional resources to improve aged care, leaving the government’s budget contributions to absorb the demographic risks of changing mortality and disability patterns. A combination of an aged care levy and means-testing balances up intergenerational equities and ensures costs to the government will be more in line with the 2021 IGR estimates (Figure 8).
Figure 8: Government aged care costs as a % of GDP under different financing arrangements
Many older Australians will be better positioned, and willing, to contribute to the cost of their aged care as the superannuation system matures, coupled with high homeownership rates. Current aged care means-testing rules are complex, inconsistent with the age pension, and vertically inequitable. Lacking income and asset data for individuals 65 and over, we used age pensioner status to estimate the impact of means-testing. Means-tested co-payments also share the risk of changing mortality and disability demographics, but current indexation arrangements reduce the purchasing power of these co-payments because of the different indexation of the age pension and aged care costs.
Can we maintain intergenerational equity?
Means-tested co-payments, along with an aged care levy, will help maintain intergenerational equity, with older cohorts bearing a higher percentage of their aged care costs. In any move to a sustainable aged care financing system, there will need to be a transition from the current system. The amount and structure of an aged care levy during different cohorts’ working lives and the gradual transition to universal entitlement will benefit from an actuarial assessment.
What happens next?
Our analysis of the future sustainability of aged care has focussed on demand-based aged care and the sensitivity of costs to future disability trends. Although the government did not accept the Royal Commission’s recommendation of a Productivity Commission Report on an actuarially assessed aged care levy, our research has been a first step in understanding the financing of a more sustainable aged care system in Australia.
| Read further coverage from the 2022 All-Actuaries Summit. |
CPD: Actuaries Institute Members can claim two CPD points for every hour of reading articles on Actuaries Digital.


