


COVID-19: Excess mortality in 2021 estimated to be around 1%, and likely to be higher in early 2022
Analysis from the Actuaries Institute’s COVID-19 Mortality Working Group has determined that COVID-19 deaths for the first two months of 2022 are more than double the total number of COVID-19 deaths for 2021. Furthermore, COVID-19 deaths from the Delta wave in 2021 and the Omicron wave in early 2022 have almost fully eroded the reduction in deaths experienced earlier in the pandemic.
In summary:
|
![]()
Background
The COVID-19 Mortality Working Group has examined the latest provisional mortality statistics to 30 November 2021, released by the Australian Bureau of Statistics (ABS) on 25 February 2022. We have compared our predicted baseline number of deaths to the observed deaths, noting the analysis is based on monthly ABS data for doctor-certified deaths (excluding roughly 12% of all deaths that are certified by the coroner).
In this article we have also included:
- an estimate of excess mortality for all deaths (not just doctor-certified deaths) for both 2020 and 2021, comparing our excess mortality estimates to those included in Our World in Data (OWID); and
- an indicative estimate of excess mortality for the first two months of 2022.
![]()
Excess doctor-certified deaths to 30 November 2021
In brief, the Working Group’s analysis:
- scales actual weekly deaths from 2015 to 2020 so that they are representative of the number of deaths in those years if they had the 2021 population size and age mix;
- fits a linear regression model to the scaled deaths from 2015 to 2019, giving overall mortality improvements of around 1.8% per annum over the five-year period;
- extrapolates the linear regression model to arrive at a predicted number of deaths for each week in 2020 and 2021 (assuming that the same 1.8% per annum mortality improvement continues and ignoring the impact of the pandemic); and
- compares predicted deaths to the actual deaths in 2021 (after a small allowance for late reported deaths).
It is important to note that expected deaths are increasing faster from demographic changes (ageing and population size) than they are reducing due to mortality improvement. As a result, our model predicts higher deaths each successive year. Our prediction for 2021 is higher than for 2020 and both are higher than the 2015-19 average. Thus, despite the overall mortality improvements, our predicted doctor-certified deaths for 2021 are 7,800 (6%) above the 2015-19 average.
The graph and table below summarise the results of the analysis. This article concentrates on the experience in 2021, but we have also shown the 2020 results (scaled to 2021) for context.
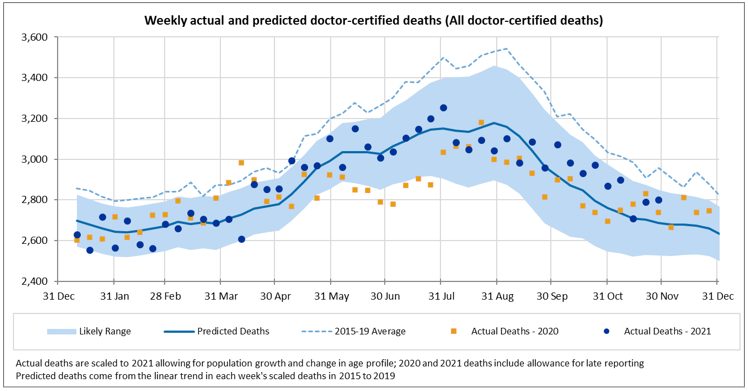
Table 1 – Excess doctor-certified deaths
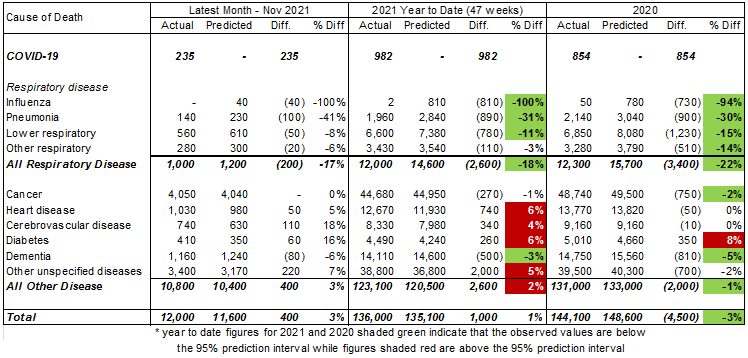
For the month of November 2021, total doctor-certified deaths were 3% higher than predicted but within the 95% prediction interval (i.e. between the 2.5th and 97.5th percentiles). Also:
- there were 235 doctor-certified deaths from COVID-19;
- deaths from respiratory disease continued to be lower than expected (down 200 or 17%). While deaths from respiratory disease continue to be lower than expected, we are now past the winter hump. As such, the absolute number of lower-than-expected deaths is fewer than observed during the winter months of July to October;
- deaths from cerebrovascular disease (strokes, etc) and diabetes were much higher than expected (up 18% and 16% respectively);
- deaths from heart disease and other causes (those not explicitly reported on by the ABS) were also higher than expected (up 5% and 7% respectively);
- deaths from dementia were again lower than expected (down 6%), possibly related to lower-than-usual levels of respiratory disease in the community.
In the year to date (11 months to end November), doctor-certified deaths from all causes were around 1,000 (1%) higher than predicted:
- there have been 982 doctor-certified COVID-19 deaths;
- deaths from respiratory disease have been around 2,600 (18%) less than predicted, which is significantly lower than the 2.5th percentile;
- deaths from dementia have been around 500 (3%) less than predicted, which is also less than the 2.5th percentile;
- there were more deaths than expected from heart disease (up 740 or 6%), cerebrovascular disease (up 340 or 4%), diabetes (up 260 or 6%) and other causes (up 2,000 or 5%), and these deaths were higher than the 97.5th Higher deaths from these causes offset the lower deaths from respiratory disease.
![]()
Total excess deaths in 2020 and 2021
Table 1 above shows estimated excess deaths in respect of doctor-certified deaths are -4,500 or -3% for the full year 2020, and +1,000 or +1% for the eleven months to 30 November 2021.
The following table shows our estimate of excess deaths for 2020 and 2021 in respect of ALL deaths assuming that:
- actual doctor-certified deaths in the month of December 2021 are the same percentage above/below the predicted values (by cause of death) as the eleven months to end November 2021;
- the proportion of doctor-certified deaths from disease (by cause of death) in 2020 and 2021 are the same as for the 2015-19 years, noting that the proportion of doctor-certified diseases has been very stable from year-to-year; and
- predicted deaths from external causes are based on a simple linear projection of the number of such deaths in 2015 to 2019. ‘Actual’ deaths from external causes are estimated from Table 14.1 of the ABS Cause of Death publication, with a similar allowance for late reported deaths from external causes as in previous years (i.e. around a 10% allowance). This results in deaths from external causes being slightly below predicted, which is consistent with preliminary data on the number of deaths from road accidents and suicide).
Table 2 – Total excess deaths
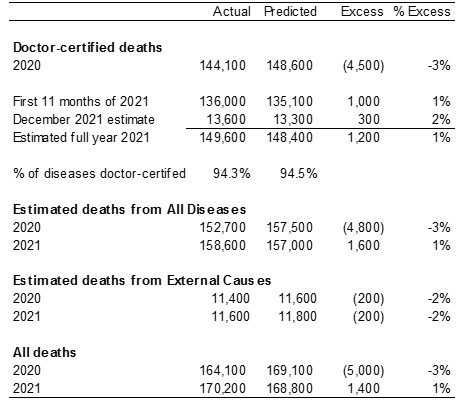 |
We estimate that total excess deaths for 2020 are around -5,000 (-3%), while for 2021 total excess deaths are estimated to be around +1,400 (+1%).
This compares to excess deaths as per OWID of:
- Around -10,100 excess deaths for 2020
- Around -3,000 excess deaths for the 10 months to end October 2020 (our equivalent total excess deaths figure to end-October would be around +600 excess deaths).
There is quite a sizeable difference in the excess deaths measured by us and by OWID. We are currently in discussions with the OWID modellers to resolve this difference, but we are confident that the correct answer is closer to our figures than to theirs.
![]()
Excess deaths in 2022
While the ABS provisional mortality statistics data is only available until the end of November, the officially recorded COVID-19 deaths are available daily. The following graph shows the number of such deaths in each month of 2020, 2021 and 2022.
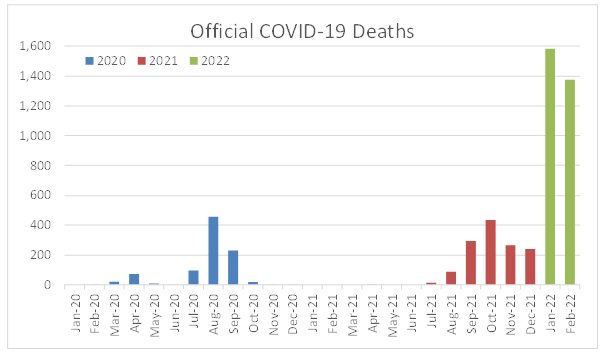 |
There were 909 official COVID-19 deaths in 2020 (including 854 doctor-certified) and a further 1,344 deaths in 2021. So far in 2022, there have been 1,582 COVID-19 deaths in January and a further 1,377 in February 2022.
Our prediction model suggests, without a pandemic and including allowance for coroner referred deaths:
- around 13,500 to 14,000 deaths in January 2022; and
- around 12,200 to 12,600 deaths in February 2022 (lower than January due to only 28 days in the month).
Thus COVID-19 deaths (if there are no offsetting deaths) would increase mortality in these two months by around 11%-12%.
There is a question of how many official COVID-19 deaths are in respect of people who have died with COVID-19 rather than from COVID-19. ABS statistics released on 15 February 2022 (Covid Mortality in Australia) showed that of the COVID-19 deaths registered by end January 2022, only 83 (3%) of 2,639 deaths were with COVID-19. Noting that most of these deaths occurred prior to the Omicron wave, and that there is evidence from the UK that this gap might grow slightly with Omicron, it is not possible to provide a reliable estimate of the ultimate proportion of daily reported deaths that will be registered with COVID-19. However, there is no reason to expect it to be a very high proportion of reported COVID-19 deaths – and these deaths will still represent a shortening of life brought about by COVID-19 infection.
As such, in making a small allowance for a proportion of COVID-19 deaths with COVID-19, we expect that COVID-19 is likely to have increased mortality in Australia by around 10% in each of January and February 2022. There is unlikely to have been a corresponding reduction in deaths from lockdowns, social distancing, border closures or other measures as we have observed very little reduction in overall mortality during the summer months of 2020 and 2021 from these measures.
The current wave of COVID-19 deaths peaked at the end of January and appears to be receding. If this is true, if we do not have another significant wave and if, like 2021, total deaths from other causes are similar to expected, COVID-19 deaths in 2022 may result in total actual deaths around 2% to 3% higher than expected. However, another wave, or the continuation of COVID-19 deaths around current levels, could see Australia recording more than 10% excess mortality in 2022.
![]()
| The remainder of this article shows the actual versus predicted doctor-certified deaths to 30 November for each cause of death. |
COVID-19 deaths
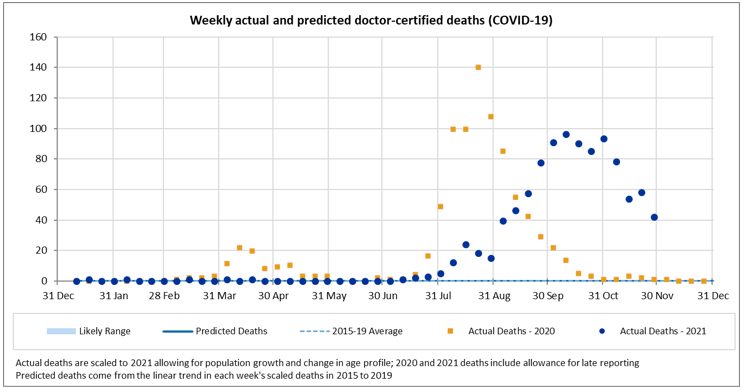
There were 235 doctor-certified deaths in November from COVID-19. This is 33 fewer than the 268 officially recorded COVID-19 deaths. We would not expect the numbers to be identical, because:
- there are delays between time of death and lodgement of the doctor’s certificate (noting we have not made any allowance for late reported COVID-19 deaths);
- the reporting criteria are slightly different; and
- some COVID-19 deaths will be referred to the coroner (e.g. deaths occurring at home).
In the year to 30 November, there have been 982 doctor-certified deaths, compared with 1,102 officially recorded COVID-19 deaths.
![]()
Deaths from respiratory disease
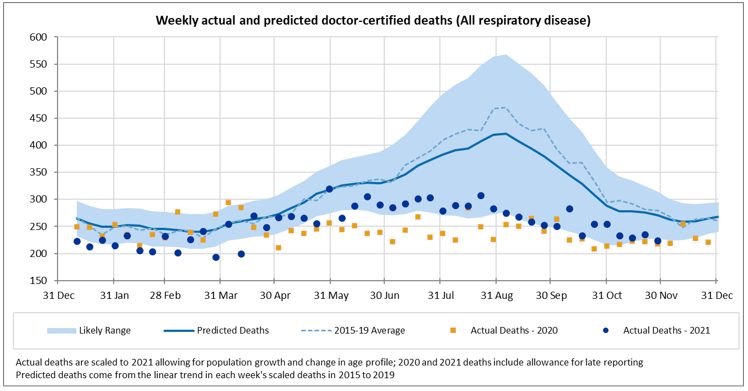
Following the trend observed since the beginning of the COVID-19 pandemic, Australia continued to see significantly lower deaths from all respiratory disease in November 2021. While deaths from respiratory disease continue to be lower than expected, we are now past the winter hump. As such, the absolute number of lower-than-expected deaths is fewer than observed during the winter months of July to October;
Deaths from respiratory disease in 2021, while much lower than trend, have been higher than in 2020 for almost all weeks since mid-April.
The following figures present a breakdown of respiratory disease into influenza, pneumonia, lower respiratory disease, and other respiratory disease.
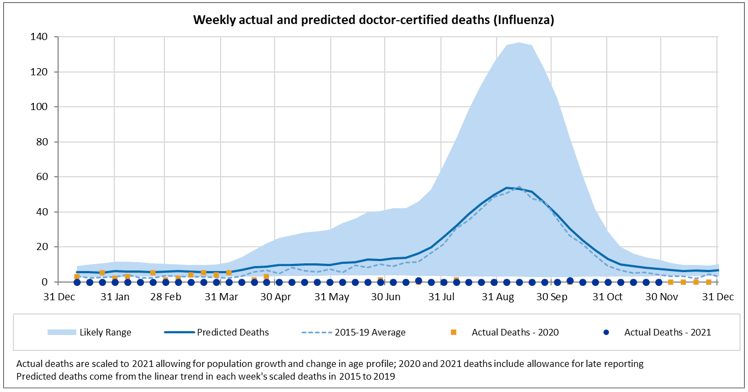
There were no deaths from influenza in November 2021.
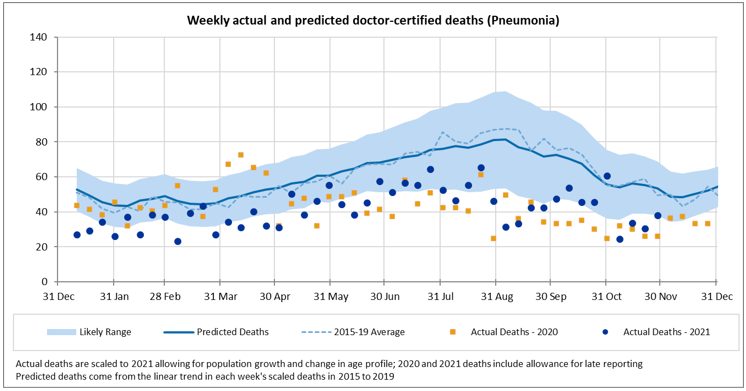
Pneumonia deaths remain low; deaths from this cause are lower than predicted for every week of 2021 other than the last week of October and lower than the lower bound for most weeks.
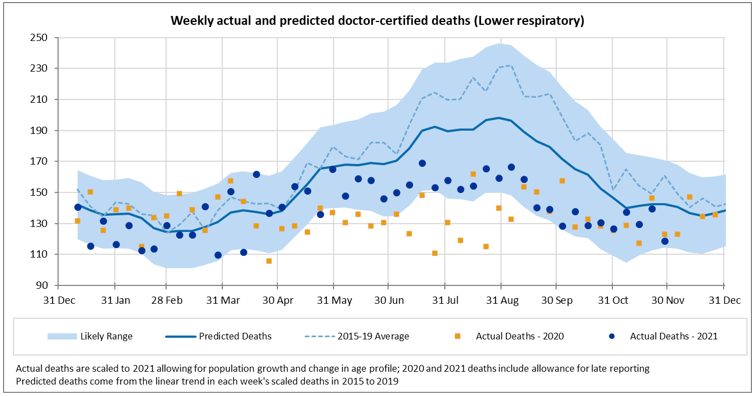
Deaths from lower respiratory disease were close to predicted for most weeks until end May 2021. From June to August, deaths from this cause are lower than predicted, however they are not as low as in 2020. For September and October, deaths from this cause were close to the lower bound of our prediction interval and similar to 2020. For November, deaths from this cause are closer to the expected value, noting we are now past the winter hump.
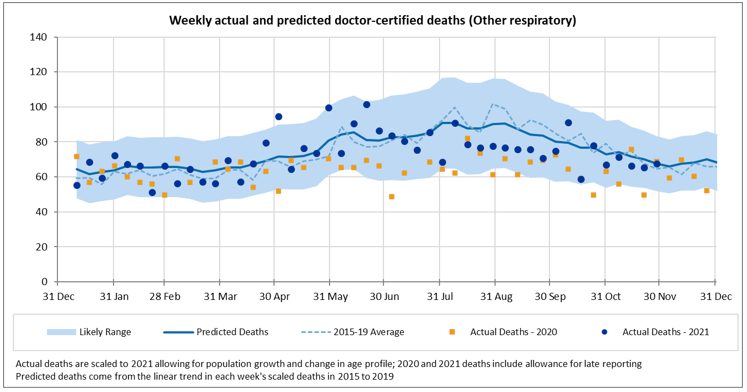
Deaths from other respiratory diseases continue to be close to our predictions.
![]()
Non-COVID-19 and non-respiratory deaths
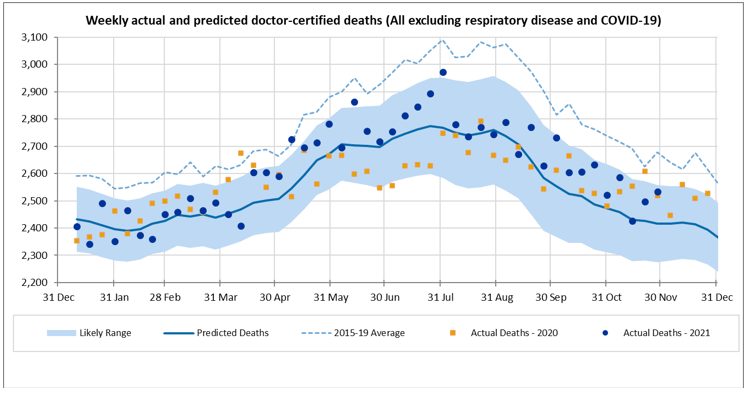
Excluding deaths from COVID-19 and respiratory disease, deaths in November were overall a little higher than expected, but within the prediction interval, similar to the experience of September and October. This followed a period from mid-April until end-July where deaths were higher than predicted and above or close to the 97.5th percentile in quite a number of weeks. This is mainly driven by the experience of “other” deaths, and, to a lesser extent, heart disease.
The following figures show a breakdown of non-respiratory/non-COVID-19 deaths into cancer, heart disease, cerebrovascular disease, diabetes, dementia and all other causes.
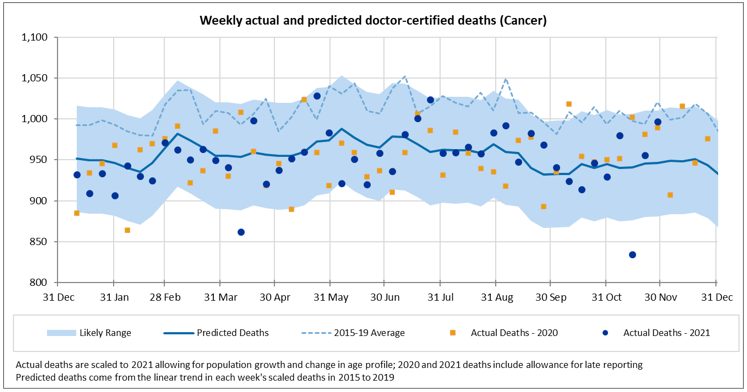
Cancer deaths continue to be close to the predicted values for most weeks; deaths from this cause in the second week of November were unusually low. With diagnostic testing down in 2020, there were concerns that there would be a spike in cancer deaths in 2021 and beyond. While it is still early days, we are not yet seeing any evidence of this effect.
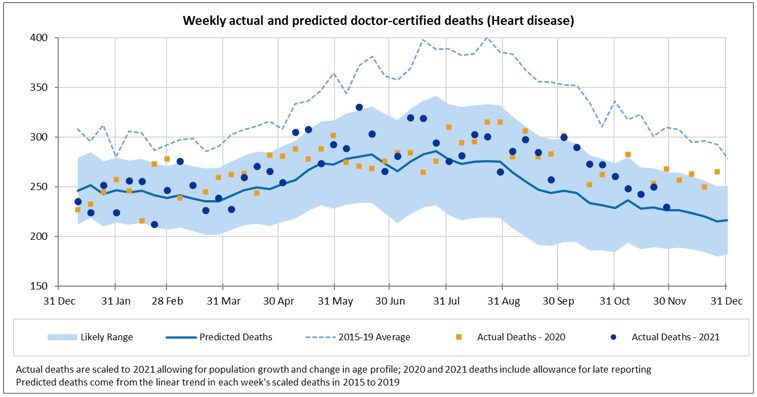
In the 11 months to end-November, there have been higher than expected deaths from heart disease (up 6%). This has been fairly consistent across most weeks with only a small number of weeks above the 97.5th percentile. We note that the predicted values allow for continued strong mortality improvement in 2021 in this cause. Deaths in 2021 are close to 2020.
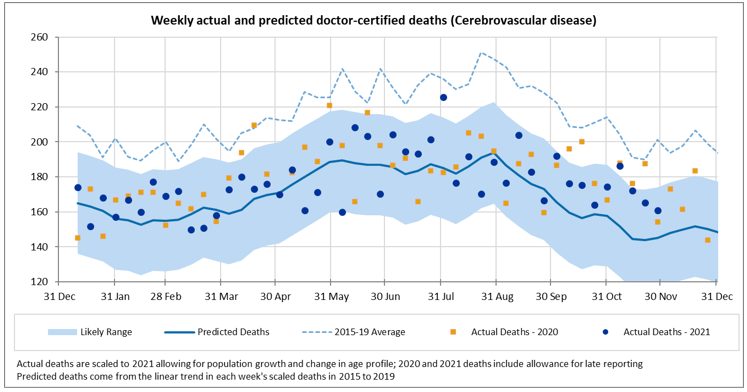
For cerebrovascular disease, actual deaths are 4% higher than predicted in the 11 months to 30 November. Most weeks are higher than predicted, but only a small number are above the 97.5th percentile, including the first week of November. Note that the predicted values incorporate a continuation of strong mortality improvement.
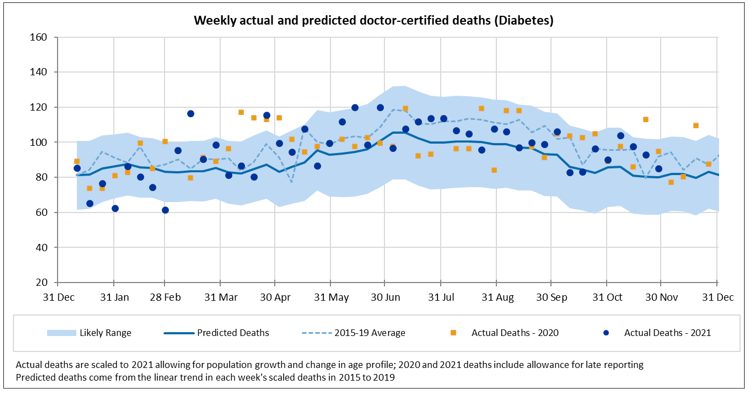
Deaths from diabetes are higher than expected (up 6%) in the 11 months to 30 November. Deaths from this cause make up only a small proportion of all deaths and are somewhat volatile, however most weeks are above the mean prediction.
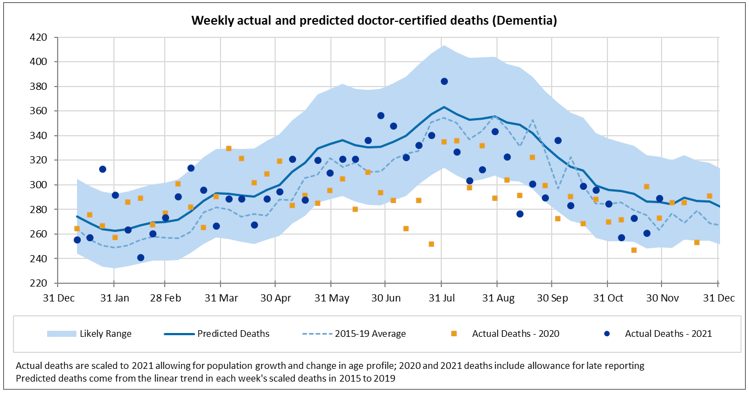
Deaths from dementia continued to be lower than expected in November (down 6%). This is similar to the experience during July-October and is possibly related to lower than usual levels of respiratory disease in the community.
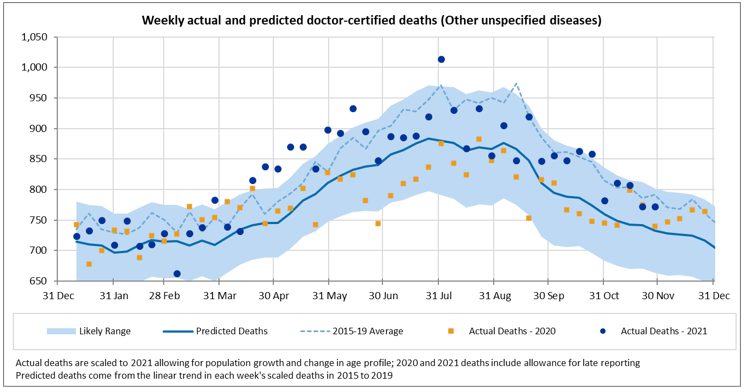
Deaths from other causes, i.e. those not explicitly reported on by the ABS, continued to be higher than expected in November. Deaths from this group of causes were substantially above the upper limit of the prediction interval from around mid-April until end-June. Since then, deaths have mostly been within the prediction interval but higher than the mean.
Members of the COVID-19 Mortality Working Group:
|
CPD: Actuaries Institute Members can claim two CPD points for every hour of reading articles on Actuaries Digital.


