


Faster, Higher, Stronger – the models, medals and medallists of the Olympics
After a tense 16 days of non-stop sports broadcasts, we have finally reached the most exciting part of the Olympics – analysing the results! Join us in crunching the numbers as we ask:
- How well did we predict the medal tallies?
- What’s really the best way to measure the medal tally winner?
- How much faster, stronger and higher have we gotten?
- Who do we think will be at Brisbane 2032?
Find out all this and more in our Olympic results wrap up!
Revisiting predictions for the Tokyo Olympics
On the last episode of Olympics Analytics… our heroes had created a set of predictions for the final Tokyo Olympics medal tallies by creating a model that didn’t use previous medal counts as an input.
So let’s see how we did:
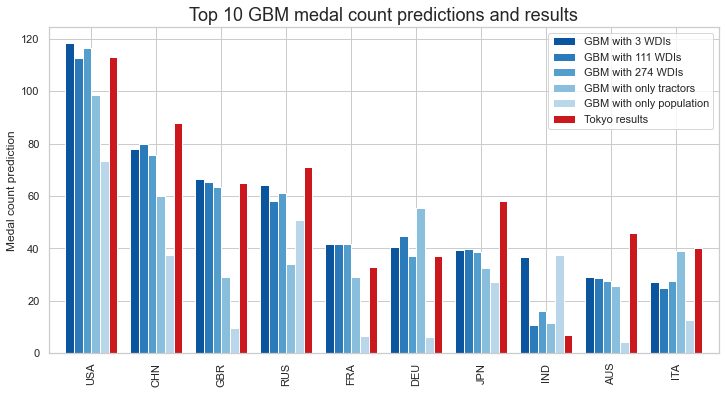
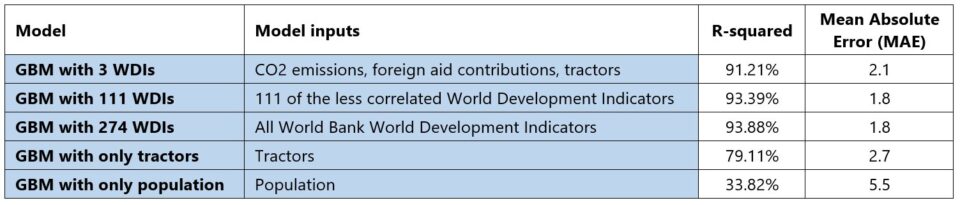
In this assessment, we’ll be using R-squared as our primary basis of comparison. This represents the proportion of the overall variance in the dependent variable that was predicted by our models – in this case we can see that the ‘3 WDI GBM’ model was able to account for over 90% of the variation in the medal tally at Tokyo! That’s a lot of information from just annual CO2 emissions, foreign aid contributions and the number of tractors.
As many have suggested, these three seemingly irrelevant development indicators can function as rough proxies for wealth and population size – both known correlates to Olympic performance. But look at that ‘only tractors’ GBM score! Maybe there is something else to it…
In the Olympic spirit of friendly competition, let’s see how this model stacks up against a real medal forecast. Let’s take a look at Nate Silver’s FiveThirtyEight and the ‘expected medals’ section of their interactive medal tally. FiveThirtyEight is a news/data website that uses statistical analysis to make predictions and write articles on economics, politics and sports. They’re best known for their predictions of US presidential elections – their name coming from the number of electors in the US Electoral College.
For Tokyo, their forecast methodology used detailed medal count data overlaid with some additional Olympic knowledge and updated as events completed. They didn’t make their initial medal projections easily available, but by spamming a ‘read more’ button and using a few simple web scraping tools, we were able to put them to the test.
Let’s see how our models compare against theirs as well as some of the more basic guesses.
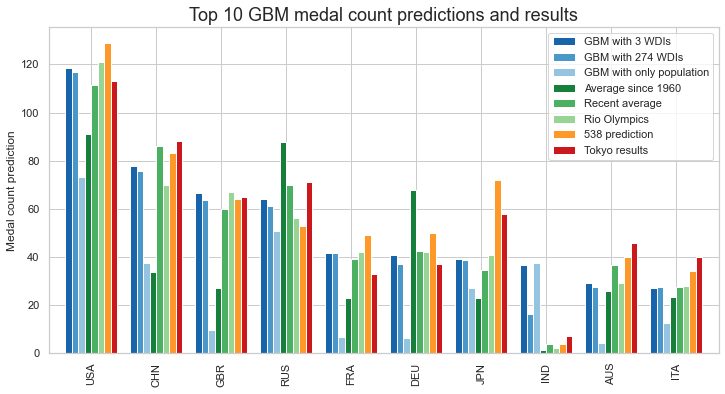
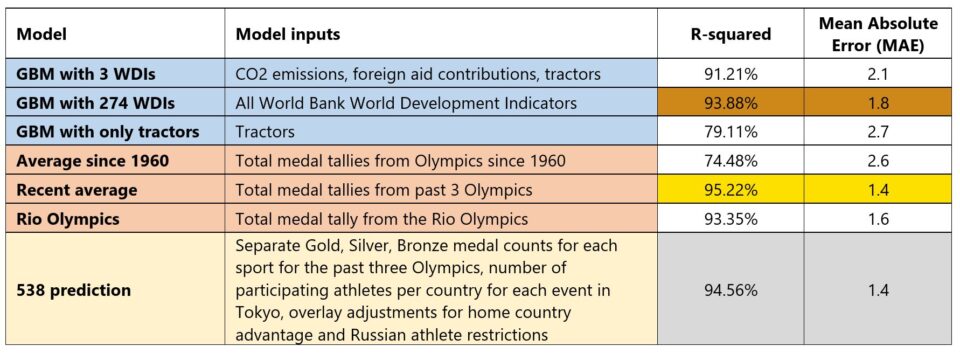
You got us this time, Nate Silver… but it looks like we both got beat by the power of simple averaging!
All about the medals?
There’s been some debate over the years about how to show the medal tally. We’ve been summing all medals equally to reduce variance for our models. But some people like to rank by only gold medals. Some apply a medal specific points system like 3:2:1 (three points for gold, two points for silver, one point for bronze) or alternate ratios like 4:2:1.
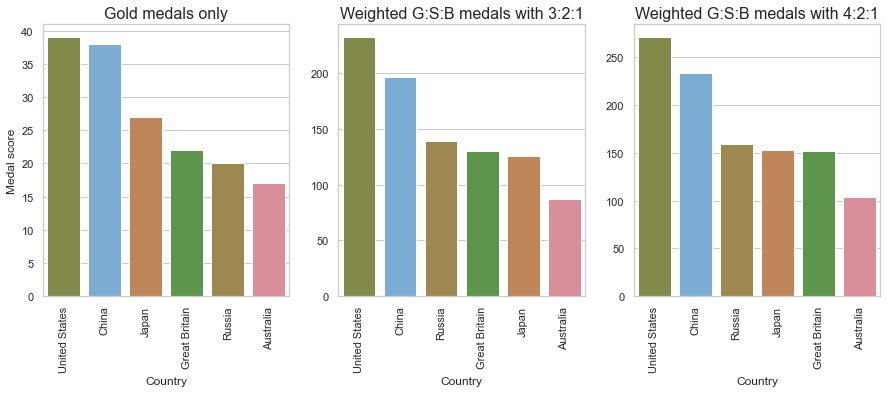
Others still suggest dividing by population to get ‘per capita’ scores. Or using GDP. Or why not some combination of all of the above?
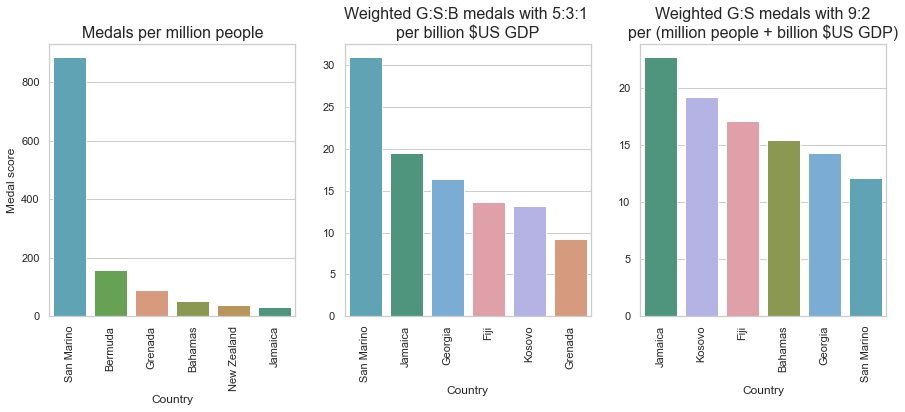
At first you might think that some of the score aggregation decisions are a little arbitrary. But after greater thought and consideration you’ll realise that they are extremely arbitrary. So we say, why not go all in? In fact, let’s create a medal scoring metric that maximises Australia’s leaderboard ranking.
We’ve limited the scoring method to a few basic rules:
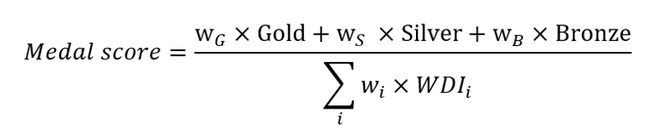
- The score will take a weighted sum of gold, silver, bronze medals and penalise by some weighted sum of selected world development indicators in the form:
- Gold medals need to be worth at least as much as silver, silver at least as much as bronze
- WDI metrics cannot contain negative values nor percentages
This leaves 112 WDIs and 3 medal counts (G/S/B) for each of the 200 countries. We need to find the 115 weighting factors that best improve Australia’s score versus all competing countries. Since we’re maximising by rank and not just maximising a score, our task here is a non-differential optimisation problem with way too many parameters to brute force.
This means it’s time to break out the GENETIC ALGORITHMS! We start by picking some weights totally at random and just see where Australia ends up. Some of the runs look like this:
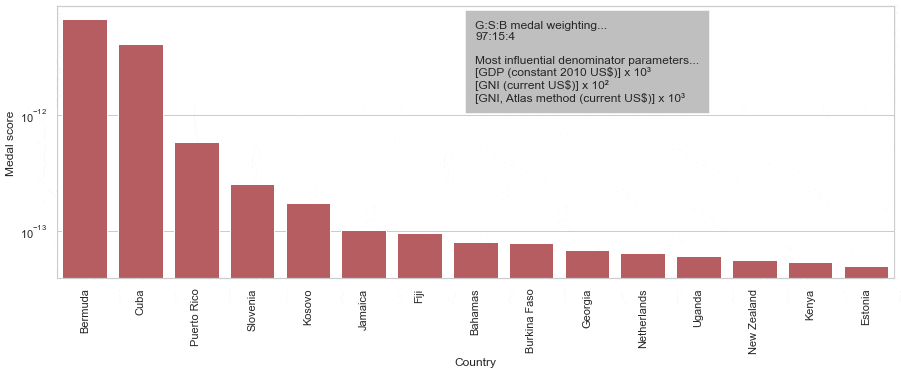
Once we get a thousand of these, we can extract the parameters of the scoring methods most favourable for Australia. This is where we draw inspiration from nature and pseudo-randomly mash together these best performing parameter sets to produce a new generation of offspring which contain a higher proportion of beneficial traits. Throw in a little bit of random mutation for good measure and repeat this process for 50 generations.
As you can see from the above graph, Australia made it to the top spot after 41 generations – that’s 41,000 different attempts at rigging the medal counts! After stripping out as many extraneous variables as possible and selecting appropriate units, here is our final medal scoring metric:
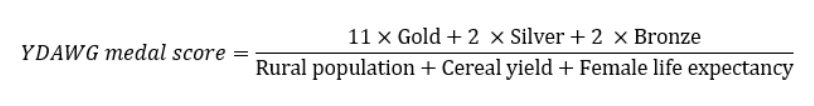
Where:
- Rural population is the country’s population living in rural areas measured in thousands
- Cereal yield is the production of dry grain in kilograms per hectare of harvested land
- Female life expectancy is the female life expectancy at birth measured in months
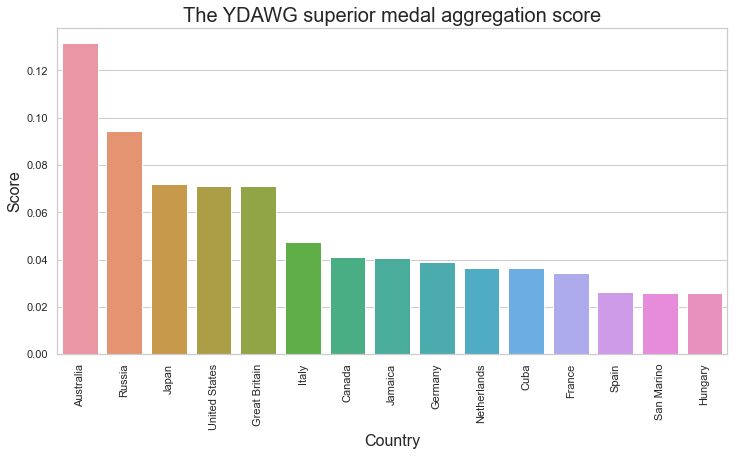
Wow! What a crushing victory by Australia at this Olympics, scoring 60% higher than the runner up!
Citius, Altius, Fortius – Communiter
This is the new and improved Olympic motto, meaning ‘Faster, Higher, Stronger – Together’ (in Latin because “Ταχύτερα Ανώτερος Ισχυρότερος – Μαζί” didn’t fit the right typeface).
The pursuit of being faster, higher, stronger is constantly on display in the Olympics as individuals and teams continue to achieve new heights that previously didn’t seem possible. So how far have humans really come in sporting achievement? Here we examine three of the oldest sports categories in the Olympics: athletics, swimming and weightlifting.
Citius
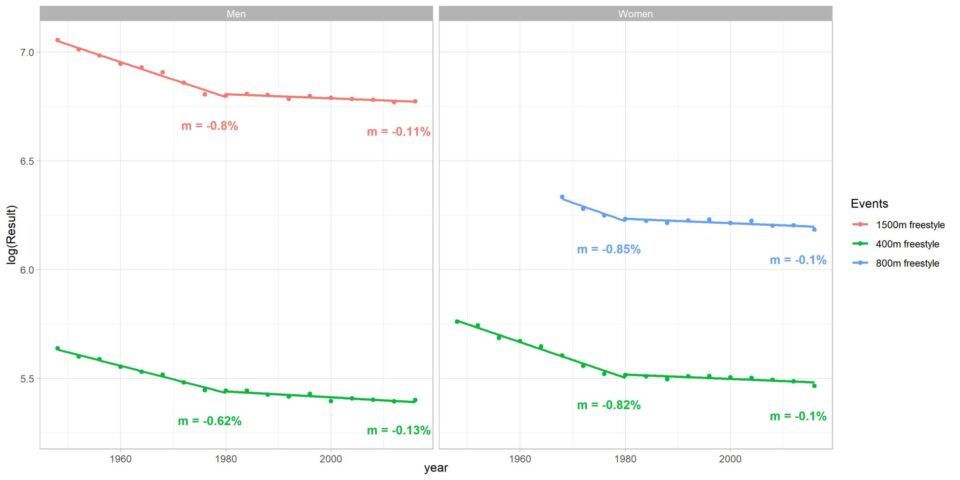
To investigate the pursuit of ‘faster’, the winning time from each event is plotted on the y-axis against the year which the Olympics was held on the x-axis. Separate regression lines have been plotted for games on or before 1980 and games after 1980, with the gradient m of the line representing the trend in the winning result over that period. The winning time is plotted on a log-scale to make the gradient scale invariant.
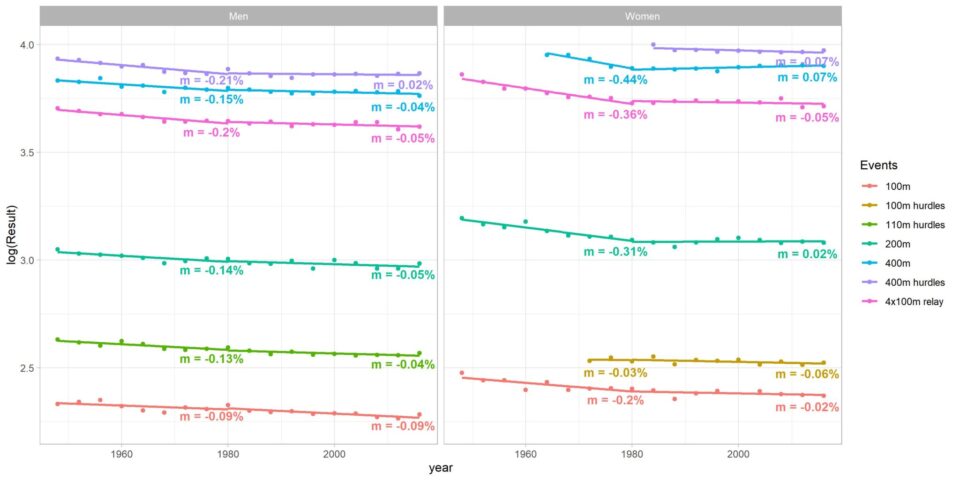
*Note: Winning time data could not be found for some events and is missing from the graph. Data is not shown for games before the 1948 London Olympics due to non-standardised time formats of recorded time and difficulty in cleaning the data.
Across all these track events as shown in figures 8 & 9, athletes have continuously broken the speed barrier and achieved faster times. This is seen especially in the long-distance events as more advanced training helps athletes to gain better stamina and better pacing. In 1948, Argentinian Delfo Cabrera Gmez clocked a time of 2:34:52 to win the men’s marathon gold medal, compared to Kenyan Eliud Kipchoge’s time of 2:08:38 to win gold in Tokyo, which is an improvement of 17%.
Meanwhile, for the men’s 100m, Italian Lamont Jacobs achieved a time of 9.8s to be crowned the fastest man on the planet this year, a 5% improvement from the 10.3s achieved by American William Harrison Dillard in 1948.
Although athletes have continuously set new records, the rate of becoming faster was noticeably higher prior to 1980. This could be due to early ‘quick-wins’ such as improved techniques, improved equipment, or increased accessibility to professional training. Winning a marathon while completing part of the race barefooted like the ‘barefoot runner’ Abebe Bikila in the 1960 Olympics seems like an impossible feat today. To break a record today would require the athletes to break their own physical boundaries while the external conditions are close to being optimised.
It is also interesting to note that the rate of improvement for the classic 100m sprint for men has been very consistent. The event is a challenge to human’s physical limits in the purest form and probably also why it is one of the most watched Olympics events.
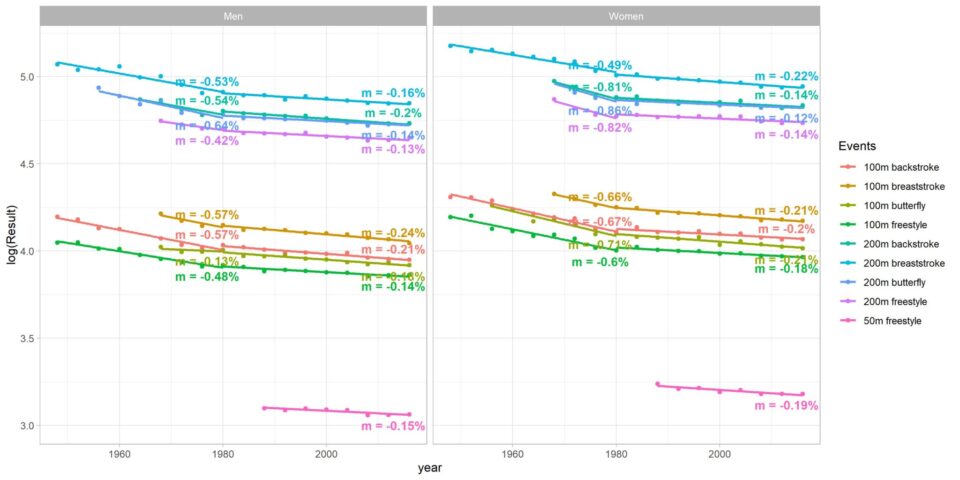
Swimmers in general have had more success in becoming faster over time compared to the runners, thanks to the greater scope for continuous refinement in their stroke techniques and supporting technologies such as the swimsuit, instead of purely breaking the physical boundaries. However, the same trend can be observed where the rate of improvement is considerably slower since 1980 as the ‘quick-wins’ in techniques and technology have all been exploited.
Altius
As there aren’t many Olympic events with the pure aim of becoming ‘higher’, we have grouped all the jumping related events in athletics into the pursuit of Altius.
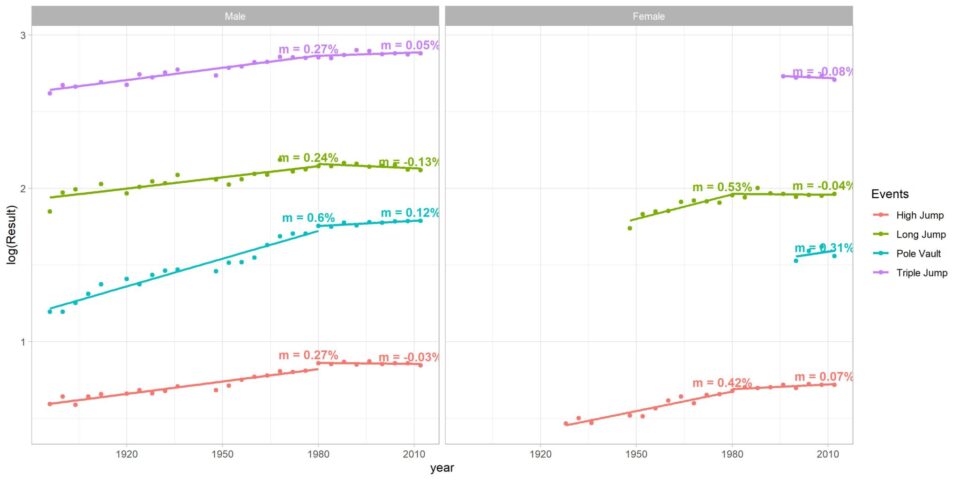
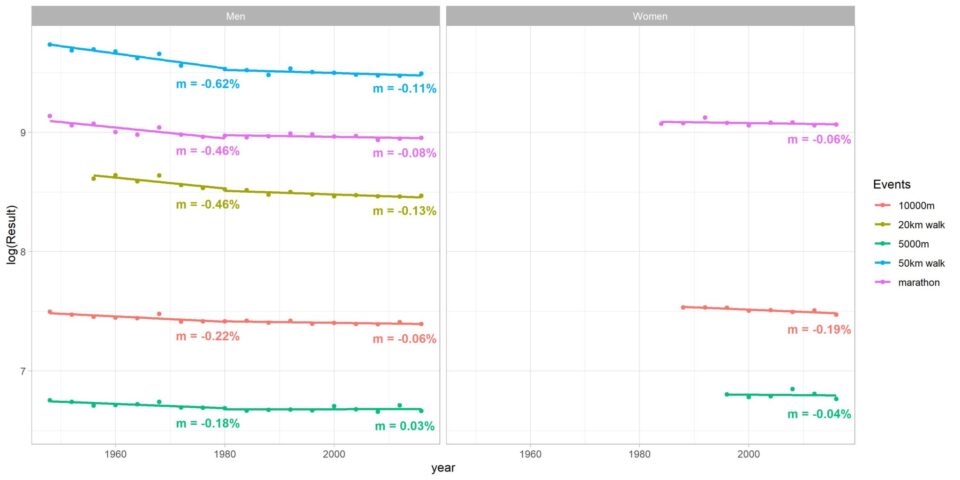
Of the aspirations set out by the motto, Altius is probably the one where humans have had the least improvement over the last couple of decades. This is also where we can find three of the four remaining Olympic records in men’s athletics that were set in the 20th century, led by American Bob Beamon’s long jump of 8.9m set in Mexico in 1968 which seems untouchable today.
One counterexample is pole vault, where the pursuit of ‘higher’ has been directly facilitated by improvements in technology. Pole vaulters initially used poles made from bamboo fibre or steel. From the 1950s, fiberglass poles were made available and now carbon fibre is used, with significant reduction in weight and increase in elasticity from each development.
Fortius
To investigate the pursuit of ‘stronger’, we’ve used the winning result of the weightlifting gold medallists. As the weight-classes have frequently changed across Olympics, regression is done between the winning result and the upper range of the weight class (athletes usually try to be as close to the upper limit as possible to gain an advantage) to determine the relationship between athlete’s weight and the weight lifted.
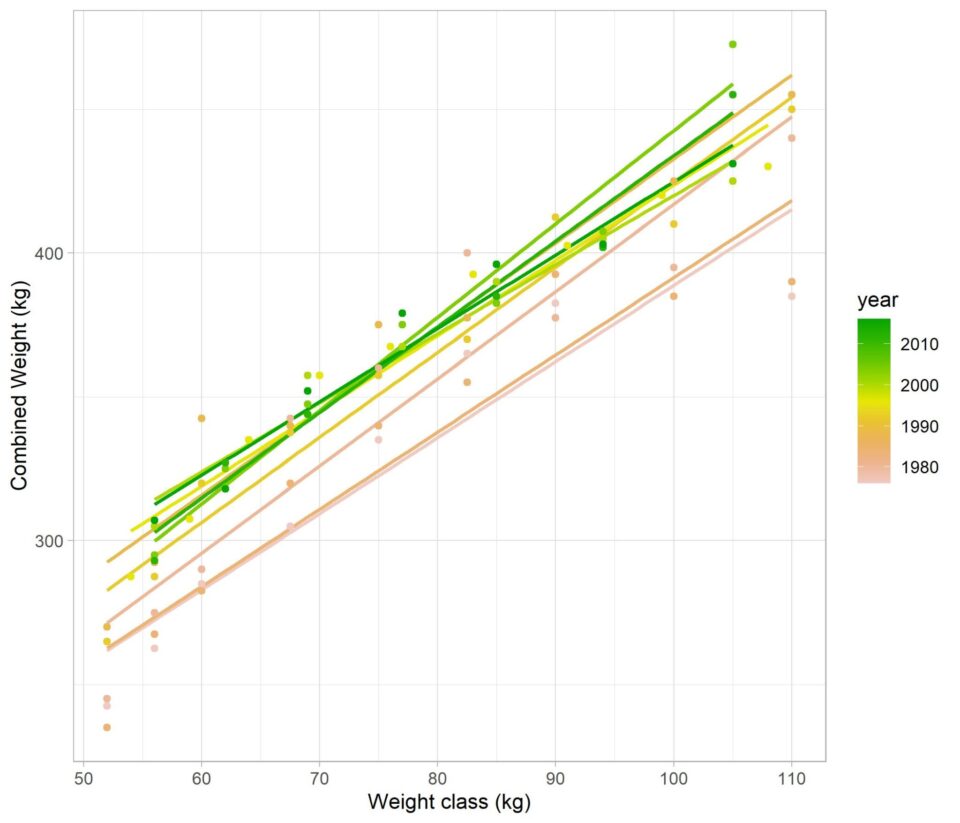
*Note: Women’s weightlifting only became an Olympic event from 2000 and therefore is not included. Combined weight is the combined result from snatch and clean and jerk. Results from years prior to 1976 are not shown as they also included weight from clean and press.
Given the same weight, there is a clear trend in athletes becoming stronger in the 1980s, while the winning results have remained stagnant since the 21st century. It is worth noting however that the criteria for what is classified as a successful attempt has been tightened over the recent years.
Communiter
One of the many things the COVID-19 pandemic has reminded us of is how connected we are in the modern world and how painful it is when that is taken away from us. To emphasise the importance of sport in bringing people together, the Olympics unanimously decided to add the word ‘Together’ to the 97-year-old motto.
Together – team sports
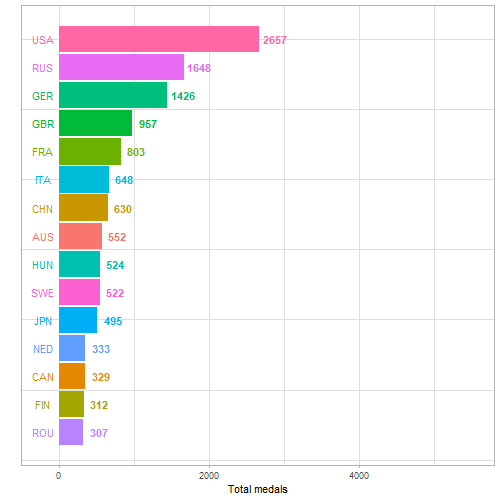
When an event is won together by a team of athletes, each athlete brings home an individual medal. The Brazilian men’s soccer team and Canadian women’s soccer team each got to take home 22 gold medals for their victory in this Olympics. However, this is not reflected in the medal tally, as each team only counts towards the medal tally once. So which countries’ athletes are the ones that are better at winning together in a team event and taking home the most medals, and which tend to perform better individually? Figures 14 & 15 shows adjusted medal tables corresponding to the total number of medals taken home by the country’s athletes, and how that compares against the conventional medals table (only the top 15 countries in the total medals tally have been included in both analyses).
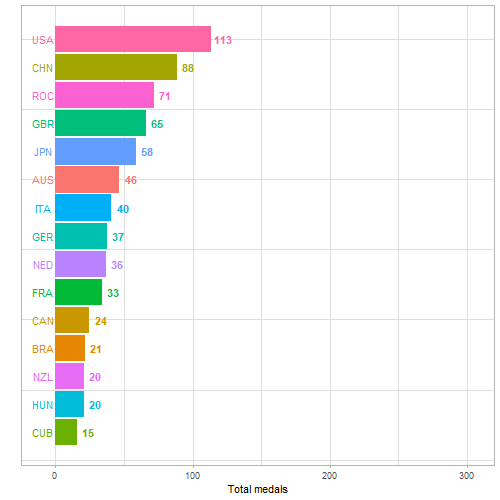
France was definitely the biggest winner of team events in this Olympics relative to their overall performance, with gold in men’s volleyball and both men and women’s handball, as well as medals across rugby sevens, and men and women’s basketball. For every medal in their official medal tally, they have taken home an average of 4.15 medals.
In comparison, almost all of Cuba’s wins were in individual events with the only exception being men’s C-2 1,000m (canoeing).
Next we looked at the average number of athletes per winning team.
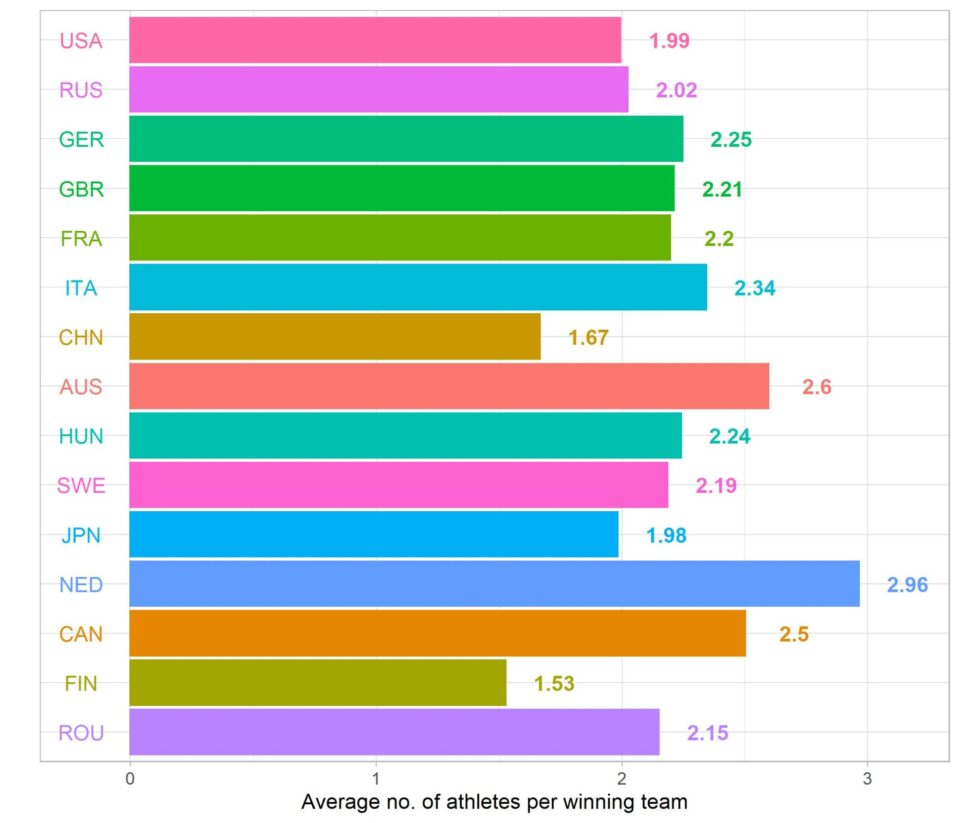
Across the entire history of the Olympics, the Dutch had the best team performance relative to their individual performance, thanks to their strong hockey team that accounts for over a quarter of the total medals that Dutch athletes have taken home. Coming in second is Australia, despite taking home over 400 medals from swimming. Our strong performance in water often makes us forget that we are also competitive in team events, with the Kookaburras winning Olympic medals in hockey nine times.
On the other end of the spectrum, we see China and Finlandexcelling the most in the individual events relative to team ones, each with less than 1.7 athletes per winning team. The top three contributors to China’s medal tally are gymnastics, diving and weightlifting, and for Finland the contributors are athletics and wrestling, all of which are predominantly individual events.
Together – gender equality
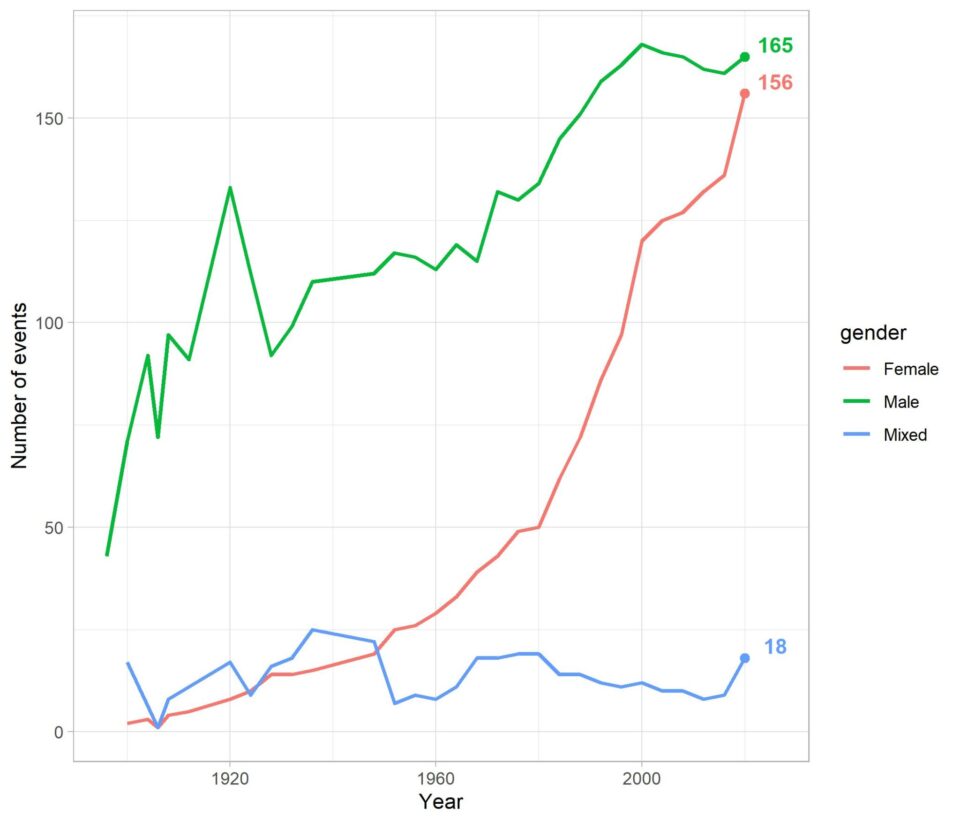
Tied in closely with the addition of ‘Together’ into the motto, the Tokyo Olympics had a strong focus on gender equality. This is seen right from the opening ceremony with male and female flagbearers holding the flag together as they walked into the Japan National Stadium, the first time in Olympics history. Then the Olympic torch was carried together by male judoka Tadahiro Nomura and female wrestler Saori Yoshida.
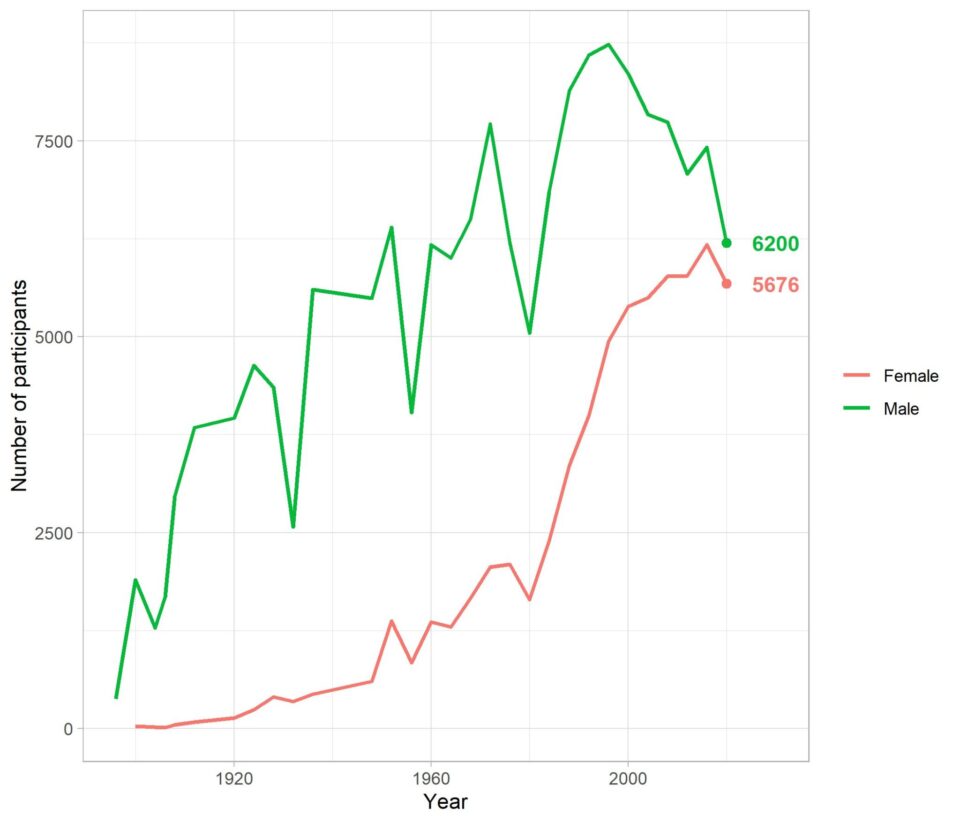
The journey of shifting the Olympics from a heavily male-dominated event to now having almost equal numbers of male and female participants was not completed in a day. When women first participated in the Olympics in 1900, there were only two female events – tennis and golf, along with three other mixed events with female participation – croquet, sailing and equestrian. New female events were added in every subsequent Olympics, now with Tokyo 2020 being the closest to achieving gender balance in event and participant numbers in Olympics history.
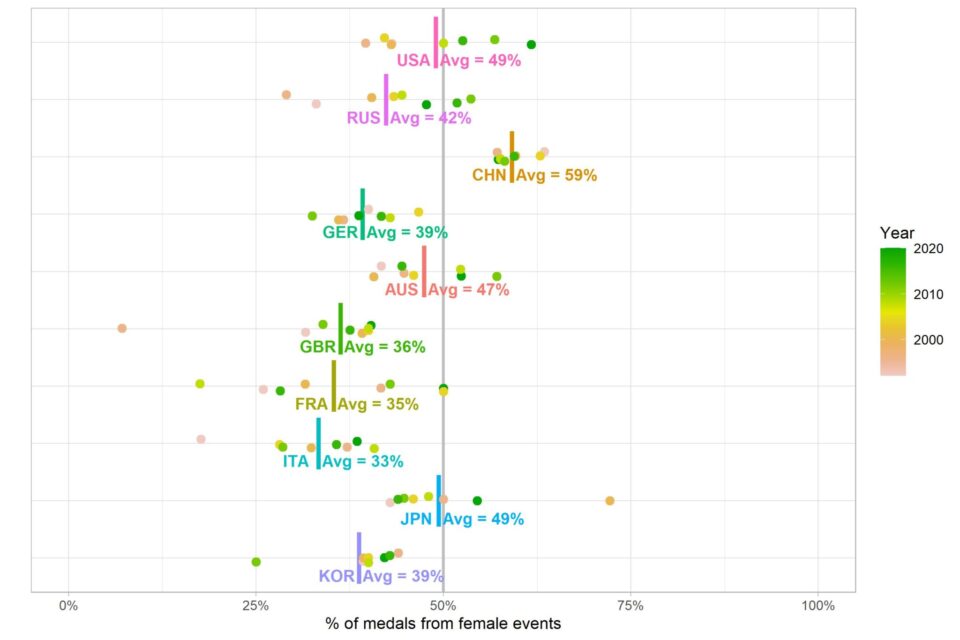
For individual countries, we can also see a varying level of participation and competitiveness between their male and female athletes. Figure 19 below shows the proportion of medals won from women’s events out of the country’s total medal tally across the last 30 years (excluding open/mixed events). Out of the top 10 countries in the combined medal tally, Australia, Japan and USA were the most balanced in terms of medals won from male and female events. The proportion of medals won by our female athletes has consistently been between 40–60%, while for the UK, France and Italy women’s events only account for roughly a third of the medals won.
Although there has not been much change in the relative performance of female athletes from Germany, there is one historic achievement that they can be extremely proud of from Tokyo – rider Julia Krajewski became the first female to win gold in the individual equestrian event since it became a mixed event in 1964.
In contrast, China is a real outlier in this graph with the strongest performance by far in female events relative to other countries. The proportion has been around 60% with remarkable consistency, while for many other countries it has never been over half.
Olympic longevity
July was a big month for Australian sport. Emma McKeon took home four gold medals in the pool, helping Australia to achieve its best performance since Beijing. Meanwhile, Brisbane won the bid to host the 2032 Olympics! We can only hope this combination of events inspires the next generations of Aussie Olympians. But who are the next generation of Aussie Olympians? Were they sitting down in front of the TV with Mum and Dad watching Emma take gold? Were they in the 2021 Tokyo athlete village? And can we expect to see Emma bring home gold on home soil in 2032?
The below violin graph shows the distribution of ages, by gender for each sport in the Olympics since 1960.
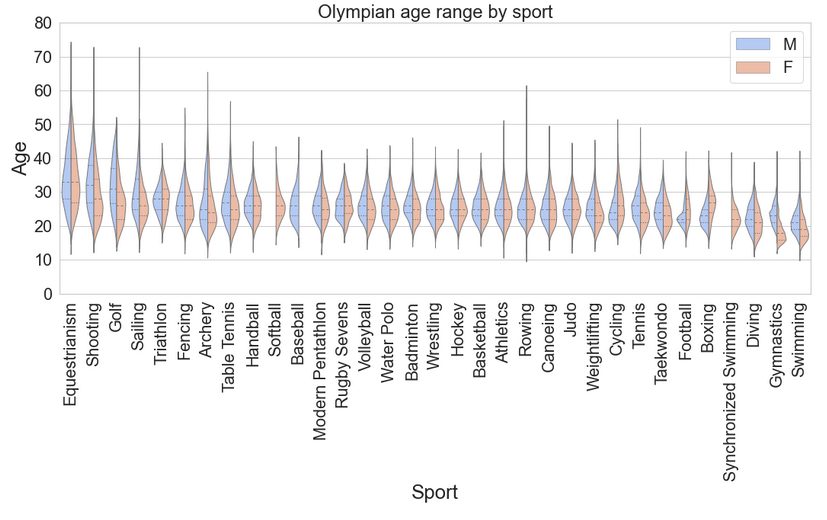
The graph shows a wide age range for most sports, with the bulk of athletes in their 20s and the youngest competitors in their pre-teens. For sports such as equestrian and shooting, it is not uncommon for athletes to be in their 30s or 40s, and records show past competitors in their 70s. This suggests you may see the jockeys and sharpshooter Olympians of Tokyo in Brisbane in 2032. This contrasts with the female swimmers, gymnasts and divers who are mostly in their teens and early twenties. However, the oldest swimmers are in their 40s, so we cannot write off Emma’s Brisbane 2032 chances just yet.
The below graph shows the maximum number of Olympic appearances for individual athletes within each sport, and the age at which they competed.
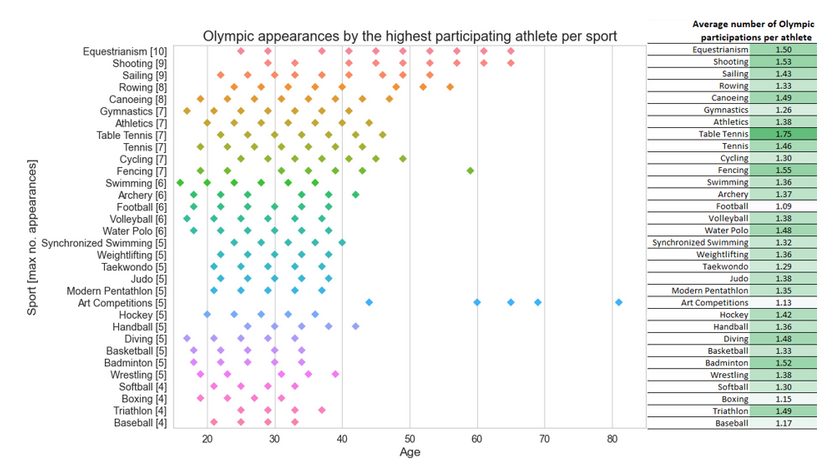
History shows that age has not stopped jockeys and shooters from competing in multiple Olympics. Ian Miller of Canada competed in equestrian mixed jumping at 10 Olympic games and waited until the ninth (at age 61) to take home a medal.
The above chart also shows the average number of Olympic appearances, even for the most re-represented sports, is consistently less than two. This suggests that most athletes competing in Brisbane 2032 are likely to be a new generation of Olympians, probably in their teens at the moment. One probable exception is 24-year-old Jack Rossiter, a two-time Australian Olympian who will be in the prime of this shooting career at age 35. Out of any Aussie Olympian, Jack best fits the profile of a Brisbane Olympian, so keep an eye out for him in 2032, because he’s our best shot.
In the meantime, we’ll also be training our skills to provide you even greater athletic analytics when the time comes.
CPD: Actuaries Institute Members can claim two CPD points for every hour of reading articles on Actuaries Digital.


