What is the relationship between unemployment rate and disability claims experience?
An economic downturn is intuitively associated with higher morbidity claims costs in general and unemployment rate tends to be a fairly good proxy for the state of the economy. However, the relationship between unemployment rate and disability claims experience is poorly understood and it is a challenge to accurately quantify the link between the unemployment rate and disability claims costs.
This blog summarises key findings from various research papers (both locally and internationally) and attempt to quantify the relationship between unemployment rate and disability claims experience. It is intended to assist the reader in forming his/her own view on the matter.
We would like to thank COVID-19 Working Group (Morbidity and Economic Impact) members, especially Richard Lyon for the peer review.
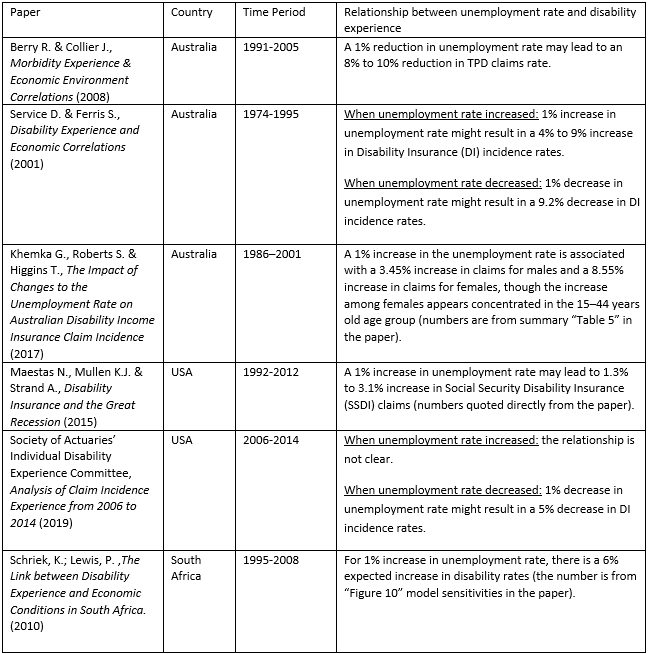
The following table provides a summary of the past research examined and the implied relationship between unemployment rate and disability experience.
From the research papers examined, it appears that historically, the relationship between unemployment and morbidity claims incidence is stronger when unemployment is falling than when it is rising. As far as the numerical linkage is concerned, the research papers support anything between 1-3% and 8-10% claims rate change for 1% unemployment rate change. There is also a fall in termination rates in and after a recession observed.
Furthermore, some of the studies point to the indication of a time lag between unemployment and the change in morbidity claims experience.
Click chart to expand
However, considerations involved about why it might be different this time include:
- there is a much greater prevalence of mental illness claims than historically;
- the economic decline is brought about by a health crisis (where the capacity of the economy to operate is driven by the infection rate and the government’s strategic response to the crisis) instead of a financial or economic crisis and occurred very abruptly over only a few weeks compared to months;
- change in meaning and relevance of the official unemployment rate (for example temporarily stood down workers as well as workers working very few hours are not included), also noting that different countries define unemployment differently;
- huge fiscal support for those affected, including Jobseeker and JobKeeper schemes
Some other considerations involved in applying the learnings to the Actuary’s insurance portfolio might include:
- how different occupations and industries are affected, having regard to the nature of employment (e.g. casual, permanent or self-employed);
- how to relate population impacts to the specific portfolio;
- how government regulations such as ASIC 633 for Group insurance (removal of ADL restriction for TPD) will affect the link between unemployment and overall claims cost; and
- what the prognosis might be – will it be an L-, U- or V-shaped recovery and how will that apply to different occupations and industries?
Calling upon all life insurance actuaries to help
the link between unemployment and disability claims costs should be. This is a great opportunity for all of us to contribute to make a difference by providing valuable insight into what the industry thinks on this topic.
To participate in the survey and contribute to make a difference, please click here and also help us to share the link below with your fellow life insurance actuaries colleagues.
We aim to publish another blog post in a few weeks with details of the survey results. Furthermore, if you are aware of any other relevant research analysing the link between unemployment and disability insurance, please feel free to share the source in the discussion forum and we can update our blog with that particular research piece, once curated.
The following depicts the research papers/articles curated that relates to the study of economic conditions and morbidity experience in different markets in more details.
1) Australian studies
Berry R. & Collier J., Morbidity Experience & Economic Environment Correlations (2008) Actuaries Institute, Financial Services Forum 2008
This is a presentation rather than a formal paper. From the conclusions in relation to the impact of unemployment on TPD:
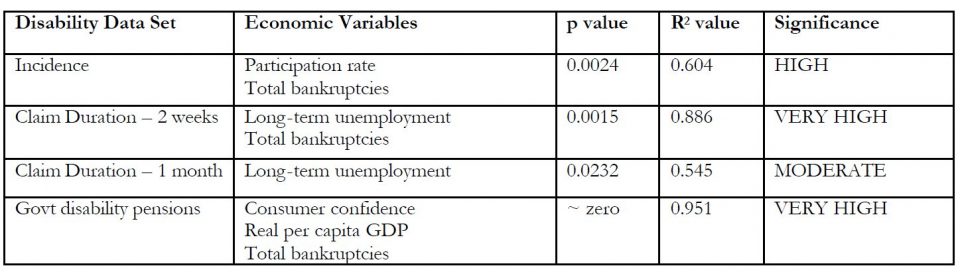
- Higher unemployment and long term unemployment rates appear to significantly increase the prevalence of TPD claims (evidenced by large positive regression parameters) and appear to explain a significant proportion of the variability in the injury rate (evidenced by high R-squares).
It is worth noting that the study covered the period from December 1991 to December 2005. The following graph shows the relationship between unemployment rate vs KPMG group TPD claims rate.
Click graph to expand.
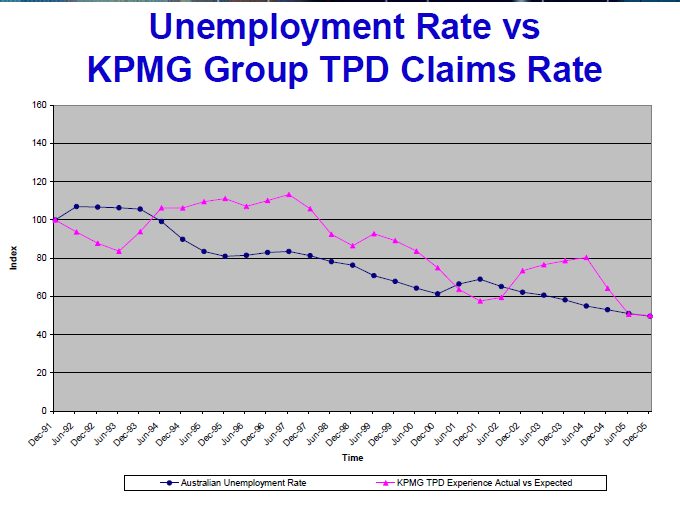
The presentation does not specify the exact relationship between unemployment rate and claims costs. However, from the graph above, the relationship might be sensitive to the period but still suggests the following:
- For the period from Dec 1991 to Dec 2005, when unemployment rate reduced from 10% to about 5% (5% reduction), KPMG group TPD claims rate would reduce from index 100 to index 50 (about 50% reduction). That is, 1% reduction in unemployment rate leads to a 10% reduction in TPD claims rate.
- For the period from June 1994 to Dec 2000, when unemployment rate reduced from 10% to about 6% (~4% reduction), KPMG group TPD claims rate would reduce from index 105 to index 75 (about 30% reduction). That is, 1% reduction in unemployment rate leads to a 8% reduction in TPD claims rate.
- For the period from Dec 2001 to Dec 2005, when unemployment rate reduced from 7% to about 5% (~2% reduction), KPMG group TPD claims rate would reduce from index 59 to index 50 (about 15% reduction). That is, 1% reduction in unemployment rate leads to a 8.5% reduction in TPD claims rate.
- Overall, a 1% decrease in unemployment rate may lead to 8% to 10% decrease in TPD claims rate if we analyse the period differently.
Disability Income:
Service D. & Ferris S., Disability Experience and Economic Correlations. Actuaries Institute, Biennial Convention 2001. Concurrent 5B
The paper uses insured claims incidence and claim duration data from published reports of the Institute of Actuaries of Australia Disability Committee, as well as disability pension data, covering the period 1974 to 1995. The authors applied a forward stepwise regression process to analyse changes in the experience against 12 economic variables.
The results are credible evidence which supports the widely held view that disability experience is materially affected by economic conditions. However, determining the relationship between disability and the economy is a subjective and complicated process.
By using A/E ratio from the paper, we can analyse A/E ratio vs unemployment rate (from ABS data). The following graph shows the incidence rates A/E ratio for disability income together with unemployment rates.
Click graph to expand.
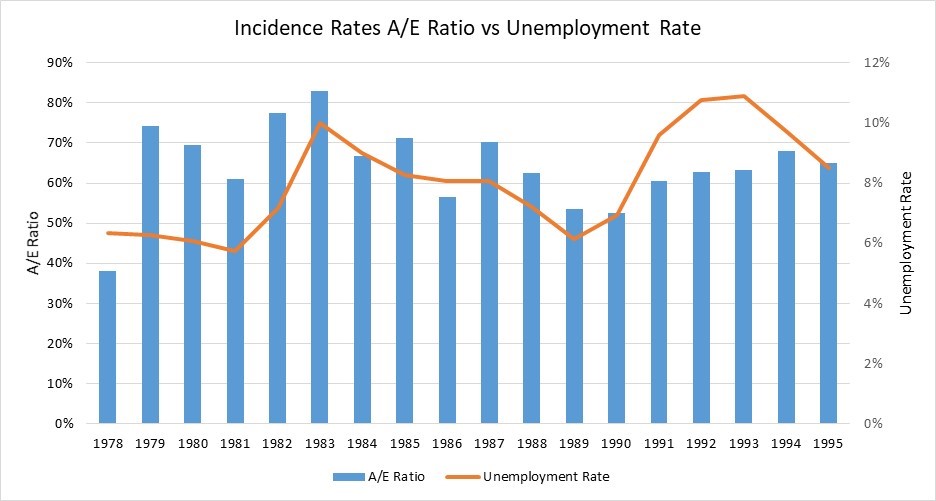
From the table above, it is observed that there is some positive relationship between unemployment rate and A/E ratio. And the relationship may be different when we analysed separately the period of increased unemployment rates compared to decreased unemployment rates.
When unemployment rate increased:
- For the period from 1981 to 1983, when unemployment rate increased from 5.8% to 10% (4.2%), A/E ratio increased from 61.1% to 83% (35.8%). Hence, for 1% increase in unemployment rate, it would lead to 8.5% increase in DI incidence rates.
- For the period from 1989 to 1993, when unemployment rate increased from 6.9% to 10.9% (4.8%), A/E ratio increased from 53.5% to 63.3% (18.3%). Hence, for 1% increase in unemployment rate, it would lead to 3.9% increase in DI incidence rates.
- For the period from 1989 to 1995, when unemployment rate increased from 6.9% to 8.5% (2.4%), A/E ratio increased from 53.5% to 65% (21.5%). Hence, for 1% increase in unemployment rate, it would lead to 9.1% increase in DI incidence rates.
Overall, for 1% increase in unemployment rate, there is a 4% to 9% increase in DI incidence rates.
When unemployment rate decreased:
- If we analyse the period from 1983 to 1989, when unemployment rate decreased from 10% to 6.1% (3.9%), A/E ratio decreased from 83% to 53.5% (35.5%). That is, 1% decrease in unemployment rate would result in a 9.2% decrease in DI incidence rates.
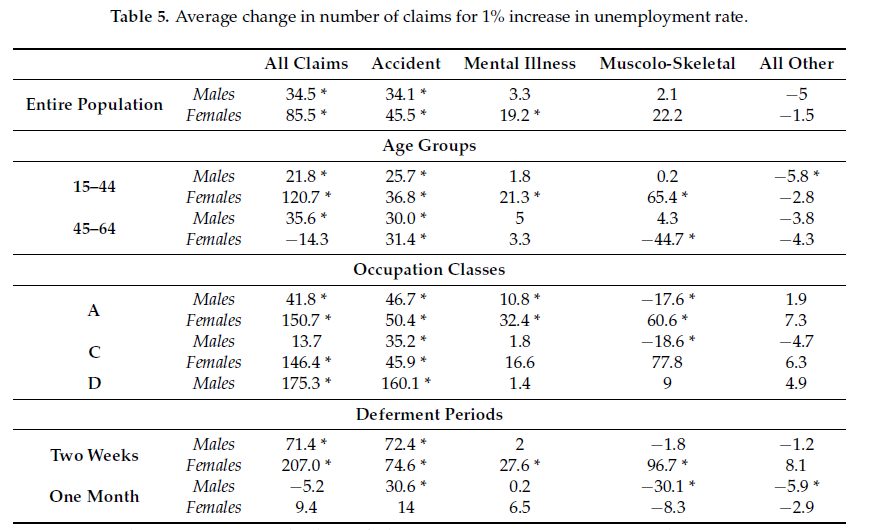
Khemka G., Roberts S. & Higgins T., The Impact of Changes to the Unemployment Rate on Australian Disability Income Insurance Claim Incidence (2017) MDPI Journal, Risks
The results of the analysis of Australian DII claim experience and economic conditions over the period 1986–2001 reveal that claim incidence increases with increasing unemployment rates.
In the paper, when unemployment rate increases from 3% to 15%, the impact in the females in expected A/E ratio (from 0.66 to 1.35) is greater than the impact of males (from 0.67 to 0.95). From the summary table 5 in the paper, on average, a 1% increase in the unemployment rate is associated with a 3.45% increase in claims for males and a 8.55% increase in claims for females, though the increase among females appears concentrated in the 15–44 years old age group. This observed counter-cyclical pattern of claim incidence is consistent with findings reported for the United States and for South Africa. The following table shows the model result:
Click chart to expand.
2) United States studies
Doudna, D.J. Effect of the Economy on Group Long Term Disability Claims, Journal of Risk and Insurance (1977), 44, 223–235.
The model suggests that claim rates are mainly driven by unemployment rate, corporate profits, consumer sentiment and seasonality. 74% of the variation in disability claims rate is explained by the regression model. The following table shows the regression result:
Click table to expand.
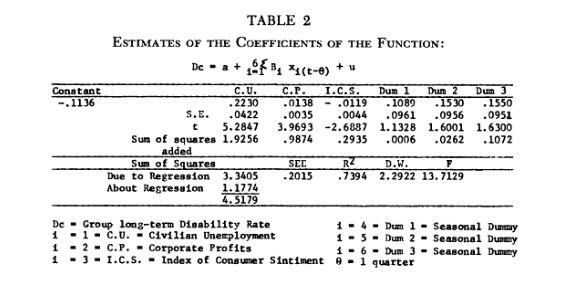
It seems evident that the claims rate is affected by unemployment and consumer sentiment. Because of the one quarter lag in the model, insurers will have current economic statistics and can apply those directly in the model to predict the level of disability claims in the next quarter.
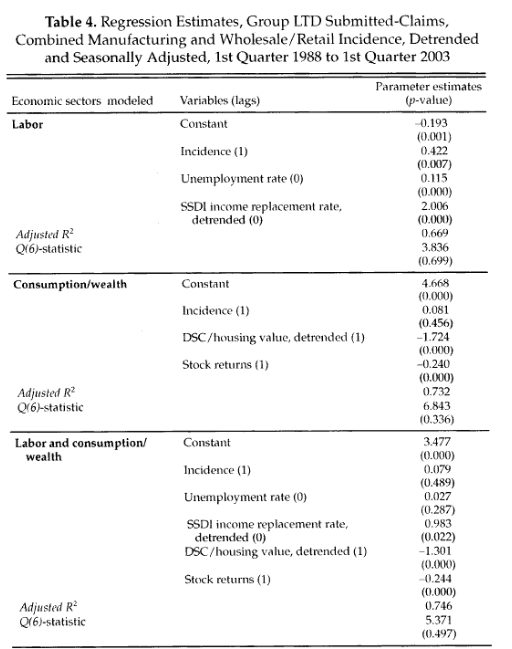
Smoluk, H.; Andrews, B. Group Long-Term Disability Insurance Claims and the Business Cycle. Journal of Insurance Issues (2009), 32, 154–172.
The results show that Long term disability claims incidence is connected to the macroeconomy, using variables that reflect the expected opportunity cost of filing a long term disability claims.
Click table to expand.
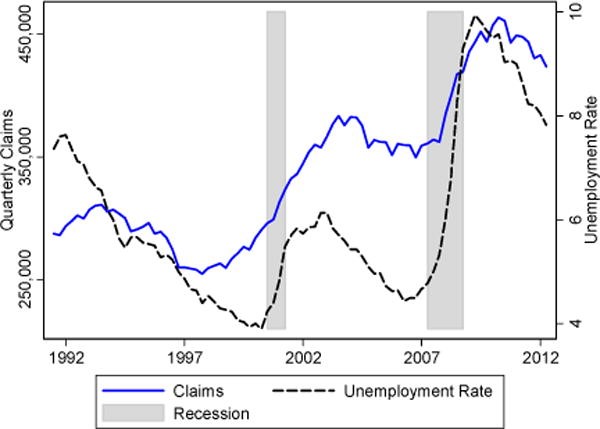
Johnson, S. Unum Long Term Disability Insurance Study (2011), Project Report; Worcester Polytechnic Institute: Worcester, MA, USA
Several economic factors influence the number of disability claims in a given time period. Typically, over the course of a recession, both private long term disability and public Social Security Disability Income (SSDI) experience an increase in the number of disability claims. Two factors that change drastically during a recession are unemployment and the consumption-to-wealth ratio. A change in either of these factors appears to relate to a change in disability incidence rates. The following figure shows the percent change in unemployment rate as well as the percent change in incidence rate over the past ten years for SSDI.
Click graph to expand.
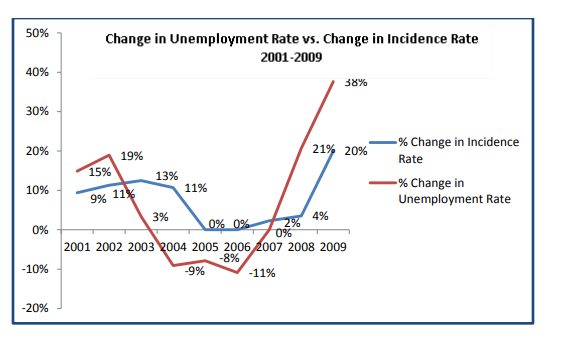
When there is an increase or decrease in the percentage change in unemployment, there is also an increase or decrease in the percent change in disability incidence rates. From the fourth quarter of 2007 to early 2010, the unemployment rate doubled from 4.8% to 9.7%. It is worth noting that a higher unemployment rate leads to a lagged increase in incidence rate from this study.
Maestas N., Mullen K.J. & Strand A., Disability Insurance and the Great Recession (2015)
This paper studied US Social Security Disability Insurance (SSDI) claims. Please note that this is public insurance instead of a private insurance product.
For [October 2006–December 2012], we find that SSDI applications increased by 1.3 percent for each percentage point increase in the unemployment rate—significantly different (p<0.01) from the estimated 3.1 percent effect over the entire 1992–2012 period. However, because the increase in the unemployment rate was so much greater in the Great Recession than in previous recessions (5 percentage points in the Great Recession vs. 2 percentage points in the 2001 recession, for example), the estimated overall increase in SSDI applications was still larger during the Great Recession. Specifically, we estimate that the Great Recession increased SSDI applications by 6.7 percent (=5*0.0134) at its peak in October 2009.
Click graph to expand.
Society of Actuaries’ Individual Disability Experience Committee, Analysis of Claim Incidence Experience from 2006 to 2014 (2019)
The following graph shows A/E incidence ratio:
Click graph to expand.
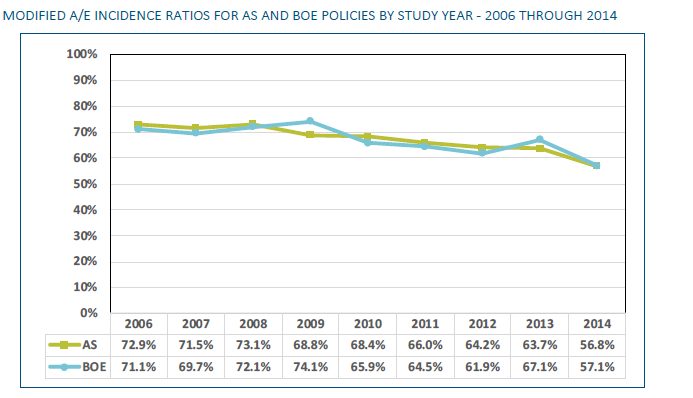
Accident and Sickness (AS) policies:
The contracts provide personal Individual Disability Insurance (IDI) coverage that make up the large majority of the IDI experience. Elimination periods range from 0 days to 2 years, and benefit periods range from short-term (e.g., 24 months) to a specific age (e.g., 65, 70) or lifetime. The face amount of AS policies are described in terms of the maximum monthly benefit.
Business Overhead Expenses (BOE) policies:
The contracts reimburse business owners for overhead expenses incurred while they are disabled. These policies typically have short elimination periods (e.g., 30 days or less) and short maximum benefit periods (e.g., 24 months or less).
The following graph shows A/E incidence ratio and unemployment rate:
Click graph to expand.
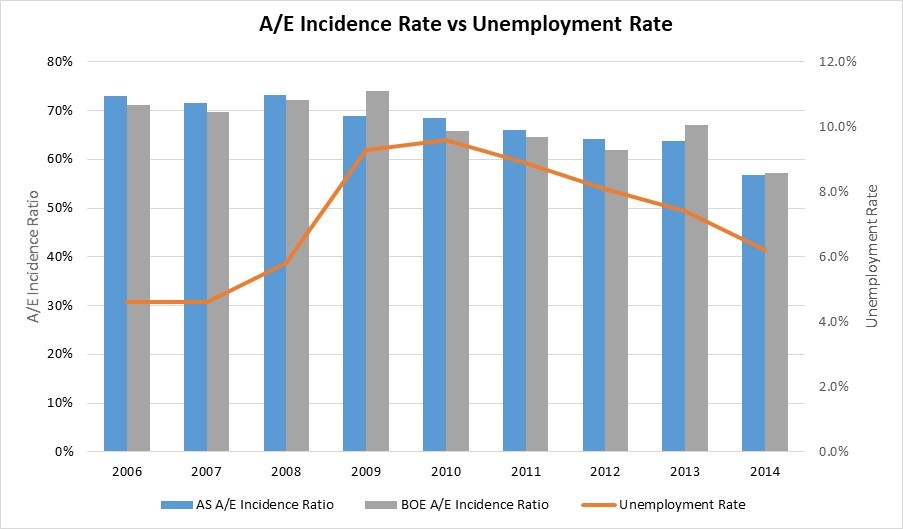
The relationship is different when we analysed the period of increasing unemployment rate and decreasing unemployment separately. For the period from 2006 to 2010 where unemployment rate increased, surprisingly, there is no associated clear increase in A/E ratios for both AS and BOE policies.
However, for the period from 2010 to 2014 where unemployment rate decreased, there is positive relationship between unemployment rate and A/E incidence ratio. For the AS policy, when unemployment rate decreased from 9.6% to 6.2% (about 3.4% decrease), A/E ratio reduced from 68% to 57% (about 17% reduction). So 1% reduction in unemployment rate would lead to a 5% reduction in A/E incidence ratio for the AS policy. For the BOE policy, A/E ratio reduced from 65.9% to 57.1% (13.4% reduction). So 1% reduction in unemployment rate would lead to a 3.9% reduction in the A/E incidence ratio for the BOE policy.
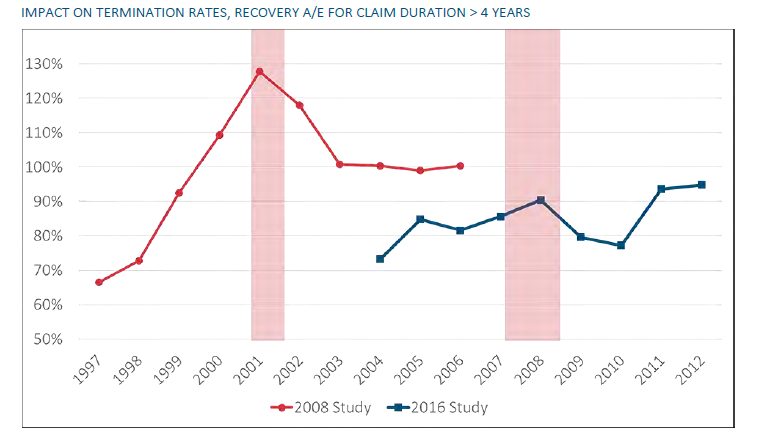
Group Long-Term Disability Experience Committee, Society of Actuaries, 2018 Group Long-Term Disability Experience Study Report (2018)
This paper mainly focused on termination study following the recession. In the section of economic cycles, it analysed the signs of the economy impacting long term disability claims terminations in the 2008 to 2016 studies and looked at claims recoveries A/E for early and later durations. For later claim durations, recoveries showed material drops following both recessions. The following figure shows the termination rates A/E for claims duration greater than 4 years.
Click graph to expand.
3) South African studies
Schriek, K.; Lewis, P. ,The Link between Disability Experience and Economic Conditions in South Africa (2010), International Congress of Actuaries 2010 Conference
This paper mainly studies the correlation between disability rates and economic conditions. It used four economic indicators, including unemployment, consumer confidence index (CCI), business confidence index (BCI) and GDP. 4 quarters lag for CCI, 1 quarter lag for unemployment and GDP, 2 quarters lag for BCI were considered in the modelling. Data period used in the paper is from 1990 to 2008 for individual insurance and 1995 to 2008 for group insurance.
The individual incidence rates were more stable and were able to fit a multi-variate model which, proves that there is an anti-cyclical link between the economy and disability rates, and which will enable insurance companies to estimate how much their rates and reserves could change when the economy changes. A univariate modelling exercise indicates that the strongest correlation is with Unemployment and Consumer Confidence. R square of nearly 50% implies about half of claims rates are explained by the model.
The following table presents a summary of expected sensitivities to changes in economic indicators.
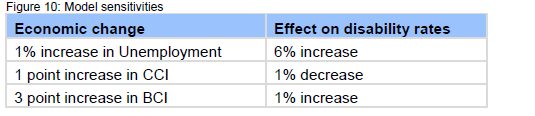
The model suggest that for 1% increase in unemployment rate, there is a 6% expected increase in disability rates. The following graph shows the relationship between unemployment (without lag) and disability rate.
Click graph to expand.
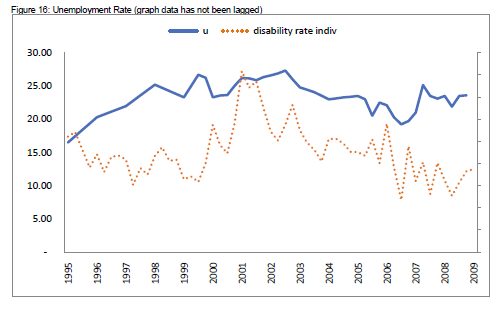
When unemployment rate decreased (from year 2002 to year 2007), disability rate reduced accordingly. However, when unemployment rate increased (from year 1995 to year 2001), disability rate increased overall but the exact relationship was less clear.
Concluding remarks
We summarised the research papers in Australia, United States and South Africa. Those countries’ studies show that there is an anti-cyclical link between economic conditions and morbidity. When the economy recedes, morbidity rates and claims costs will go up. However, when referring to past research papers, we invariably need to consider the differences between various markets.
In addition, it is worthwhile to mention that past periods may not be representative of what happens now in Australia. For example, there is obvious evidence of an increasing trend of mental illness claims since 2014. Moreover, there were some regulatory changes related to the group insurance industry (i.e. PYS/PMIF) and product change requirement for individual disability income policies in 2019. All these factors might affect the claims costs under the current situation.
Survey initiative
To assist the Working Group determine what the “collective actuarial judgement” within the industry thinks the link between unemployment and disability claims costs should be, please answer the following quick survey below:
In your view what’s the impact on total disability claims cost for Income Protection (IP) and Total Permanent Disability (TPD) products separately per 1% increase in official ABS headline unemployment rate?
Please note that on a comparable unemployment rate measure to the US and Canada, Australia’s official unemployment rate would have increased much more in April if using a broader measure including workers on zero hours due to no or not enough work or being stood down
For IP:
- a) < 4%
- b) 4% – 6.4%
- c) 5% – 7.9%
- d) 8% – 9.4%
- e) 5% – 11%
- f) > 11%
For TPD:
- a) < 4%
- b) 4% – 6.4%
- c) 5% – 7.9%
- d) 8% – 9.4%
- e) 5% – 11%
- f) > 11%
To participate in the survey and contribute to make a difference, please click here and also help us to share the link below with your fellow life insurance actuaries colleagues – https://www.surveymonkey.com/r/3VZ6SGX.
We aim to publish another blog post in a few weeks with details of the survey results.
CPD: Actuaries Institute Members can claim two CPD points for every hour of reading articles on Actuaries Digital.