


Identifying vulnerable populations in Australia using the COVID-19 Susceptibility Index
Over the past few weeks, there has been significant work on modelling infection and transmission rates in Australia. Much of the public discussion on COVID-19 to date has focused on lockdown measures and overall levels of infection. To add to the public conversation, we wanted to examine the potential for the pandemic to impact unevenly across the Australian population.
In this article, we provide some preliminary insights into identifying and locating potentially vulnerable demographic groups in our society. This information can assist ongoing attempts to model the pandemic’s development as well as inform decisions regarding preventative measures.
Considerable medical research exists on the co-morbidities of COVID-19. It has been well publicised that age and existing health conditions are significant risk factors. However, leveraging this information to identify the most at-risk communities requires additional analysis on its interaction with various sociodemographic factors. This is what we have modelled with our COVID-19 Susceptibility Index – an interactive map of this can be found here.
What is the COVID-19 Susceptibility Index?
A model of the Australian population has been developed by Finity which comprises profiles of households and individuals which when aggregated replicate the actual known multi-dimensional characteristics of Australians in each local community. Models such as these are often used to analyse the impacts of government policy. Finity’s model is called Defin’d.
The COVID-19 Susceptibility Index provides a risk score for each of the local communities that are represented by the modelled attributes within Defin’d. This score ranks the risk of severe illness if individuals in these communities were to contract the virus, based on the profile of significant co-morbidities (age, cancer, diabetes, cardiovascular disease, obesity and lung disease)[i]. These were identified through a review of published clinical research[ii] and consultation with doctors. Co-morbidity prevalence statistics from publicly available Australian health data[iii] by age, gender and geographic area were merged onto the Defin’d database in order to obtain the overall risk scores.
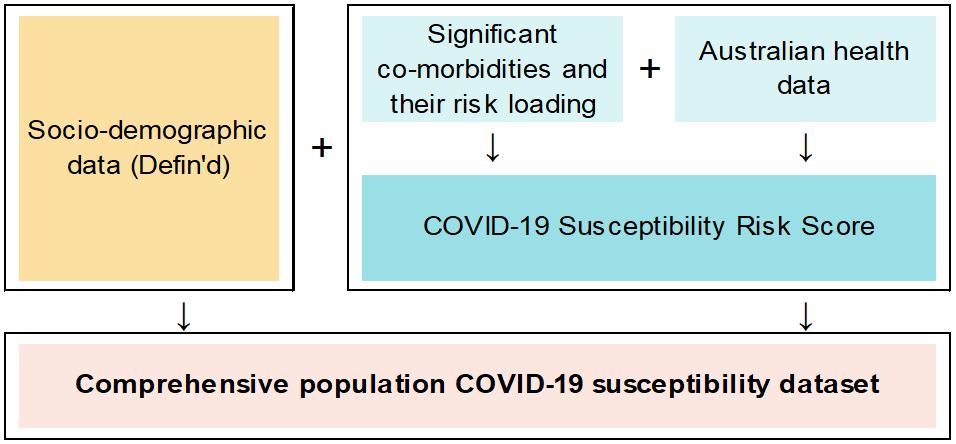
The resulting comprehensive population dataset containing risk scores, health conditions and socio-demographic attributes allows investigation into the susceptibility of different population segments to severe COVID-19 illness.
An important disclaimer: we have not modelled infection rates or transmissions. There is already a large body of impressive work on this topic – some Australian examples include the USyd network modelling, Doherty COVID-19 modelling, and USyd’s NSW database of COVID-19 cases. Instead, our work to date simply identifies the most vulnerable populations if these individuals were to be infected, and suggests some interesting possibilities for susceptibility which should be further explored.
Highlights
Our main take-away from the analysis so far is that COVID-19’s potential impact differs substantially between different communities. There is likely to be a disproportionately larger effect on Australians in lower socio-economic groups, with the disadvantaged retired population especially at risk.
Our results could be used by policymakers to target specific geographic areas and demographic segments for highest impact. For example, when a vaccine becomes available, the index could be used to identify which population segments should be prioritised. Another use case could be informing decisions around testing for COVID-19 in populations who are more likely to go on to develop severe reactions to the disease should they become infected.
Conversely, identifying segments of the population who face lower risk if infected would be useful in making decisions about selectively lifting lockdown or social distancing measures. This could allow for a more tailored approach in balancing efforts to reinvigorate the economy while keeping the population safe.
The rest of the article explores our modelling in more depth: Where are the most vulnerable, what makes them vulnerable, and which communities are most at risk? We also share our thoughts on how this Susceptibility Index could be used by government agencies, policymakers, and the general public.
Where are the most vulnerable Australians?
The maps below depict the average Susceptibility Index risk score per postcode. A higher score indicates a greater chance of severe illness/death, which is indicated by darker red on the map. You can also view an interactive version of this map here.
Figure 1: Average risk score by postcode across Australia and NSW & Victoria
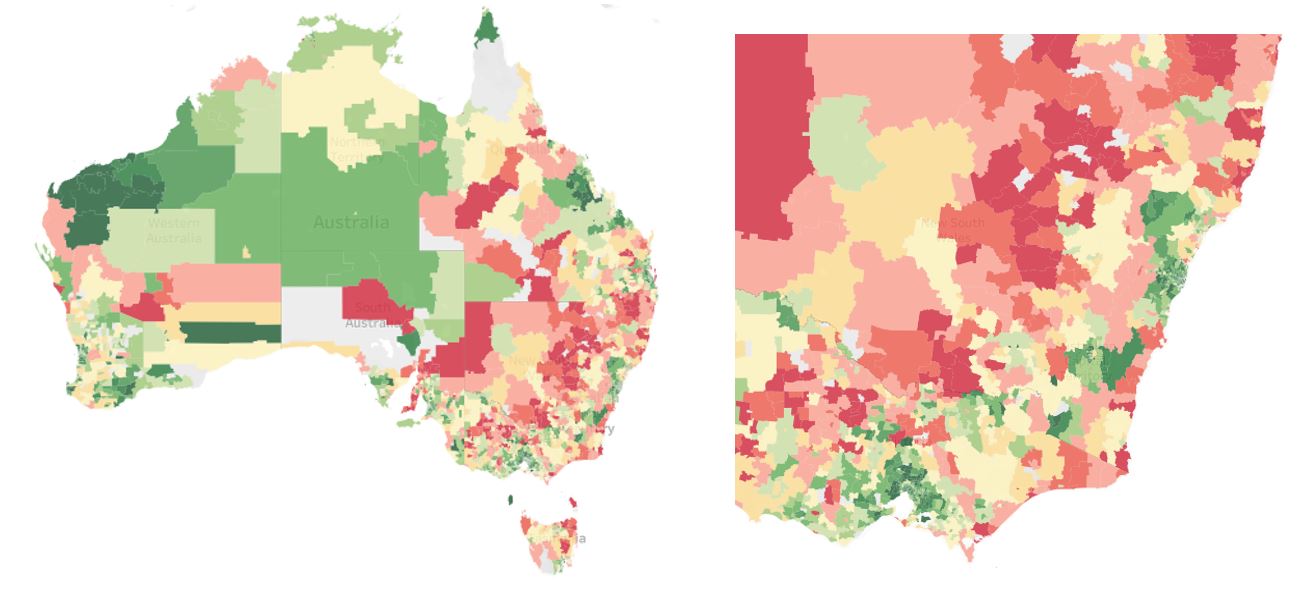
It can be seen that the vulnerable population segments are generally situated away from capital cities. In NSW and Victoria, there is a central ‘belt’ where the population is at greater risk. The data above is shown by postcode, but it is also available by LGA, PHA etc. down to an SA1 level.
We note that a postcode with a minimal average risk score does not mean that everyone in the suburb is safe. The above maps only show a summarised average of our results; however it is likely that even in low average risk suburbs, there are individuals with significant co-morbidities who would be at severe risk if they were to contract COVID-19. Thus it is crucially important to understand the distribution of the risk scores within a postcode and other demographic segments, which we explore in the next section.
Which Australians are the most susceptible to COVID-19 and why are they vulnerable?
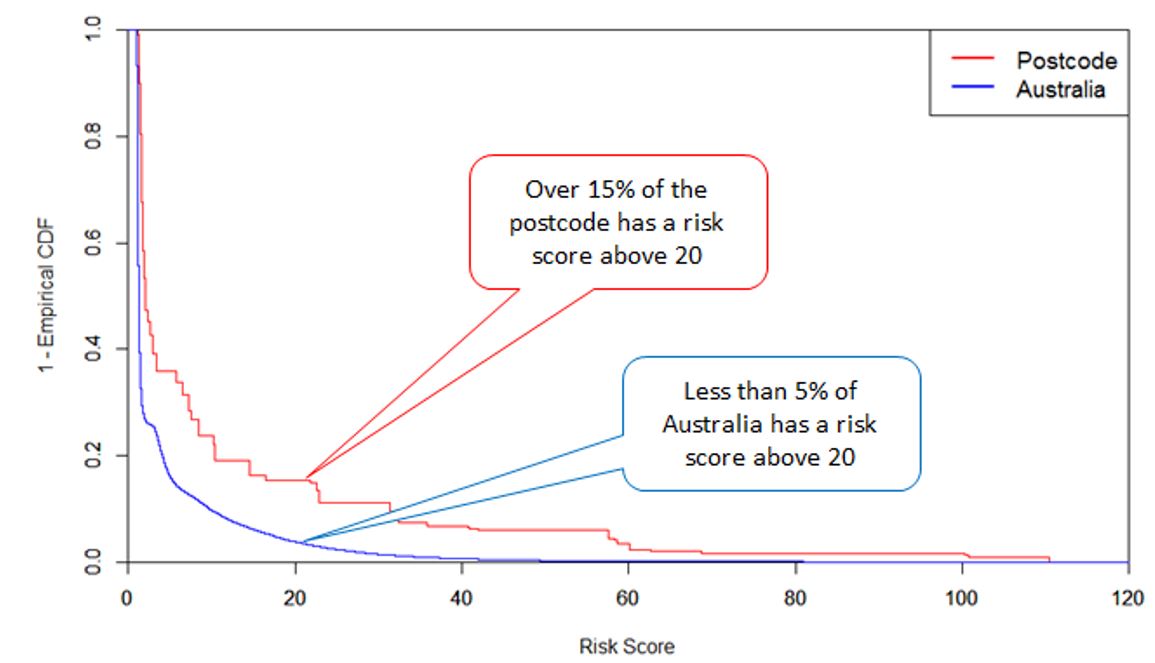
We examine a case study of a postcode with one of the highest average risk scores: 2440 (Kempsey Shire, NSW and surrounds). Figure 2 shows that the risk scores across the postcode are significantly higher than the general Australian population.
Figure 2: Risk Score Distribution
In the following charts, we investigate the drivers underlying the high risk scores in 2440 by looking at the contribution of each co-morbidity to the overall risk index.
Figure 3: Risk Score Distribution by Co-morbidity
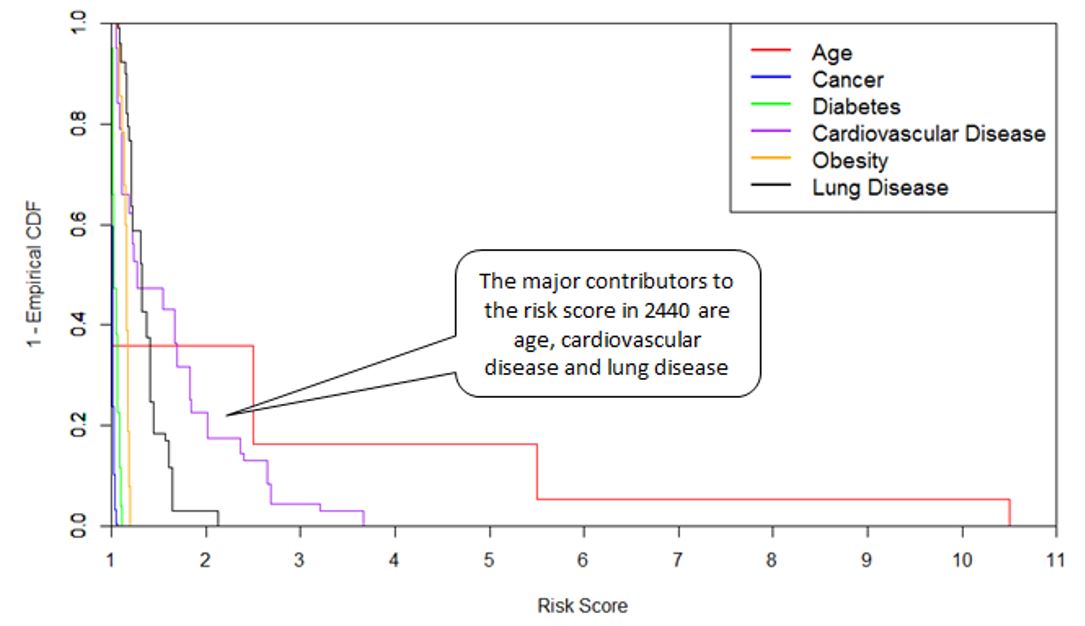
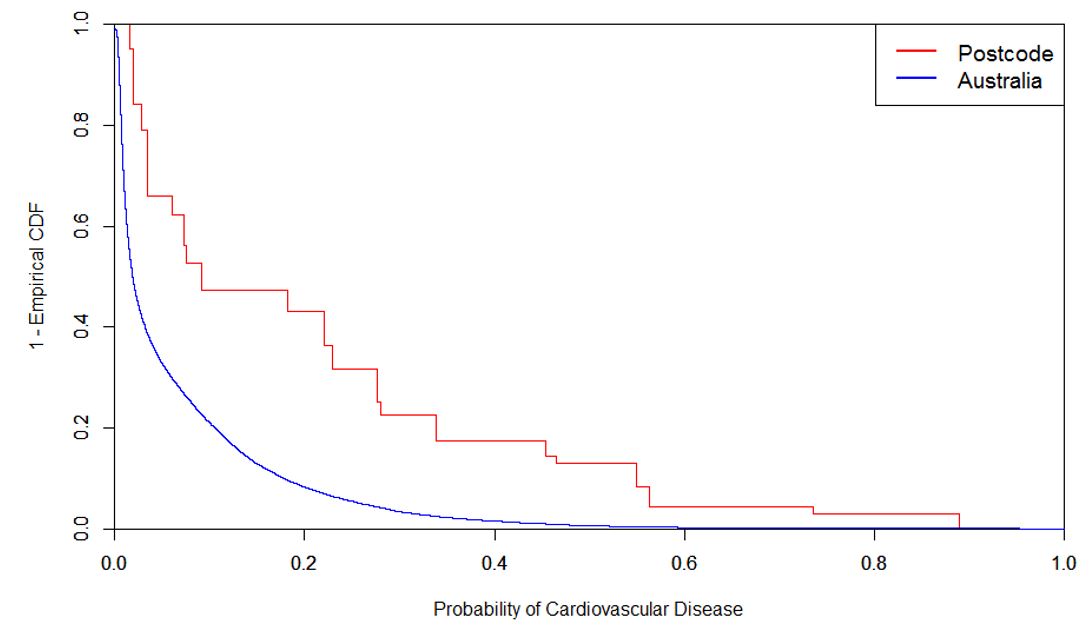
Figure 3 combines the interaction between the inherent risk of each co-morbidity and its incidence rate in the postcode, to tease out its contribution to the overall risk score. For 2440, the major contributors are older ages, cardiovascular disease and lung disease. By way of example, Figure 4 below shows that the incidence of cardiovascular disease in postcode 2440 is significantly higher than the general Australian population. The area also scores poorly for other co-morbidities. The combined effect indicates that 2440 may have, on average, a much higher risk to severe illness than the general Australian population.
Figure 4: Incidence of Cardiovascular Disease
Which communities are most at risk?
A finding from our analysis is that socioeconomically disadvantaged areas seem to have greater susceptibility to severe illness for COVID-19.
This is based on our examination of some results obtained by segmenting the dataset by the Socio-Economic Indexes for Areas Score (SEIFA)[iv]. The plot below demonstrates a strong negative correlation between SEIFA ranks and the average risk score for both the working population and retirees. Note that the risk score values for retirees are much higher than for the working population.
Figure 5: Average Risk Score by SEIFA Rank
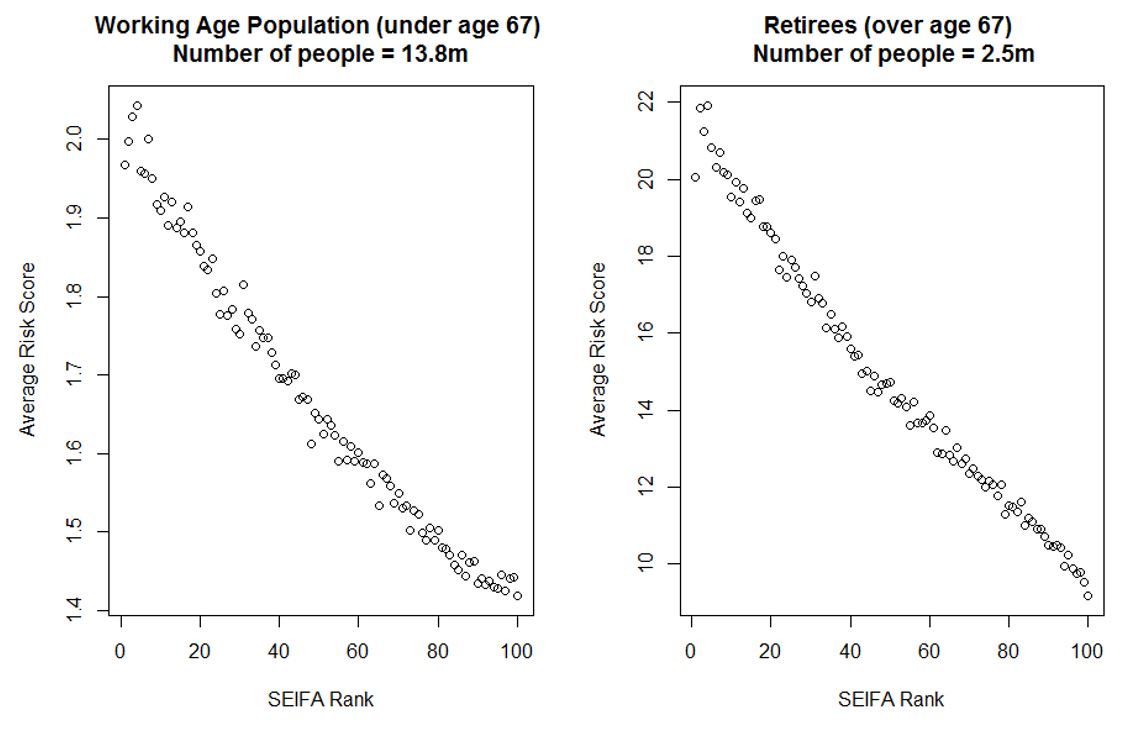
The plots above suggest that lower socio-economic levels correspond consistently to higher average risk of severe COVID-19 illness, regardless of age. A potential implication of these results is that there may be a disproportionately larger impact on lower socio-economic segments of the population. This is perhaps unsurprising – it is known in the medical community that in general, lower socio-demographic status is associated with worse health outcomes across many of the co-morbidities for COVID-19.
We also examine the most extreme risk scores (top 15%) across the Australian population to see whether this same relationship exists for individuals at highest risk, as identified by our model. This quantile was chosen based on the hospitalisation rate of diagnosed cases in this study.
Figure 6: Average Risk Score by SEIFA Rank for the top 15% of the Australian population
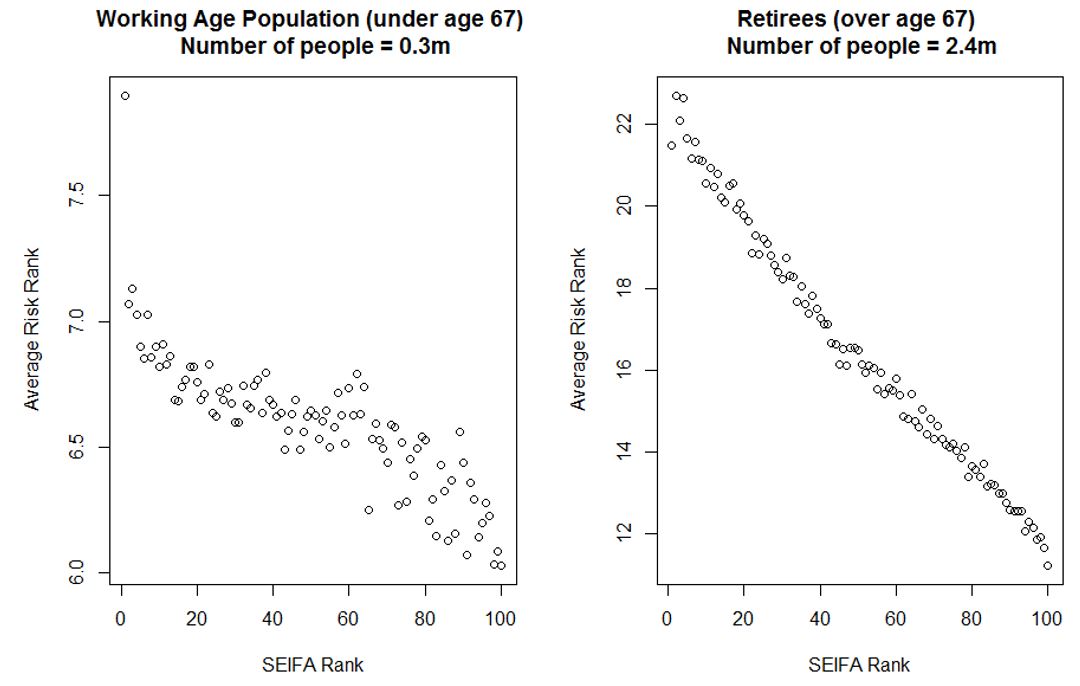
While the negative correlation still clearly holds for the population over age 67, the trend for the working age population is flatter in communities with SEIFA rank between 20 and 80. This means that the potential for severe cases is more randomly distributed across the middle socio-economic segments of the working age population. However, the strong negative trend is still largely present in highest and lowest SEIFA quintiles.
An important takeaway from this analysis is that one of the most susceptible groups to critical illness or mortality seems to be the disadvantaged retired population.
How can the COVID-19 Susceptibility Index be helpful?
We think there might be several places where the Susceptibility Index could be useful to government agencies, policymakers and the general public. As demonstrated by our analysis above, it is possible to identify which areas and demographics would be most at risk of severe illness or death if they were to contract COVID-19. This could aid medical, infrastructure and logistical planning, and the optimisation of resource allocation. Overlaying estimates of hospitalisation, ICU and death rates (from sources such as this New York study and this UK simulation-based model) may also help in planning for medical loads by geographic area.
When a vaccine becomes available, the index could be used to identify which population segments should be prioritised. The Index could also help with decisions around testing for COVID-19 in populations who may be likely to go on to have severe reactions to the disease should they become infected.
There are other demographic factors in our dataset which we have not yet investigated which may in due course yield valuable insights about specific segments of the population. For example, examination of risk score by household composition may be helpful in evaluating policy decisions, such as whether keeping schools open poses risks to their communities.
We can also investigate economic impacts resulting from illness or death within certain demographic segments or geographic areas. A clear use case is the examination of the impact of a widespread outbreak on specific industries and locations.
In terms of government planning, we envisage several ways in which the Susceptibility Index may be of use. Firstly, by providing a summary measure of severe illness risk by area, it is possible to get an estimate of the impact of different government policies, such as tightening lockdown measures.
Finally, the index can also provide insights concerning which demographic or geographic segments are the least risky. What suburbs could have quarantine restrictions eased with less risk? Which individuals in industry X of age group Y and geographic area Z could be most safely sent back to work to help revitalise the Australian economy?
We hope to have some further insights for you very shortly.
To view the map of the COVID-19 Susceptibility Index click here.
Our greatest thanks to all contributors who took the time to offer their professional expertise, interrogate our approach and results, and provide feedback.
If you would like access to the COVID-19 Susceptibility Index, please get in touch with the authors. Also if you have any suggested use cases, improvements or criticisms, we would be keen to discuss this with you. Please email calise.liu@finity.com.au.
[i] There have been several other co-morbidities identified in medical texts, such as hypertension and smoking. However, the interactions between these factors are not yet clear. Our modelling assumptions for the Susceptibility Index will be expanded upon in a future article.
[ii] Special thanks to the contributors to the COVID-19 Open Research Dataset Challenge on Kaggle https://www.kaggle.com/allen-institute-for-ai/CORD-19-research-challenge
[iii] Health incidences by Population Health Area from Australian Health Policy Collaboration http://www.atlasesaustralia.com.au/ahpc/data.html; Health incidences by Age and Gender from various sources including AIHW analysis of ABS data, Heart Foundation, Cancer Research UK, and ABS 2001 National Health Survey
[iv] We used the Index of Relative Socio-Economic Advantage and Disadvantage from https://www.abs.gov.au/websitedbs/censushome.nsf/home/seifa
CPD: Actuaries Institute Members can claim two CPD points for every hour of reading articles on Actuaries Digital.


