


Learning R in Melbourne: A recap of the YAP data analytics training workshops
Harrison Gee provides an inside view of the sell-out training events that were recently put on by the Young Actuaries Program.
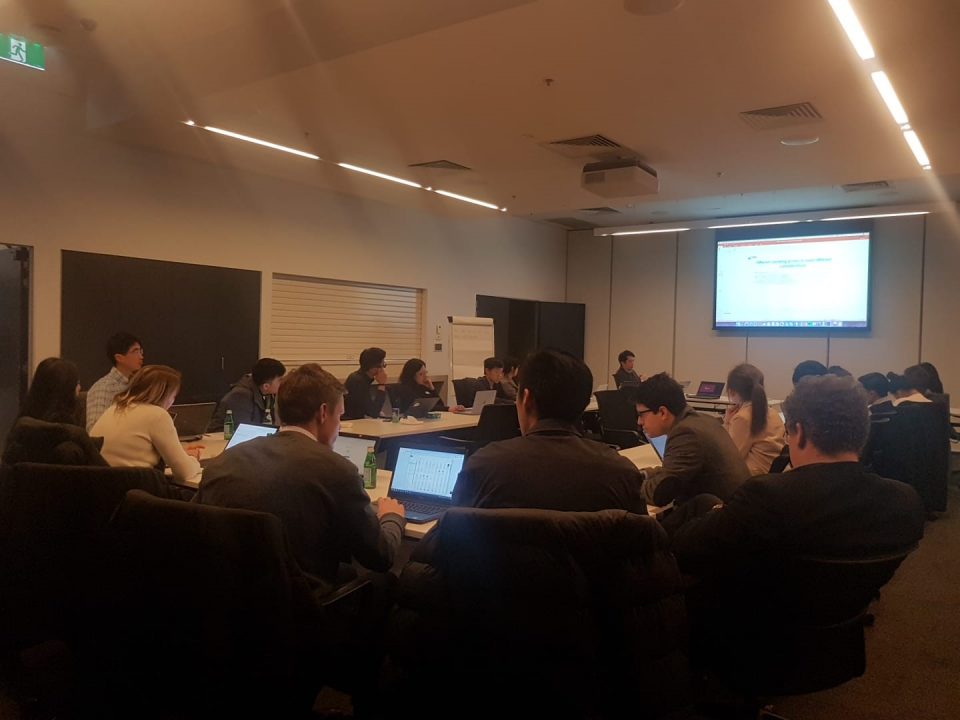
Over two sessions, YAP Melbourne hosted R Data Workshops tailored for members with beginner to intermediate levels of knowledge in programming and machine learning.
YAP Data Workshop Part 1: Introduction to R and Programming
The files used during the workshop can be found here.

The first workshop was hosted by Juan Ospina León, a secondary mathematics teacher with four years’ experience teaching in Melbourne. Juan began by providing an overview of data science basics, explaining the different types of variables, data structures and algorithms. This was followed by a beginners’ tutorial on using R and R Studio (a user interface for R), highlighting the many basic commands, packages and features offered by the program.
Providing several hands-on examples, Juan showcased the advantages of R over Microsoft Excel using side by side comparisons. A key takeaway from the event was the basic data manipulation functions available through the package dplyr (such as ‘mutate’, ‘filter and ‘select’), used to quickly and easily manipulate large volumes of data. A demonstration of ggplot (a package specialising in intuitive data visualisation) reinforced the ease, power and flexibility of R.
YAP Data Workshop Part 2: Industry Applications using R and Machine Learning
The files used during the workshop can be downloaded here. Note that you will need to have R installed to view the file.
The second workshop was hosted by Jacky Yang, an Associate Analyst at Quantium, who shared his experiences in the retail banking industry. This workshop built on the basics taught in the previous session and explored machine learning practices and techniques used in the industry.
Jacky began the session by outlining the techniques underlying model fitting, highlighting how often the majority of the time spent on a project involves preparing, checking and interrogating the data.
Jacky explained how splitting data into training, test and validation sets can combat the effects of overfitting and can properly assess model performance, and provided a comparison of the various methods of feature selection.
Jacky highlighted that time and cost constraints in industry often limit data quality and availability, and the ability to trial and compare different models, emphasising why ‘out of the box’ models (robust models that don’t require much modification or tuning for use) are so popular in the industry. Compared with academia, the trade-off is greater freedom to use a variety of alternate data sources.
Jacky demonstrated a common application in banking, using machine learning to rank a portfolio of consumers by their likelihood to purchase a term deposit. Jacky finished the presentation by showing how ‘predicted vs observed’ graphs and partial dependency plots are used by data analysts to quickly judge the appropriateness of a model.
There was significant interest from members, with both events at capacity prior to the sessions.
Thank you again to Juan Ospina Leon and Jacky Yang for their efforts in delivering such informative and insightful sessions!
CPD: Actuaries Institute Members can claim two CPD points for every hour of reading articles on Actuaries Digital.


