

Climate Change Blog – November 2018
Welcome to the fifth instalment of the Climate Change Blog, an article series that aims to cover news and events related to climate change and relevant to actuaries and the industries they advise.
This series is brought to you by the Institute’s Climate Change Working Group. This month’s edition showcases the Australian Actuaries Climate Index (AACI), recently launched by the Actuaries Institute.
What is the Australian Actuaries Climate Index?
The Actuaries Institute launched a climate index that tracks changes in the frequency of extreme high and low temperatures, heavy precipitation, consecutive dry days, strong wind and changes in sea level. These 6 components were chosen, typically at their 99th percentile, as they have the potential to impact people and the economy. It is different to the average measures that are commonly focused on.
The purpose of the index is to help businesses assess and report risks from climate change, such as inland and coastal flooding, cyclones, drought, and heat waves. It is designed to help inform actuaries, public policymakers, companies and the public about climate trends in Australia.
The AACI is based on historical data and does not forecast future changes in the frequency of extremes. However, as the regions of the AACI generally correspond to regions in the Climate Change in Australia projections for future climate by the BoM and CSIRO, the AACI historical data can be considered alongside relevant forward projections.
In the Climate Change plenary at the 2018 General Insurance Seminar, Tim Andrews from Finity Consulting introduced the AACI and explains how the index focuses more on extreme points of wind, temperature and rain rather than the mean, in order to help better assess risk.
Components of the index
There are 6 components in the index. These are based on measurements taken by the BoM from its network of meteorological and coastal tide stations. The data is compared to measurements over the 30-year reference period of 1981 and 2010, then summarised by meteorological seasons (3 months ending February, May, August and November). The key metric is a 5-year moving average.
The components and the reasons for measuring them are summarised in the table below.
| Component | Rationale | Measurement |
| High Temperature |
Has there been a warming in temperature on hot and cold days? |
Monthly frequency of maximum and minimum temperatures above the 99th percentile. |
| Low Temperature | Cold temperatures increasing is treated as a risk due to an extended pest and mosquito season, which bring diseases. | Monthly frequency of maximum and minimum temperatures above the 1st percentile. |
| Precipitation | Key driver of flood and storm damage. | Monthly frequency of 5-day consecutive rainfall above the 99th percentile. |
| Wind | Maximum wind gusts during storms and cyclones. The maximum likely leads to higher risk and damage. | Monthly frequency of daily wind gust above the 99th percentile. |
| Consecutive Dry Days | Indication of drought. | Annual maximum consecutive dry days. |
| Sea Level | Important risk factor for coastal inundation. | Monthly maximum sea level. |
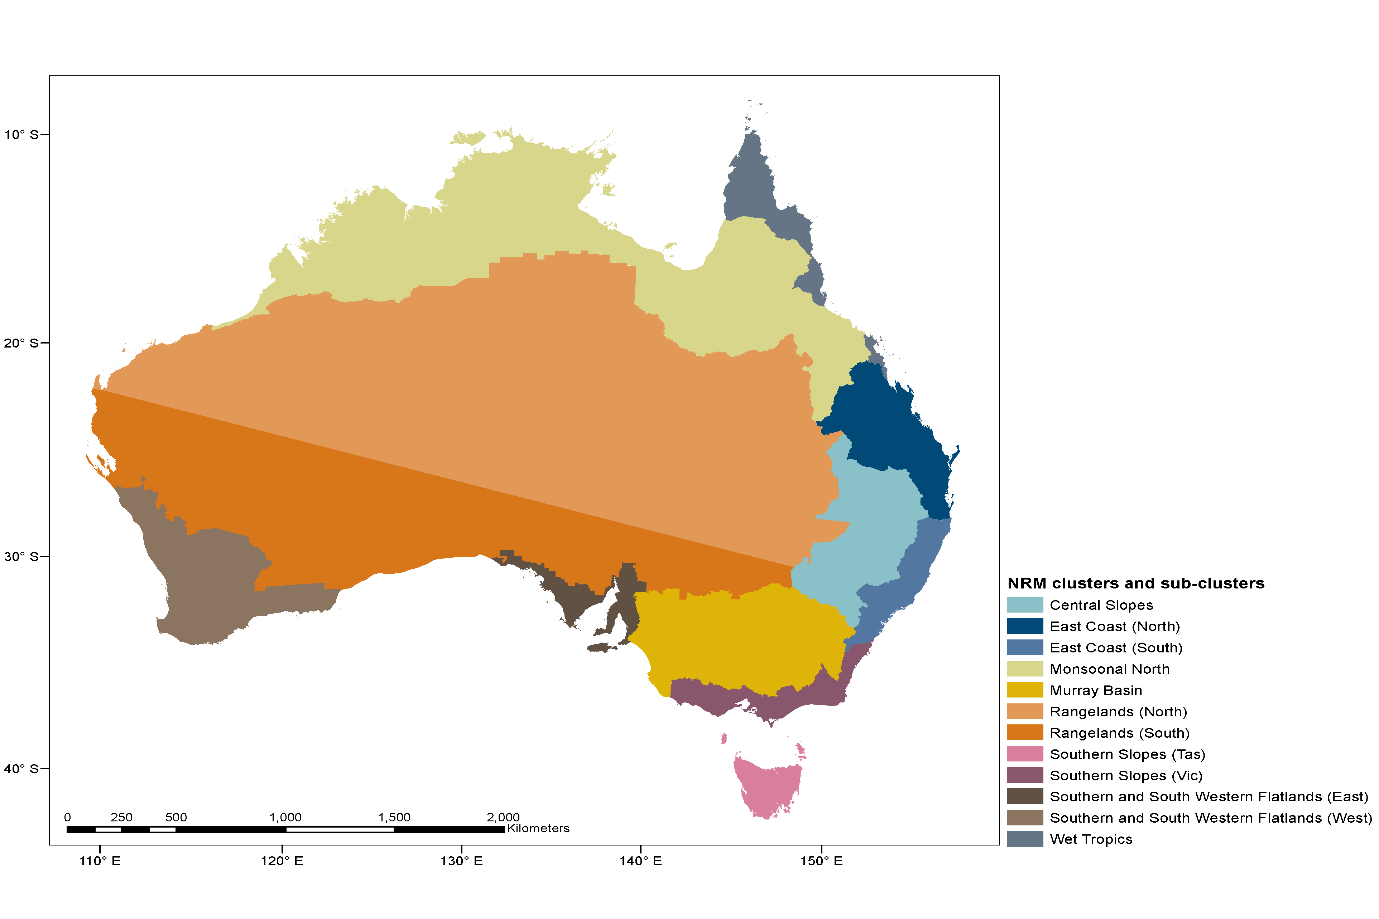
The index is available nationally across 12 regions that are climatologically consistent. These regions are based on CSIRO’s 15 sub-clusters used for the “Climate Change in Australia” data. Some clusters were grouped as there was insufficient data for them to be assessed in isolation. The picture below shows the 12 different regions.
The Design Documentation for the AACI provides more detail on purpose, calculation, data sources, and results.
Results
The index indicates increases relative to the reference period in the extremes of temperature and sea level. As such we expect that risks that are linked to higher temperatures and higher sea levels have increased. The wind level extremes appear broadly unchanged overall.
The chart below (taken from the presentation on the AACI by Tim Andrews at the 2018 General Insurance Seminar) shows an increase in the relevant climate extremes since 2010 relative to the reference period of 1981 to 2010. An index value of 0.5 means the frequency of the extreme observations has increased by half a standard deviation.
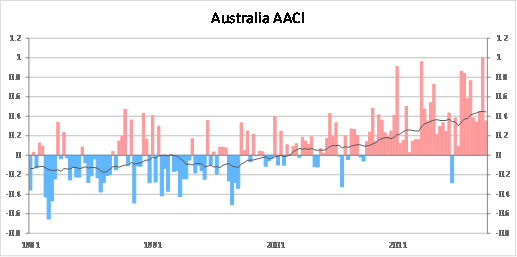
The headline measure in the chart above is a simple average of the three components – high temperature, rainfall and sea levels.

The other three components were excluded because:
- Wind data was not available back to 1981
- Drought measure (consecutive dry days) shows a strong inverse correlation with the rainfall measure
- Low temperature could lead to overweighting of temperature in the composite index, noting that high temperature is included.
Uses for the index
The AACI can be used to assist:
- business to meet reporting requirements of how climate risks are changing, such as the requirements on Australian financial institutions to adopt the Financial Stability Board’s Taskforce on Climate-Related Financial Disclosures;
- policy makers, business (including insurers) and individuals to understand if or how the risk of climate extremes is changing in specific geographic areas. Of note, because the link to risk is implicit rather than explicit, the AACI is not intended to be used to directly price risk (such as setting insurance premiums). For example, the risk of flooding will depend not only on the risk of heavy precipitation and how that might be changing over time at a range of return periods, including more extreme return periods than used for the AACI, but also on building design and local flood mitigation measures.
Tim Andrews talks about using the index to track risk factors with senior business correspondent Peter Ryan on the ABC News Radio.
Comparison to the North American index
A similar index (the ACI) has been constructed by the actuarial societies in North America to show the trend in climate extremes across North America. The American index tracks climate extremes typically at the 90th percentile instead and is measured over a longer earlier reference period. The FAQs contain more detail on the comparison between the two.
You can also read more about the American index on An Overview of the Actuaries Climate Index by David Hudson.
AACI in future
The AACI will be updated quarterly as data for each meteorological season becomes available.
The Actuaries Institute will look to attach risk data, e.g. property damage and health statistics, to understand the relationship between weather extremes and risk. This will enable companies to better understand the risk measures and how the risks are changing.
Would you like to know more?
In this podcast, Tim Andrews and Vanessa Beenders (Practice Excellence Adviser at the Actuaries Institute) met to discuss Tim’s involvement in the creation of the Australian Actuaries Climate Index and why it is helpful for businesses and actuaries to utilise the data.
Listen to “The Australian Actuaries Climate Index (AACI)” on Spreaker.
Other climate change articles published by members of the Climate Change Working Group:
- Climate Change Blog – October 2018 by Evelyn Yong
https://www.actuaries.digital/2018/10/31/climate-change-blog-october-2018/
- Climate Change Blog – September 2018 by David Hudson
https://www.actuaries.digital/2018/09/27/climate-change-blog-september-2018/
- Climate Change Blog – August 2018 by David Hudson
https://www.actuaries.digital/2018/08/29/climate-change-blog-august-2018/
- Climate Change Blog – July 2018 by Evelyn Yong
https://www.actuaries.digital/2018/07/20/climate-change-blog-july-2018/
- Climate Change Disclosure – Financial Institutions Feel the Heat by Sharanjit Paddam and Stephanie Wong
https://actuaries.asn.au/Library/Miscellaneous/2017/TheDialogue3ClimateRiskWEB.pdf
- Climate Related Financial Disclosures: The Way Forward? by Wayne Kenafacke.
https://www.actuaries.digital/2017/03/31/climate-related-financial-disclosures-the-way-forward/
- Climate Risk Management for Financial Institutions by Sharanjit Paddam, Stephanie Wong and Alison Drill
https://www.actuaries.digital/2017/01/31/climate-risk-management-for-financial-institutions/
- TCFD Webinar: Climate Leadership – How to Support the TCFD
https://www.fsb-tcfd.org/event/webinar-climate-leadership-support-tcfd/#
CPD: Actuaries Institute Members can claim two CPD points for every hour of reading articles on Actuaries Digital.


