Impact of COVID-19 on Mortality and Morbidity in 2020
This article is an edited extract of a Research Note published by the Actuaries Institute this week and is an extension to an earlier paper by the same name presented at the 2021 All-Actuaries Virtual Summit. The Research Note can be found here.
Our paper looks at a number of ways in which COVID-19 mortality has been measured around the world and in Australia. We then take a closer look at the impact of COVID-19 (including border closures and other non-pharmaceutical measures) on the mortality experience of Australia during 2020. And finally, we take a brief look at the impact of COVID-19 on long term illness, based on studies from the US, the UK and Denmark.
This extract concentrates on the mortality experience of doctor-certified deaths in Australia during 2020, noting that doctor-certified deaths make up around 85-90% of all deaths in Australia.
Doctor certified deaths in 2020
This graph shows doctor-certified deaths in 2020; our ‘predicted’ number of deaths (we fitted a series of multivariate linear regression models to each cause of death, after adjustment for demographic changes), and the 5th/95th percentile range.
We have broken the year into five periods, being before the pandemic hit, two periods that coincide with high COVID-19 case numbers and deaths (‘wave 1’ and ‘wave 2’), and two periods where COVID-19 cases were low.
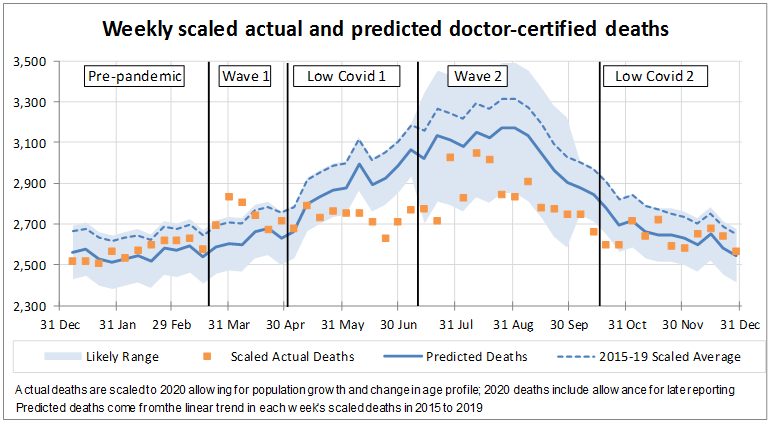
- not unexpectedly, deaths during pre-pandemic period were reasonably close to predicted;
- during the first wave, deaths were considerably higher than predicted;
- in the first low COVID-19 period, deaths were lower than expected because the usual winter respiratory deaths did not eventuate. Deaths throughout this period stayed at around 2,700 per week, as opposed to following their usual climb;
- during the second wave, for most weeks, deaths remained at about the 2,700 to 2,800 level, which is much lower than predicted, because of continued low respiratory deaths. But there were three weeks of higher deaths in late July/early August; and
- in the second low COVID-19 period, deaths were close to predicted. This is not because deaths increased, but rather because the benefit of reduced levels of respiratory disease was no longer available as Australia was past the usual winter hump.
Across the whole year, there were almost 4,000 less deaths than predicted – almost 3% lower. This was driven by lower numbers of respiratory deaths – both where respiratory disease is the primary cause of death and where it is a contributing factor.
Are higher deaths during the COVID-19 waves fully explained by COVID-19 deaths?
This chart shows the same information as above but excluding the 832 doctor-certified COVID-19 deaths included in the ABS data (these COVID-19 deaths are lower than the 909 officially recorded COVID-19 deaths as some deaths will have been reported to the coroner).
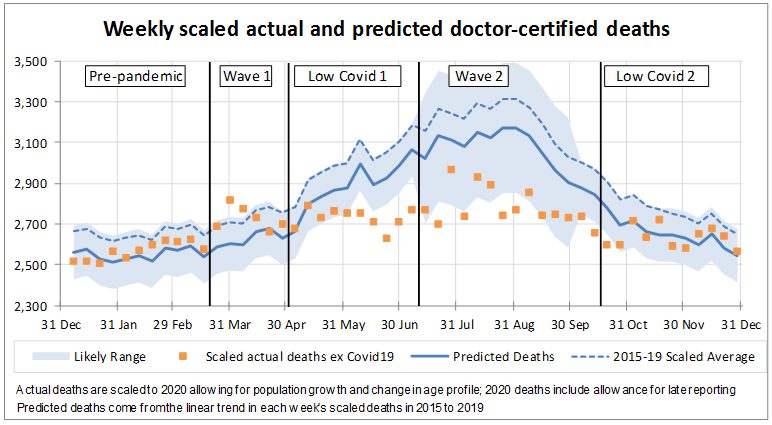
When we remove the COVID-19 deaths, we can still see the same features present in waves 1 and 2:
- deaths remain well above predicted in wave 1 – by around 600 deaths, or 4%, across that six-week period. They are also well above the 95th percentile two of those six weeks; and
- in wave 2, we still see those few weeks where deaths are higher than surrounding weeks – again by around 600 deaths.
For the first wave, while we can’t say for certain, we think that more people died of COVID-19 than was reported at the time. This is likely to be because testing was limited and so COVID-19 was not diagnosed. We think that there was also a genuine increase in deaths from some other causes, like stroke, where people have avoided seeking medical attention.
In the second wave, testing was more readily available, so we don’t think there were as many missed COVID-19 deaths. For the few higher weeks, we saw higher numbers of deaths in both Victoria and other states, so it was not isolated to areas experiencing high levels of COVID-19. We primarily believe these higher weeks are due to random fluctuation, although it is possible that there are a small number of deaths in Victoria that were from undiagnosed COVID-19, and also a genuine increase in stroke deaths in that state.
Respiratory deaths
These four charts are for pneumonia, influenza, lower respiratory disease, and all respiratory diseases combined (including ‘all other’ respiratory diseases, as well as the three specified diseases shown).
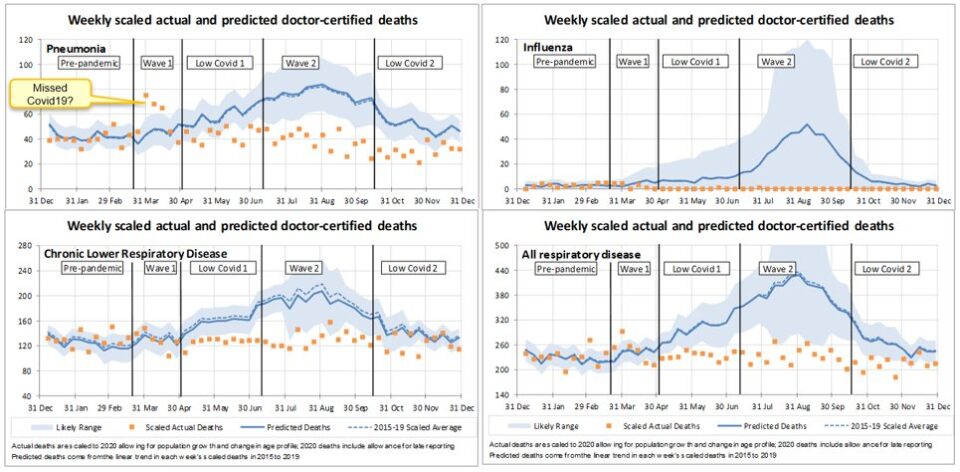
During the first wave, deaths from pneumonia were significantly higher than predicted and well above the 95th percentile. We understand that COVID-19 often presents as similar to pneumonia, and strongly suspect that some ‘pneumonia’ deaths during the first wave were undetected COVID-19 deaths.
Deaths from all respiratory diseases have been considerably lower than predicted since end-April, and virtually non-existent for flu, which will be due to measures put in place to control COVID-19.
Deaths potentially linked to COVID-19?
These four charts are for diabetes, cerebrovascular disease (stroke, brain hemorrhage, etc), dementia and ‘all other’ causes, being those not specifically reported on by the ABS. These causes of death are possibly related to COVID-19 in some way.
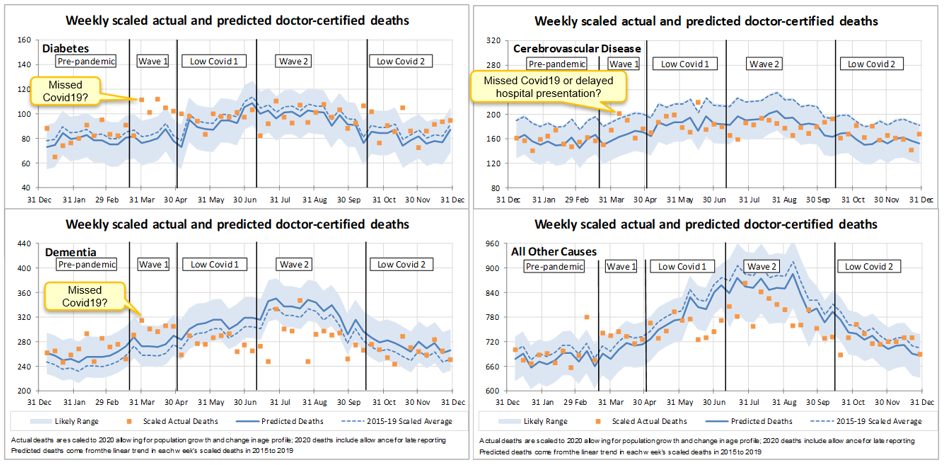
Diabetes is a known comorbidity of COVID-19. During the first wave, diabetes deaths were significantly higher than predicted and above the 95th percentile, again possibly indicating undiagnosed COVID-19 deaths. Since then, diabetes deaths have generally been close to expected.
Deaths from cerebrovascular disease, which includes stroke, were higher than predicted in the first wave, and above the 95th percentile for one of those weeks. Stroke is a known complication of COVID-19, and it is also a disease where time is of the essence. Brain scans for stroke fell significantly in March, possibly indicating people were not presenting to hospital with stroke as early as they normally would due to fears of visiting healthcare settings. We suspect these higher deaths are likely a combination of both undiagnosed COVID-19 and more genuine stroke deaths.
Deaths from dementia were significantly higher than predicted during the first wave, although only one week was above the 95th percentile. We are not as certain that COVID-19 deaths have been missed here, as many of these deaths would have taken place in nursing homes, where COVID-19 would have spread quickly and been detected. We think it more likely that our modelling does not predict dementia deaths as well as it predicts other causes. Deaths from dementia have since fallen below predicted numbers for almost all weeks, likely due to lower levels of respiratory illnesses.
Other doctor-certified deaths were also high during the first wave, but not greater than the 95th percentile. The evidence of undiagnosed COVID-19 here is not as clear cut, but like stroke, some of these deaths may be due to people avoiding health care settings. Since then, deaths from all other causes are generally lower than predicted, likely a flow-on impact of the low levels of respiratory disease.
Victorian deaths
We looked a little more closely at Victorian deaths in the second wave, with particular attention on the four specified diseases with possible links to COVID-19.
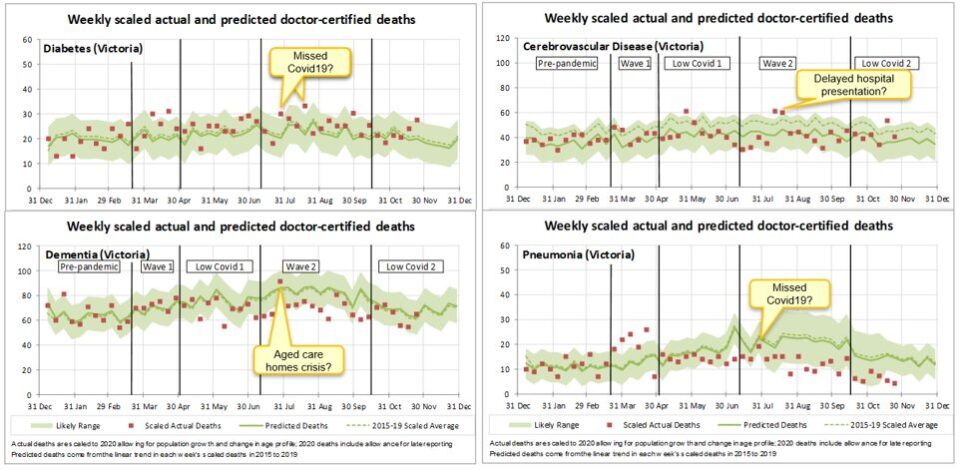
- there were two weeks where diabetes deaths were higher than predicted by around 7-10 deaths, possibly indicating a small number of undiagnosed COVID-19 deaths;
- there were around 20 more stroke deaths than predicted in each of the two high weeks in August, possibly due to hesitancy to attend health care settings;
- there was one week where dementia deaths were high, and we wonder if these 20 or so extra deaths may be related to the significant issues aged care homes were experiencing at that time; and
- there was a small increase in pneumonia deaths in the last week of July, again possibly undiagnosed COVID-19, however the number of deaths involved is very small – only five more deaths.
These higher numbers of deaths in Victoria in the second wave from COVID-19-linked causes are clearly quite small and do not fully account for the jump in deaths. Hence our conclusions that the small number of weeks with higher deaths during the second wave are primarily due to random fluctuation.
Summary of doctor-certified deaths
The following table compares the doctor-certified deaths in 2020 to our predicted values for each cause of death.
Year to 29 December 2020 – Actual vs Predicted
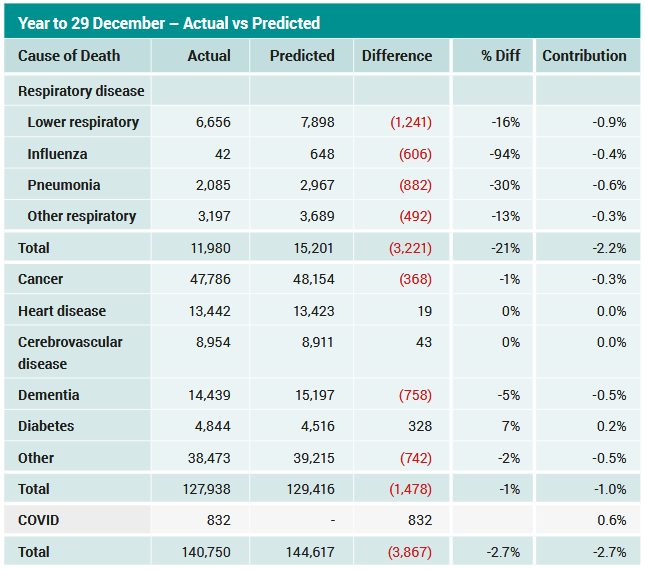
Overall, there were around 3,900 (2.7%) fewer deaths in 2020 than predicted.
This is driven by lower numbers of deaths from respiratory illness (around 3,200 less deaths than predicted). Higher than expected deaths from pneumonia at the end of March have been more than offset by the much lower numbers of all respiratory deaths since mid-April. While much of the press has focussed on lower levels of influenza deaths, these account for only around 20% of the reduction in respiratory deaths. Pneumonia causes more deaths than influenza, and chronic lower respiratory disease kills more than the other two combined.
Deaths from non-respiratory causes are also lower than predicted by around 1,500 deaths:
- deaths from cancer are a little lower than predicted;
- deaths from heart disease are the same as predicted, as are deaths from cerebrovascular disease (stroke, etc). For cerebrovascular disease, higher deaths than predicted across Australia in the first wave and in Victoria in the second wave were mostly offset by lower deaths from this cause in the rest of the year;
- deaths from diabetes are higher than expected, driven by higher than expected deaths in the first wave; and
- deaths from dementia and ‘other’ are lower than predicted. Higher than predicted numbers of deaths from these causes during the first wave were more than offset by lower than predicted deaths during the winter months as a result of lower levels of respiratory disease.
The lower numbers of deaths from usual causes more than offset the 832 unexpected deaths from COVID-19.
Not only has Australia managed to avoid high levels of deaths, but the measures taken to reduce the spread of COVID-19 have also resulted in lower overall numbers of deaths. This is in sharp contrast to the experience of many other countries where the impact of COVID-19 on mortality has been higher than reported COVID-19 deaths. Further, a significant number of those who contract COVID-19 stay ill with a wide variety of long-term symptoms including organ damage, neurological and psychiatric issues. The long-term morbidity implications for countries which have had significant outbreaks are likely to be material.
Download the PaperRead the Media Release |
CPD: Actuaries Institute Members can claim two CPD points for every hour of reading articles on Actuaries Digital.