How the pandemic is affecting household income
Where are Australians most financially vulnerable to the effects of COVID-19, where are they most stable and who will have the longest road to recovery? Analytics and actuarial consultancy Taylor Fry reveals important insights from its Financial Impact Index, as the country slowly begins to rebuild its future.
With more than 11 million confirmed cases worldwide and half-a-million deaths at the time of writing, COVID-19 has sent shockwaves across the globe. While Australia seems to have avoided the spiralling chaos seen in some countries, the outbreak and necessary preventative measures have taken a huge toll – including the effect on our economy and the financial wellbeing of millions of Australians.
To gain some understanding of how COVID-19 is affecting households, Taylor Fry has developed the COVID-19 Financial Impact Index, which identifies the areas, by local postcode, where people are financially hurting the most from the COVID-19 pandemic. The index helps organisations get a better idea of how they need to tailor their activities in this challenging environment, be it marketing, financial relief, or customer experience. The index can also be combined with organisations’ customer or client data to drill down further into the impacts of COVID-19 on individuals’ financial situation.
How does it work?
The Taylor Fry COVID-19 Financial Impact Index takes the latest employment data from the Australian Bureau of Statistics, focusing on unemployment and underemployment, and combines it with the most recent census of the Australian population to identify the relative financial impact of COVID-19 by postcode. The measurement of financial impact reflects the effects of government initiatives, consumer sentiment and business confidence on employment and wages.
The interactive map, found here, allows users to explore by postcode the financial impact of the pandemic, ranking postcodes by level of distress, and allowing users to drill down into the main causes of distress. The map is updated monthly in line with the latest release of employment data, enabling tracking of government efforts and the identification of suburbs that are financially stable as well as those that may continue to decline or have a longer road to recovery.
Looking deeper
While regulations for social distancing and travel have no doubt helped slow the spread of COVID-19, they have come at the cost of more than 800,000 Australian jobs, and the reduction in working hours for many more. With restrictions implemented at state level, a return to normality is not straightforward and the economic impact of COVID-19 differs significantly by region across Australia. Varying dates have been set or are still being considered for easing restrictions (or increasing them, in the case of Victoria). On top of this is the severity of the impact these restrictions have had and continue to have on different industries, with some effectively shutting down as a result.
Where JobKeeper fits in
Another factor to consider is the landmark stimulus package implemented by the Australian Federal Government. About 3.5 million Australians have had a portion of their lost income replaced via JobKeeper payments and, in some cases, individuals are receiving more than their pre-pandemic earnings. Nonetheless, the net reduction in wages for the majority of recipients, as well as the uncertainty of JobKeeper payments and eligibility criteria moving forward, has left most consumers with some level of financial distress, particularly those with limited savings.
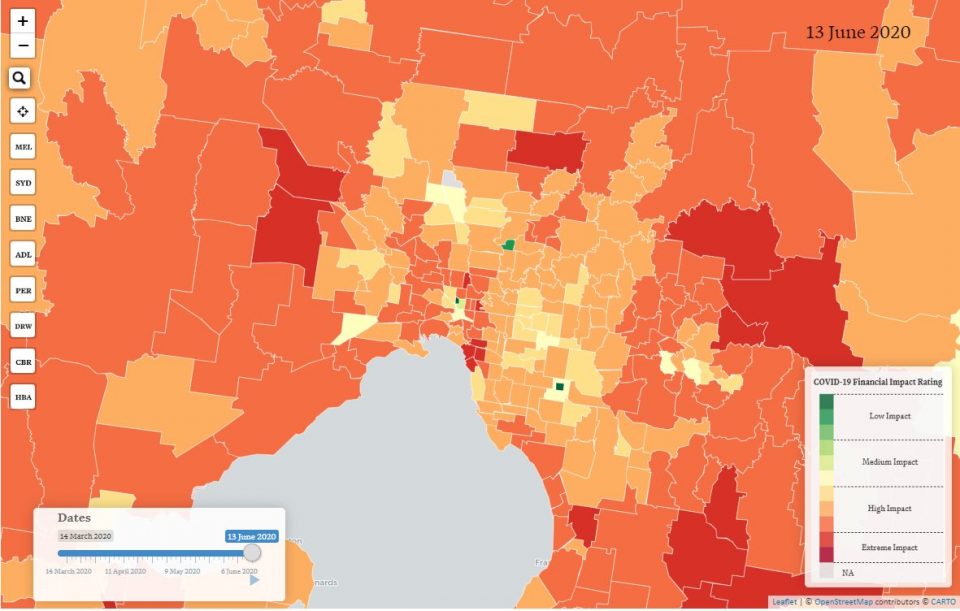
What does it mean for our big cities? How is Melbourne faring?
Taylor Fry’s index shows Victoria continues to lead Australia in daily confirmed cases of COVID-19, which has led to increased restrictions and a greater financial impact compared to the rest of Australia. Suburbs such as Rockbank and Sunbury to the west, Brunswick and South Morang to the north and Officer and Cranbourne to the east, are feeling the financial impact of COVID-19 more than most. Outer Melbourne suburbs such as these tend to contain young, middle-income families living in newer estates, with individuals in these income brackets experiencing not only a net reduction in income but also less retained earnings to draw upon in times of need. People in these suburbs are also more likely to be employed in industries such as retail, transport and hospitality, which are some of the hardest hit by social distancing rules.
The fashionable suburbs of St Kilda, Abbotsford, Prahran and Richmond have also been heavily impacted by regulations, with residents more likely to work in cafés and restaurants or in the professional services industry. Unfortunately, with increasing lockdown laws introduced over the past few days, the financial consequences of COVID-19 are likely to last longer for Victorians than the rest of Australia.
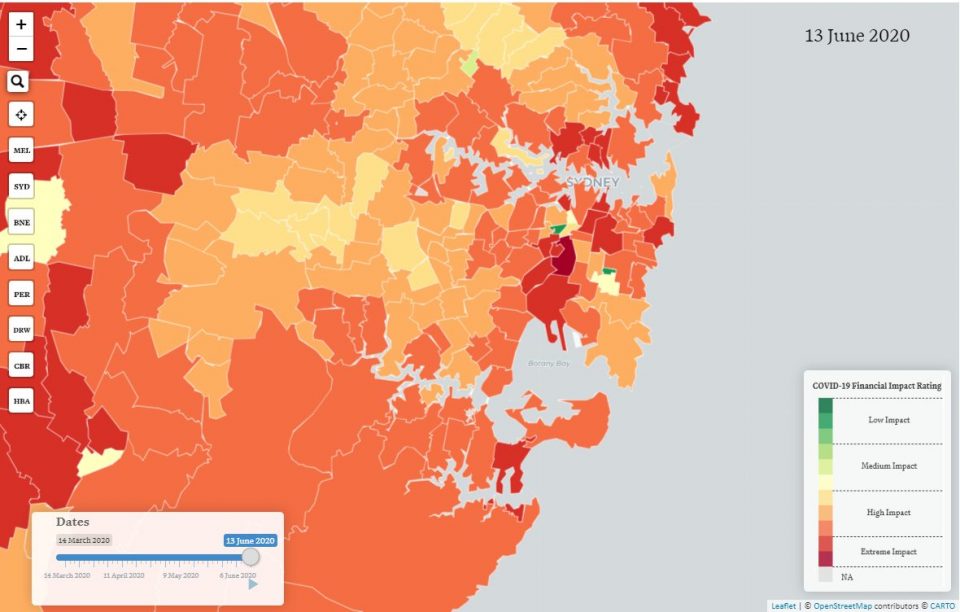
What’s the outlook for Sydney?
In New South Wales, similar patterns are present, with suburbs such as Erskineville, Newtown and Neutral Bay feeling the financial impacts of the pandemic more than most, due to the number of residents working in professional services. In addition, the rural agriculture and farming suburbs of Nevertire, Moree Redion and Gundagai, as well as tourist destinations such as Jindabyne and Lord Howe Island are among those most affected by the lockdown and travel restrictions.
Focusing on metropolitan regions, the population in Sydney’s western suburbs tend to be less affected than neighbouring areas. These suburbs have a higher proportion of residents who were already unemployed or retired pre-COVID, and a larger relative share of low-income earners for whom the current government subsidies replace a greater proportion of or exceed any lost income.
From this point, the index will track the financial impact over time and provide insight into how the different levels of easing restrictions adopted by each state will influence the speed of financial recovery of each suburb.
CPD: Actuaries Institute Members can claim two CPD points for every hour of reading articles on Actuaries Digital.