Impact of bushfires on the life insurance industry
Following one of the most severe bushfire seasons, Rhoda Harrington assesses other impacts on the life insurance industry such as respiratory disorders and mental illness.
During the bushfire season, the media tends to focus on the devastating impacts on local communities and the loss of life and property. For life insurers considering the impact on their risk pools, loss of life from bushfires isn’t significant compared to the number of deaths from sickness and other accidents, with about 800 deaths from bushfires since 18511, an average of five deaths per year.
What is often forgotten however are the indirect impacts of bushfires. Only recently have we started to consider how the persistent smoke in urban areas is affecting our health and we cannot ignore how these natural disasters impact the mental health of survivors and emergency services workers.
We have explored what these indirect impacts could mean for the life insurance industry and our conclusion is that although the 2019-2020 bushfire season has been alarming, the impact on insured mortality and morbidity experience, now and with continued climate changes, is not expected to be material.
Air Pollution
Ambient air pollution is a major cause of death and disease globally, with the World Health Organization ranking it the 5th risk factor in mortality and 6th in DALYs (disability-adjusted life years) in 20152. Worldwide it makes a significant contribution to respiratory and circulatory deaths and disease.
Air quality is measured by many components but the hazardous ones connected with bushfires are the levels of PM2.5 and PM10, averaged over a rolling 24-hour period. PM2.5 poses the greatest problems because they bypass the body’s natural defences and can get deep into the lungs and potentially the bloodstream. Exposure to such particles can exacerbate respiratory and cardiovascular conditions.
PM2.5 levels between 1990 and 2017 in Australia, UK, USA, India and China. Australia’s level was 9 μg/m3 in 2017, while India, who is ranked 4th in the world for air pollution, had levels at just over 90 μg/m3 3
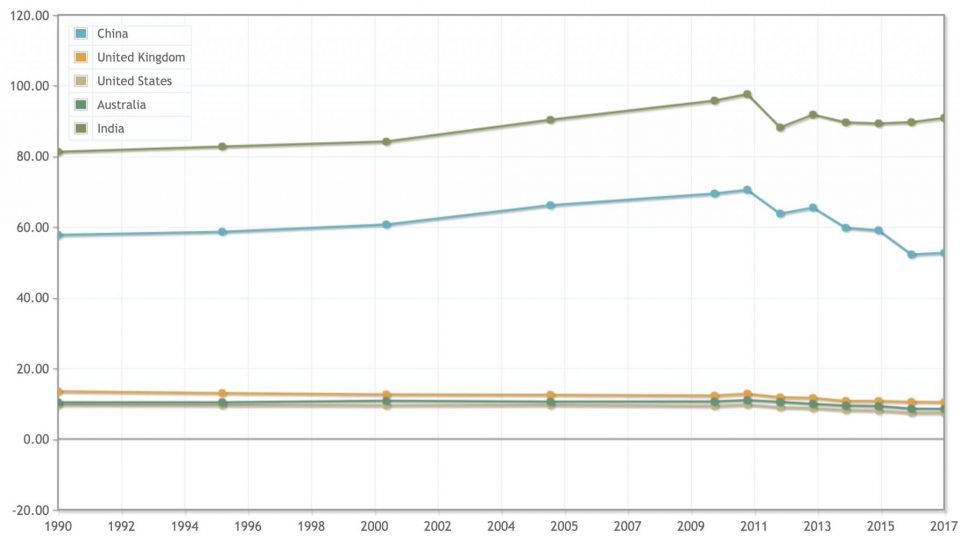
In Australia, air pollution has not typically been a concern as the air quality Index (AQI) is normally good, with average annual PM2.5 levels around 9 μg/m3. However, during the recent bushfires, most urban areas experienced PM2.5 levels exceeding 100 μg/m3, sending the AQI into the hazardous range4.
There are various studies on the impact of bushfire smoke pollution on hospital admissions and, although the results within every study aren’t always credible, there is a general increase in respiratory and circulatory admissions during bushfires.
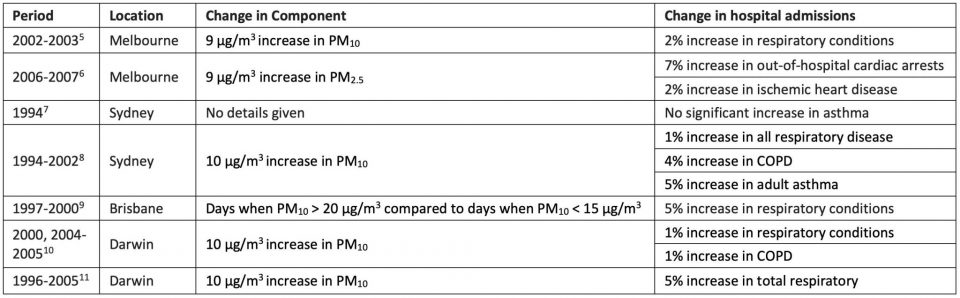
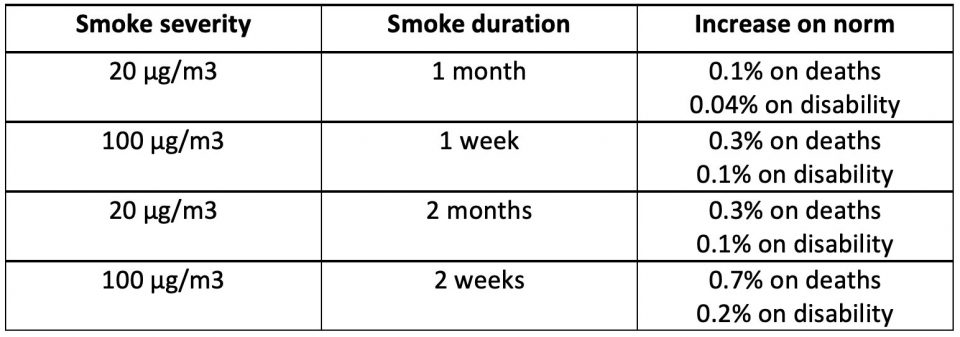
The link between hospital admissions and life insurance claims is unclear as not all admitted patients will be insured (respiratory disorders are more prevalent in the elderly than other ages) or would fulfil insurance definitions. However, the increases in admissions can provide us with an upper bound of the impact of bushfire smoke pollution on claims. In Australia, respiratory and circulatory disorders account for around 35%12 of deaths and 10%13 of the total years lost due to disability (YLD). If air pollution increased to 20 μg/m3 across Australia, increasing respiratory and circulatory admissions by 5% for say a month during the bushfire season then at most total deaths in the year would increase by 0.1% and total disability by 0.04%. If air pollution exceeded 100 μg/m3 and the increase in admissions increased linearly (unlikely, as we would expect the increase to taper) to 50% for say a week then total deaths would increase by 0.3% and total disability by 0.1%
Life insurers not only need to consider impacts in the present but what this means in the future as a result of climate change. Most studies looking at the impact of climate change on bushfires project the days which the Forest Fire Danger Index (FFDI) is 25 or more, so the increase in high risk days provides us with a proxy to the increase in air polluted days. Days of FFDI of 25 or more is estimated to increase by less than 10% with a low global warming estimate and 20-50% with a high estimate, between 2020 and 205014,15.
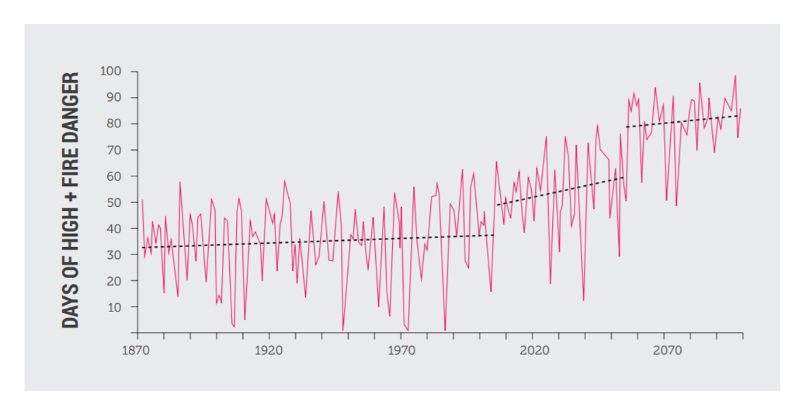
The spring of 2019 wasn’t normal, with 95% of Australia having a FFDI far above average and some parts of Australia seeing the number of FFDI >= 25 days doubling16. If we took a conservative view, with 2019 being the new norm, and assumed that the number of air polluted days doubles due to climate change, then at most we expect total deaths to increase by 0.3% and total disability by 0.1% under the 20 μg/m3 scenario and 0.7% for death and 0.2% for disability under the 100 μg/m3 scenario.
Mental Illness
Individuals affected by bushfires, or any natural or man-made disaster, are at risk of long-term mental illness, including anxiety, depression, substance abuse and PTSD, and often suffering two or more mental comorbidities.
In a survey conducted one year after the Ash Wednesday bushfires of 1983 in South Australia, 42% of respondents were defined as potential psychiatric cases, reducing to 23% 20 months after the fires17.
Epidemiological studies indicate 20-29% of victims are likely to have a mental disorder over a 6-month period after the incident, and self-assessments studies also show 16%-31% would be considered cases17. PTSD is the most common mental illness following a disaster and literature estimates the prevalence of PTSD at 30-40% among direct victims of disasters, 10-20% among rescue workers and 5-10% in the general population18.
As many bushfire firefighters in Australian are volunteers it’s worth mentioning that studies indicate that they experience higher level of mental illness than professional firefighters, due to factors such as knowing the victims and sometimes a lack of post-disaster support19.
The number of individuals affected by bushfires is unclear, as records typically only document the loss of homes, lives and hectares. Between 2010-2020 there was an average of 400 homes lost due to bushfires (c2,700 in 2019-2020 bushfire seasons)20. If we assumed that there were 2 adult lives in each home and they had a 40% chance of a mental illness, then on average we would expect 300 adults with mental illness from bushfires every year. In 2018, there were 20 million people in Australia aged over 15 years old21, so the proportion of the population impacted by mental illness due to bushfires could be considered immaterial. Even if the 2019-2020 fire season was to become the new norm due to climate change, then based on the same assumptions we might expect that 1,300 people per year. to be affected by mental illness after a bushfire, which again is a small number compared to the population and not all of those affected would be insurance claims.
Across the whole life insurance industry, we would therefore expect a small overall impact. However, this may not be spread evenly, for example for funds with a higher weighting of emergency service workers or geographically concentrated in higher risk areas, this impact may be more material.
In conclusion, although the impacts from bushfires on respiratory, circulatory and mental disorders aren’t expected to be material at an aggregate level, life insurers should be mindful of their exposure to communities affected by bushfires. By its nature, these bushfires are exactly the reason that life insurance exists and perhaps this provides an opportunity for the industry to remind policyholders that the community is pooling this risk for the benefit of those affected.
References
-
Cohen A.J. et al. Estimates and 25-year trends of the global burden of disease attributable to ambient air pollution: an analysis of data from the Global Burden of Diseases Study 2015. The Lancet Volume 389, Issue 10082, P1907-1918, May 13, 2017
-
Yu P et al. Bushfires in Australia: a serious health emergency under climate change. The Lancet Volume 4, Issue 1, PE7-E8, January 01, 2020
-
Tham R, Erbas B, Akram Met al. The impact of smoke on respiratory hospital outcomes during the 2002–2003 bushfire season, Victoria, Australia. Respirology2009; 14: 69–75
-
Haikarwal A. Impact of Fine Particulate Matter (PM2.5) Exposure During Wildfires on Cardiovascular Health Outcomes. 2015. Journal of the American Heart Association 4(7)
-
Cooper CW, Mira M, Danforth Met al. Acute exacerbations of asthma and bushfires. Lancet1994; 343 (8911): 1509
-
Morgan G et al. Effects of Bushfire Smoke on Daily Mortality and Hospital Admissions in Sydney, Australia. 2010. Epidemiology 21(1):47-55
-
Chen L, Mengersen K, Tong S. Spatiotemporal relationship between particle air pollution and respiratory emergency hospital admissions in Brisbane, Australia. Sci Total Environ2007; 373: 57–67
-
Johnston FH, Bailie RS, Pilotto LSet al. Ambient biomass smoke and cardio‐respiratory hospital admissions in Darwin, Australia. BMC Public Health2007; 7: 240
-
Hanigan IC, Johnston FH, Morgan GG. Vegetation fire smoke, indigenous status and cardio‐respiratory hospital admissions in Darwin, Australia, 1996–2005: a time‐series study. Environ. Health2008; 7: 42
-
Australian Bureau of Statistics. 3303.0 Causes of Death, Australia, 2018
-
World Health Organization. Disease Burden 2000-2016. By Country. YLD estimates, 2000-2016
-
Lucas C, Hennessy K, Mills G and Bathols J. Bushfire Weather in Southeast Australia: Recent Trends and Projected Climate Change Impacts
-
Jones RN et al. Valuing adaption under rapid change. ISBN: 978-1-925039-27-6
-
Bureau of Meteorology. Special Climate Statement 72 – dangerous bushfire weather in spring 2019. 18 December 2019
-
McFarlane AC, Clayer JR, Bookless CL. Psychiatric morbidity following a natural disaster: an Australian bushfire. Social Psychiatry and Psychiatric Epidemiology 32, 261-268(1997)
-
Goldmann E, Galea S. Mental Health Consequences of Disasters. Annual Review of Public Health Vol. 35:169-183
-
Thormar SB, Gersona BP, Juen B, Marschang A, Djakababa MN, Olff M. The mental health impact of volunteering in a disaster: a review. J Nerv Ment Dis. 2010 Aug;198(8):529-38
-
Australian Bureau of Statistics. 3235.0 – Regional Population by Age and Sex, Australia, 2018
CPD: Actuaries Institute Members can claim two CPD points for every hour of reading articles on Actuaries Digital.