Data quality – the key for reinsurance protection
The cost of reinsurance can be a significant part of an insurer’s expenses, particularly in the current hardening market.
One way for insurers to get on the front foot with reinsurance is to improve data quality. Reinsurers tend to penalise insurers for poor data quality, and in extreme cases, could refuse coverage. The last thing an insurer would want is additional charges or refusal of coverage due to poor data quality. (We have discussed other actions insurers can take in a hardening reinsurance market in detail in this article).
This article explains data typically required by reinsurers in general insurance and how data quality can be improved.
Data requirements
Typically data requirements for reinsurance are presented by grouping data on individual policies/risks. The following is a list of key data requirements and a brief explanation of each item.
- Risk and loss profiles: Group policies/risks insured together with associated claims by their sum insured values into different pre-defined levels (generally called sum insured bands).
- Large losses and catastrophe event losses: A list of historical Individual large claims above a threshold and historical claims from affected policies by catastrophe events.
- Historical experience of reinsurance coverage: Typically known as treaty statistics or treaty results generally capture historical premiums ceded to reinsurers, commissions given by reinsurers and claim recoveries from reinsurers.
- Catastrophe exposure aggregates: Sum insured values of policies applicable to coverage for catastrophe event losses.
- Revised and projected premium income: Revisions to premium income applicable to historical reinsurance coverage periods and estimated premiums applicable to the new coverage period.
The following section describes these data requirements in detail and how data quality can be improved.
Risk and loss profiles
Generally, classes of business risk profiles are set up by the underwriting period, in which all policies incepting within a specified period are captured. The example given in Table 1 explains risk and loss profiles in detail.
Table 1: A sample risk and loss profile with reinsurance arrangements
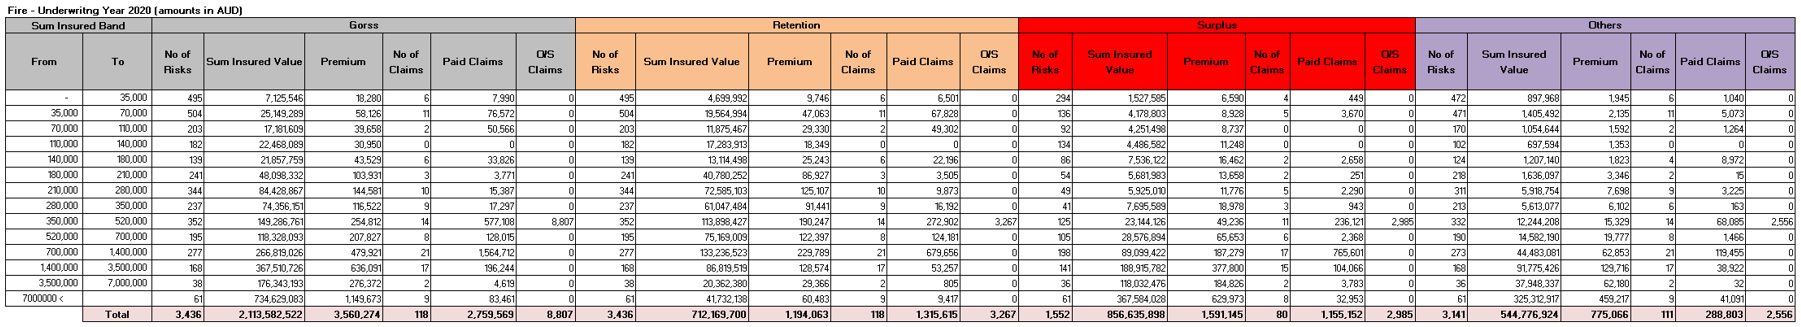
Sum insured bands – Set up predefined levels of sum insured values into which policies/risks are grouped. There is a starting value and an ending value for each level. It is recommended to have a reasonable number of sum insured bands to provide enough details about a class of business.
In the example above, the risk and loss profile is divided into four sections:
- Gross
- Retention
- Surplus[1]
- Others.
Each section has more details:
- Number of risks
- Sum insured value
- Premium
- Number of claims
- Outstanding and paid claims.
Gross section captures the sum insured values, premiums and claims gross of reinsurance arrangements. For example, in the first sum insured band ( $0-$35,000) there are 495 risks with gross sum insured values below $35,000. The total gross sum insured value of these risks is $7.125 million and the total gross premium is $18,280. There are six claims from risks in this sum insured band with a total paid gross claim amount of $7,990 and there are no outstanding claims.
The surplus section shows that there is a surplus reinsurance arrangement. It is important to show this section for reinsurers who are at risk for this surplus reinsurance arrangement for their analysis.
For example, taking the same sum insured band above, out of 495 risks, 295 have been ceded into the surplus reinsurance arrangement with an applicable total sum insured value of $1.528 million and a total ceded premium of $6,590 to reinsurers. Four claims are recoverable, and the total recovered amount is $449. If there are surplus and quota share proportional reinsurance arrangements it is recommended to show them separately.
Similar to the surplus section, others capture different reinsurance arrangements that could include facultative[2] reinsurance, a compulsory session with a national reinsurer in the jurisdiction or other arrangements. Some risk and loss profiles may show such arrangements separately.
The retention section captures what has been retained by the insurer after surplus and other reinsurance arrangements but gross of non-proportional reinsurance arrangements. For example, taking the same sum insured band above, the retained total sum insured value of 495 risks is $4.7 million and the retained total premium is $9,746. The insurer’s share of paid claims is $6,501. Typically risk profiles don’t show non-proportional reinsurance arrangements as the applicable reinsurance premium is a percentage of the total retained premium and retained premium can be from risks in more than one risk profile.
In the above example, claims appear alongside sum insured values. Alternatively, loss profiles can be set up by claim sizes into loss bands with reinsurance arrangements similar to risk profiles. One disadvantage of arranging loss profiles in this manner is that it is nearly impossible to know which sum insured bands these claims belong to concealing a valuable insight.
Risk and loss profiles can provide valuable insights. For example, they can provide insights into risk distribution by sum insured values (e.g. whether an insurer has a preference to write risks with small or large sum insured values), primary rate changes (i.e. given by the ratio premium/sum insured value) and the capacity utilisation of Surplus reinsurance arrangements (i.e. how many risks are within the Surplus capacity[3]). Ideally, insurers should provide risk and loss profiles for 3 to 5 historical years.
Large losses and catastrophe event losses
Reinsurers would require historical individual large claims above a certain threshold for their analysis and pricing. For example, for a non-proportional reinsurance arrangement, the threshold can be 50% of the deductible whereas for a proportional reinsurance arrangement a cash call, in which large claims above a predefined value are notified, can be the threshold. For non-proportional reinsurance arrangements, it is important to provide individual claims below the deductible as historical claims are adjusted for inflation, some of these claims can exceed the deductible making them recoverable as-if basis. For proportional reinsurance arrangements, large claims are important to determine large loss ratios.
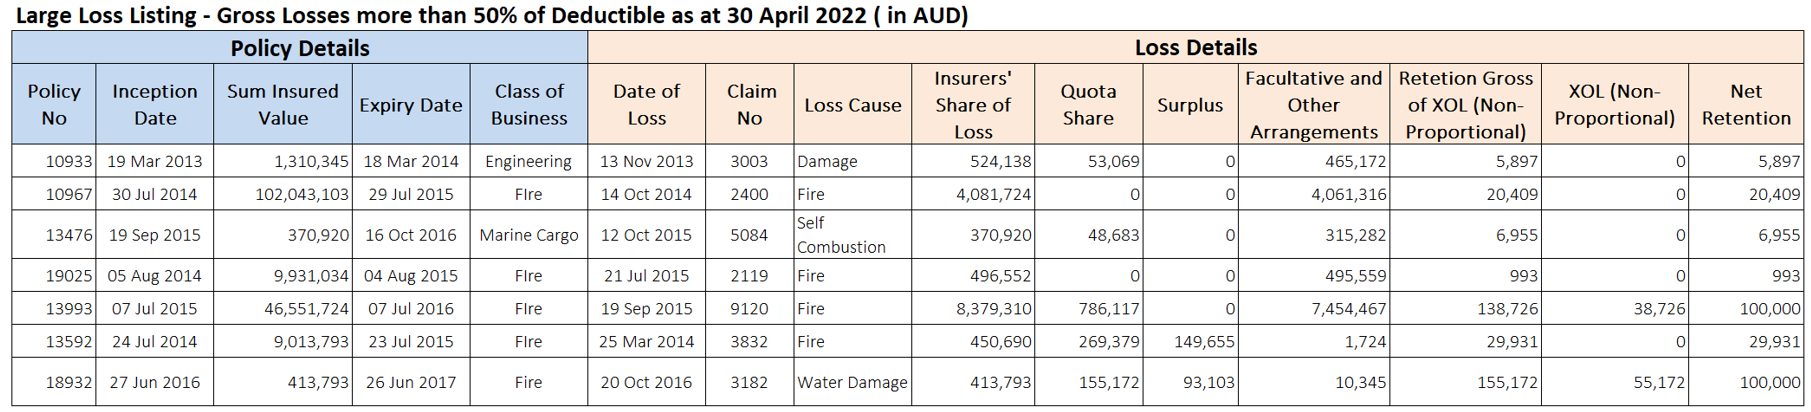
Table 2 shows an example of a large loss listing with individual losses above 50% of the deductible of a non-proportional reinsurance arrangement. It captures the details of policies having large losses and their large loss details. The policy details include policy number, inception date, sum insured value and class of business.
Loss details include the date of loss, claim number, loss cause, total claim amount from the insurer, claim amounts recovered from Quota Share[4], Surplus, Facultative/other and Non-Proportional reinsurance arrangements, and what’s being retained by the insurer.
For example, policy number 13993 in the chart below has a large claim of $8,379,310 for the insurer. The insurer has recovered $786,117 from a Quota Share, $7,454,467 from a Facultative/Other and $38,726 from a Non-Proportional reinsurance arrangement. After recoveries from reinsurance arrangements, the insurer’s share of the claim is $100,000 (i.e. Net Retention).
Table 2: A sample large loss listing
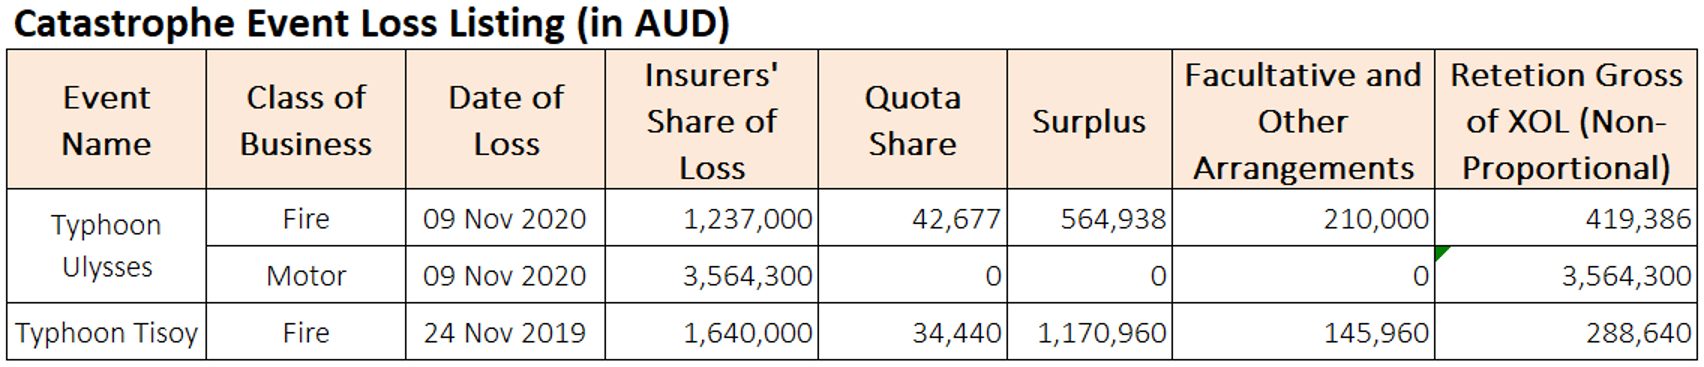
For catastrophe event claims, typically associated individual claims from many affected policies are grouped and recovered as an event claim. Details should capture event loss date (or a period), a number of policies affected, event name and type, paid and outstanding claims with breakdown by reinsurance arrangements. However, some insurers may provide catastrophe event losses at a more granular level by listing individual claims associated with a catastrophe event.
In the example given in Table 3, losses from two catastrophe events are captured. Fire and Motor classes of business suffered losses from Typhoon Ulysses. For fire, there are recoveries of $42,677 from Quota Share, $564,938 from Surplus and $210,000 from facultative/Other reinsurance arrangements. The insurer’s retention gross of any Non-Proportional reinsurance arrangements is $419,386.
Table 3: A sample catastrophe event loss listing
Ideally, insurers should provide losses for at least 5 to 10 historical years.
For long-tail classes, it is important to provide loss development triangles for individual large claims as reinsurers can use them to determine IBNR for large claim frequency and IBNER for large claim severity with their analysis.
Historical Experience of Reinsurance Coverage
The historical experience of reinsurance coverage typically known as treaty statistics or treaty results is very important to reinsurers for their analysis and pricing.
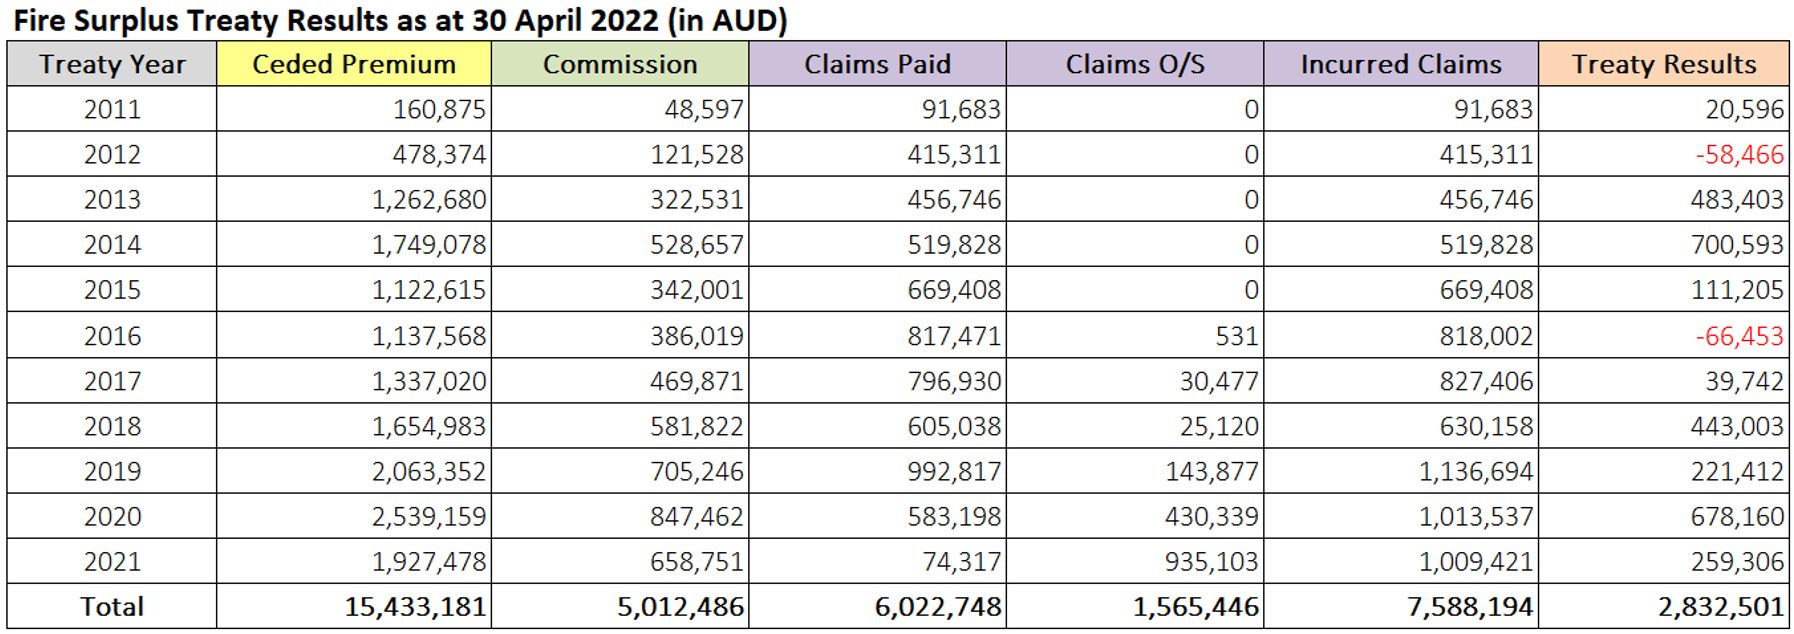
Table 4 shows treaty statistics for a Surplus reinsurance arrangement. It captures, coverage year (Treaty year), premium ceded to Surplus, the commission received from reinsurers and recoveries from reinsurers with breakdown by outstanding and paid amounts. The last column Treaty Results shows final results from reinsurers’ perspective (i.e. ceded premium – commission – incurred claims). For example, in 2011, the insurer ceded a premium of $160,865 to Surplus and received a commission of $48,597 from reinsurers. Recoveries from Surplus were $91,683.
Table 4: A sample treaty statistics of a runoff surplus reinsurance arrangement
For non-proportional reinsurance arrangements, treaty statistics typically capture premium income applicable (generally known as Gross Net Premium Income – GNPI[5]), chargeable rates on GNPI, reinsurance premium amounts, adjustments to reinsurance premiums, loss recoveries and reinstatement premiums if applicable. Table 5 shows treaty results for three historical years for a non-proportional reinsurance arrangement. The reinsurance arrangement has three layers.
In 2019, the initial Estimated GNPI is $7.563 million. The rate applicable (i.e. Adjustable Rate) on GNPI for the first layer is 3.67%, with which the estimated reinsurance premium for the layer can be determined (i.e. estimated reinsurance premium = 3.67% x $7.563 million = $277,562). Reinsurers charge a minimum deposit reinsurance premium of $222,050 on the estimated reinsurance premium. Subsequently, the Actual GNPI is $7.823 million, which is higher than the initial Estimated GNPI. Therefore, the insurer has to pay an additional reinsurance premium of $65,070 (i.e. Premium Adjustments) to reinsurers.
Table 5: A sample treaty statistics of a non-proportional reinsurance coverage
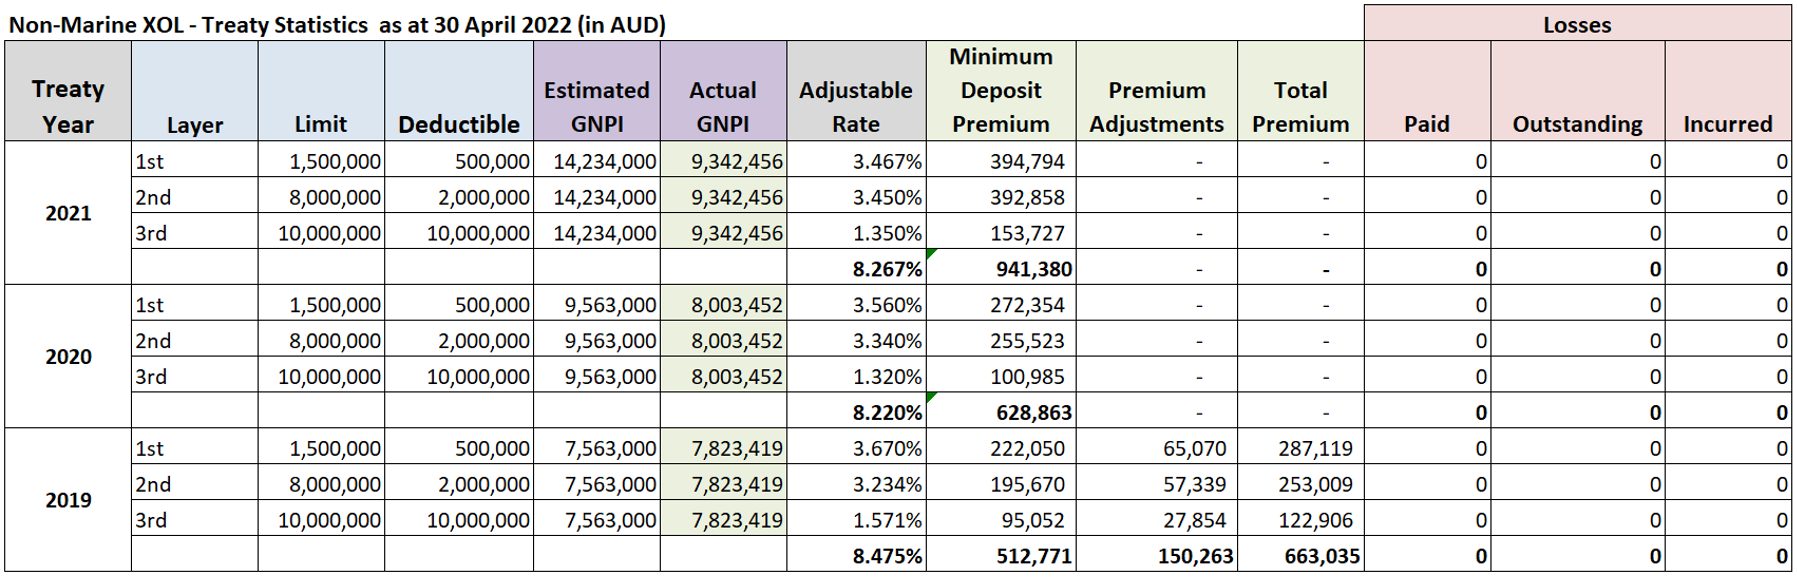
If the revised/actual GNPI is substantially lower than the initial estimate, insurers may end up paying a higher reinsurance premium for the coverage as the minimum deposit premium may in fact be higher than the reinsurance premium that could have been charged reflecting the change in GNPI.
Sometimes this can be witnessed with insurers setting ambitious growth targets but subsequently underachieving estimates. In the example above, in 2020 and 2021, the Actual GNPI is lower than the initial Estimated GNPI. This resulted in insurers paying a higher minimum deposit premium than what should have been paid based on actual GNPI.
It is important to ensure that particularly for proportional reinsurance arrangements, premiums and losses from treaty statistics are reasonably well reflected in risk and loss profiles. Reinsurers would generally check treaty statistics against risk and loss profiles and may raise concerns about significant discrepancies.
It is also important to ensure that historical large and catastrophe event claims recovered from reinsurance coverages are properly captured in historical large claims and catastrophe event claim listings discussed earlier. For proportional reinsurance arrangements, treaty statistics should tally with overall statistics of periodic statements provided to reinsurers.
Ideally, insurers should provide historical treaty statistics for at least five years or more. With treaty statistics for a longer period, reinsurers would be able to form a comprehensive view on loss experience. A positive view could work in favour of insurers.
For long-tail classes, insurers should provide triangulation data on premium, claims, and commission developments for proportional reinsurance arrangements. Triangulation data help reinsurers with their analysis in determining ultimate loss ratios and combined ratios. For long-tail classes reinsurers would require data from more historical years than that for short-tail classes due to the possibility of late claims development in older years.
Catastrophe exposure aggregates
Generally, Property, Engineering and Motor classes are exposed to natural catastrophe perils. Reinsurance coverage for these and other exposed classes can have a significant bearing on reinsurers providing coverage for them. Therefore, it is paramount that insurers provide sum insured values of policies with coverage for catastrophe event losses (i.e. exposure data) to reinsurers for their analysis.
Typically, exposure data are provided by grouping exposure data from individual policies. The grouping can be at postal code, province, or other defined category levels such as Cresta Zones. However, the granularity can also be at the latitude/longitude level of risks, particularly for facultative reinsurance arrangements.
It is recommended to have exposure data by occupancy types (e.g. Residential, Industrial, Commercial, Warehouse, etc.) and coverage types (e.g. Building, Contents, Business Interruption, etc.) with breakdown by reinsurance arrangements similar to risk and loss profiles for different peril types.
Table 6 shows exposure data for Earthquake peril for a Fire class of business grouped at Cresta Zone level for a Surplus reinsurance arrangement. Grouped exposures have a breakdown by Coverage types. For example, Cresta Zone 1 has 274 risks with a sum insured value of $51.885 million providing coverage for Building, 166 risks with a sum insured value of $67,984 million providing coverage for Contents, 59 risks with a sum insured value of $19,859 million providing coverage for Machinery, and seven risks with a sum insured value of $589,655 providing coverage for Business Interruption for losses arising for an Earthquake event.
Table 6: A sample of earthquake exposures by coverage type for a fire class of business
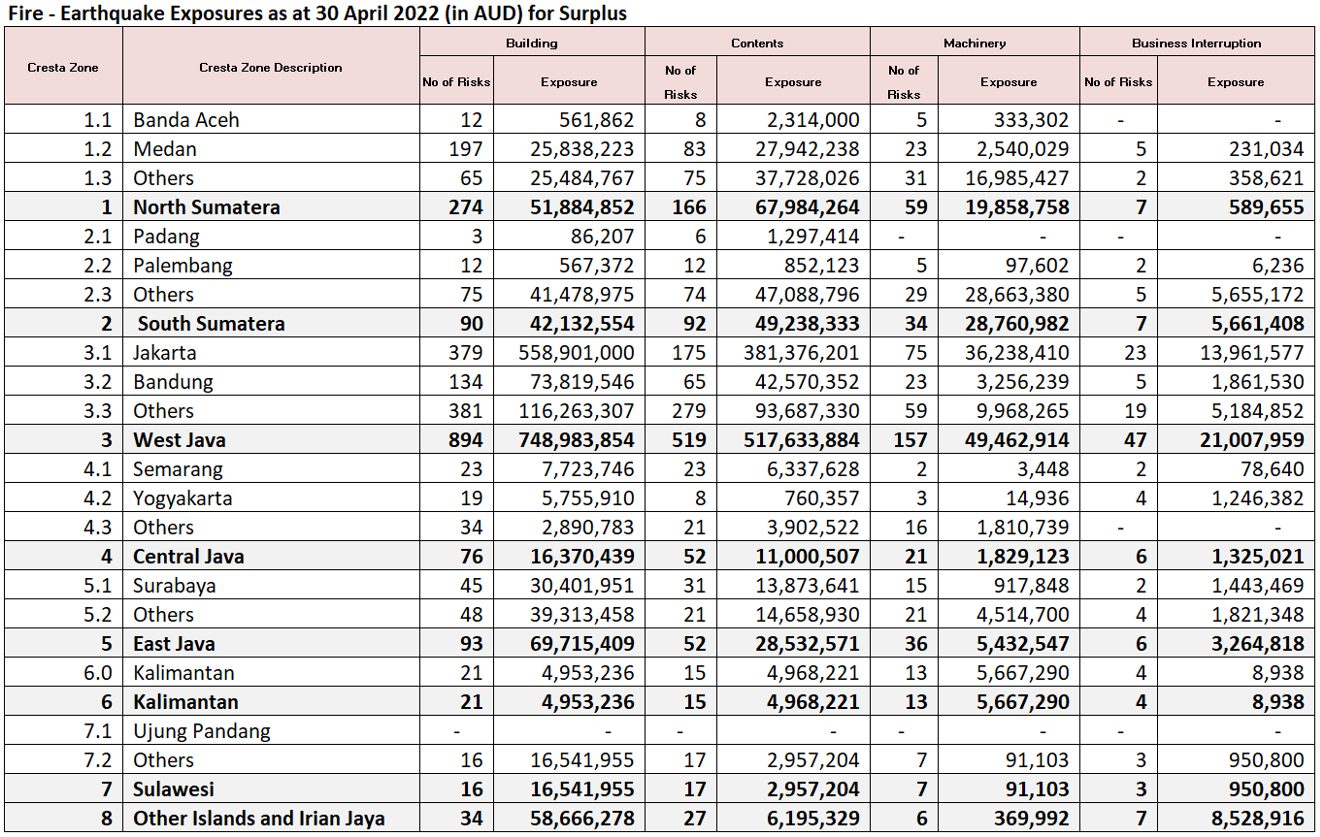
If occupancy types or coverage types are not available at a group level, insurers can provide a very high-level breakdown on overall exposures. For example, in the sample given in Table 6, exposures are grouped at Cresta Zone level with breakdown by Coverage type only. Breakdown by Occupancy types is not available at Cresta level. Therefore, the insurer would provide the breakdown of exposures by Occupancy types on overall exposures.
Ideally, exposure data extraction should be at a specified cut-off date, in which all in-forced policies on that date are extracted. For proportional reinsurance arrangements, preferably, applicable in-forced policies should be separated by coverage year. This separation can help to apply event limits by coverage year with catastrophe risk modelling for runoff proportional reinsurance arrangements. (Note that we are not considering interlocking clauses[6] here).
Revised and projected premiums
It is important to provide projected premium incomes for the new coverage year. The projections include Estimated Premium Income (EPI) ceded to proportional reinsurance arrangements and estimated GNPI applicable to non-proportional reinsurance arrangements. They should be for each class covered. In fact, these projections reflect growth assumptions and are important for risk-adjusted pricing by reinsurers. Generally, reinsurers use growth in premium as a proxy for the growth in exposure (e.g. catastrophe exposure for classes exposed to catastrophe perils). The article mentioned the importance of having realistic projections as the underachievement of targets could work against insurers.
For old coverage years, revised EPIs for proportional reinsurance arrangements and revised GNPIs for non-proportional reinsurance arrangements are required for premium and commission adjustments.
Other items
Apart from the data requirements detailed above reinsurers may request additional information as given below. However, this is not an exhaustive list.
- Primary rate changes – particularly for coverage on classes exposed to catastrophe perils as reinsurers would be concerned with the adequacy of primary rates on underlying catastrophe exposures particularly with climate change impacting catastrophe events.
- List of special risks – A list of risks that require special acceptance by reinsurers as they don’t generally meet all terms and conditions specified in reinsurance contracts.
- Business plans – Ideally a high-level summary of business plans to provide reinsurers with a view of the direction insurers are heading.
- Maximum Retentions – details on the retained maximum sum insured value by the insurer for risk by classes covered in non-proportional reinsurance arrangements.
- Structures – current (or expiring) structures of proportional and non-proportional reinsurance arrangements.
Data extraction date
With the data requirements discussed above, it is recommended to have the data extraction date reasonably close to the inception date of reinsurance coverage in order to provide reinsurers with the most recent data available.
Challenges with data quality
Based on our experience dealing with insurers particularly in less developed and emerging markets for their reinsurance coverage requirements, the following are some common challenges faced by insurers in providing good quality data.
- Legacy systems that are unable to accommodate evolving data requirements.
- Lack of dedicated resources to maintain data and perform data extractions properly.
- Lack of knowledge on data requirements by reinsurers for their analysis.
Possible action to improve data quality
The following are some of the remedial actions insurers can take to improve data quality.
- Train staff on data requirements for reinsurance to overcome the lack of knowledge and raise awareness on the benefits of improving data quality. In fact, brokers can play a pivotal role in raising awareness of the importance of data quality. Brokers can provide data templates, train insurers on data requirements for reinsurance, and raise awareness of how poor data quality can impact insurers’ reinsurance requirements in terms of cost and the availability of coverage.
- Add dedicated/additional resources for data management.
- Good collaboration between IT teams and teams handling reinsurance is also important as in some cases data extractions are performed by IT staff who require a good understanding of data requirements.
Based on our experience, insurers providing good quality data are viewed positively by reinsurers. These insurers are knowledgeable on data requirements, and also tend to have dedicated staff for data management. Furthermore, some tend to be more responsive to concerns and requests from reinsurers in the past regarding data issues.
Conclusion
Data quality plays an integral role in meeting insurers’ reinsurance coverage requirements. Reinsurers tend to penalise insurers for poor data quality, in particular in a hardening reinsurance market like the one we are experiencing now. In extreme cases, reinsurance may refuse coverage. Therefore, it is paramount that insurers have a good understanding of data requirements for reinsurance coverage and are aware of the need to maintain data quality at levels acceptable to reinsurers. After all, data help to tell a compelling story about insurers on their reinsurance protection requirements.
|
Special Note: Thank you to Mudit Gupta (FIAA) and Frederic Boulliung (FSAS) for reviewing the article and providing invaluable feedback.
|
|
References
|
CPD: Actuaries Institute Members can claim two CPD points for every hour of reading articles on Actuaries Digital.