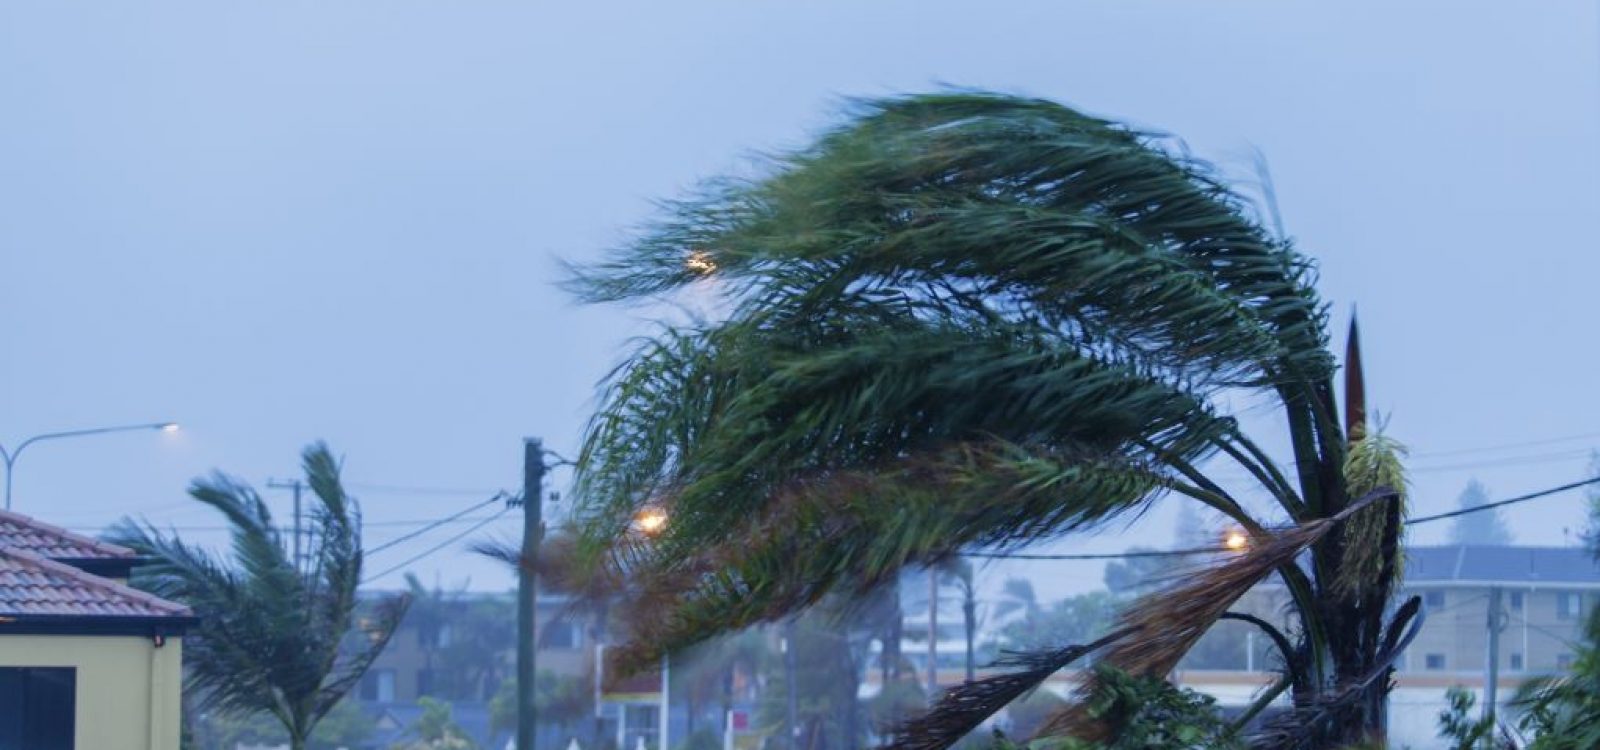
What costs more: a windstorm or a market crash?
Niki Appleton reviews ‘GDP@Risk’, the new Lloyds City Risk Index 2015-2025 measuring world economic output at risk from manmade and natural threats.
Eighteen manmade and natural threats, impacting 301 cities over a ten year period has a potential economic cost of US$4.56trn.[i] That was the finding from the new Lloyds City Risk index 2015-2025.
Lloyds in conjunction with Cambridge Centre for Risk Studies at the University of Cambridge Judge Business School have developed an index – GDP@Risk that measures the economic output at risk from such events. The purpose of the index is to understand the potential exposure to manmade and natural threats and the impact on the world economy.
With globalisation interconnecting the world and greater concentration of wealth and people in urban centres, the exposure to the impact of these disruptive threats is becoming more preponderant.
How is it calculated
The GDP@Risk examines the reduction in economic output for a city when a particular catastrophic event occurs, such as the reduction in a city’s economy over five years if (say) a terrorist event occurs, compared to the city’s economic output if no event occurred. The GDP@Risk for each event is estimated as the probability of an event occurring combined with the expected magnitude of the economic loss.
For example a one in fifty year event such as extreme heatwave and/or bushfire, combined with an expected loss for an Australian city, based on historical losses, is in the vicinity of $3bn, giving a GDP@Risk of $0.6bn (Noting the estimated impact is calculated over the ten year period 2015 to 2025). The likelihood and severity vary from city to city depending on its location and risk characteristics. Cities can be impacted by a multitude of catastrophic events.
The index examines 18 different events (see below). The GDP@Risk for a particular city sums up the probability weighted expected loss of each of the 18 events occurring over the ten year period.
Events
Eighteen events were analysed giving the following estimated impacts across all 301 cities.
Figure 1: GDP@Risk for different events:
The nature of these events are changing, with the severity and frequency of some natural catastrophes increasing with climate change. Some man-made events such as market crash, power outage and nuclear accidents are becoming more prevalent through globalisation of companies and technologies. Other events are new and emerging, having a growing impact, such as cyber-attack, human pandemic and solar storm.
Noting that Market Crash alone represents a quarter of the Total GDP@Risk and the sum of manmade threats equate to almost a third.
Cities
The selection of the 301 cities considered the city’s population size; significance of the city to world GDP; a cross section of ten regions; and the largest cities from the 50 largest economies. Half of all national capital cities were included. It is expected that these cities combined will produce half of the world’s GDP in 2015.
Cities greatest at risk are those with the highest economic value, combined with high exposure to catastrophic events. With Taipei, Tokyo, Seoul and New York topping the highest risk cities. The index shows that emerging economies have an increasing proportion of financial risk with their accelerated economic growth.
Just over 70% of Total GDP@Risk is estimated to be associated with these emerging economies. Often these cities are also highly exposed to catastrophes, such as Lima and Tehran with high exposure to earthquakes, whereas developed cities such as New York and London have a larger proportion of their GDP@Risk (around 60%) associated with manmade threats.
Australasia cities include Sydney, Melbourne, Brisbane, Perth, Adelaide, Canberra, Auckland and Wellington. The Total GDP@Risk for this combined area is 88.57bn. This compares to $90.4bn for New York and $69.4bn for Lima.
Figure 2 GDP@Risk of a selection of cities:
The greatest threats for the Australasia area are a market crash, cyber-attack, human pandemic, flood and drought.
Lloyds City Risk Index Use
Whilst the absolute level of the risk may be uncertain, the index is useful to compare relative risks between cities and the impact of different events. Noting that one event may have a very different estimate risk depending on the city. So the answer to the question which costs more: market crash or windstorm, is: it depends.
In Manila, a market crash is estimated to cost $4.8bn compared to $60.7bn for a windstorm. However in New York a market crash is estimated to cost $25.1bn compared to $0.1bn for a wind storm.
Where to from here?
Governments, organisations and communities need to consider how to mitigate the risks, whether through investment in resilient infrastructure, crisis management and planning. How severe the impact of a catastrophe depends on how quickly the economy can recover. This means ready access to capital following an event.
Lloyds purport that insurance has a key part to play, with “a 1% rise in insurance penetration translates into a 13% reduction in uninsured losses – a 22% reduction in taxpayers’ contribution following a disaster”[ii]. Furthermore insurance can provide a rapid source of capital to help restore the economy following an event.
[i] All figures are in this article are in US dollars
[ii] Lloyds City Risk Index 2015-2025 Executive Summary
CPD: Actuaries Institute Members can claim two CPD points for every hour of reading articles on Actuaries Digital.


